

Abstract
Neutrophils migrating towards chemoattractant gradients amplify their recruitment range by releasing the secondary chemoattractant leukotriene B4 (LTB4)1,2. We previously demonstrated that LTB4 and its synthesizing enzymes, the 5-lipoxygenase (5-LO), 5-LO activating protein (FLAP), and leukotriene A4 hydrolase (LTA4H), are packaged and released in exosomes3. We now report that the biogenesis of the LTB4-containing exosomes originates at the nuclear envelope (NE) of activated neutrophils. We show that the neutral sphingomyelinase 1 (nSMase1)-mediated generation of ceramide enriched lipid-ordered microdomains initiates the clustering of the LTB4-synthesizing enzymes on the NE. We isolated and analyzed exosomes from activated neutrophils and established that the FLAP/5-LO-positive exosome population is distinct from that of the CD63-positive exosome population. Furthermore, we observed a strong co-localization between ALIX and FLAP at the periphery of nuclei and within cytosolic vesicles. We propose that the initiation of NE curvature and bud formation is mediated by nSMase1-dependent ceramide generation, which leads to FLAP and ALIX recruitment. Together, these observations elucidate the mechanism for LTB4 secretion and identify a non-conventional pathway for exosome generation.
Keywords: neutrophil, exosomes, Leukotriene B4, multivesicular bodies, nuclear envelope, ceramide microdomains, membrane remodeling
Neutrophils represent the first line of defense at sites of injury or infection4. Upon exposure to primary chemoattractants, e.g., formyl peptide N-Formyl-methionine-leucyl-phenylalanine (fMLF), neutrophils rapidly secrete the secondary chemoattractant leukotriene B4 (LTB4) which serves to maintain the robustness and sensitivity to primary chemoattractant signals and dramatically increase the range and persistence of migration5. LTB4-synthesis is initiated with the release of arachidonic acid (AA) through phospholipid hydrolysis mediated by the translocation of cytosolic-phospholipase A2 (cPLA2) to the nuclear envelope (NE)6. The NE-associated transmembrane protein, 5-lipoxygenase activating protein (FLAP), presents the released AA to 5-lipoxygenase (5-LO), which generates leukotriene A4 (LTA4). LTA4 is in turn quickly hydrolyzed to LTB4 by LTA4 hydrolase (LTA4H)7. It has been shown that the LTB4-synthesizing enzymes are present in exosomes secreted from macrophages, dendritic cells, and chemoattractant-activated neutrophils3,8. Exosomes are synthesized as intraluminal vesicles (ILVs) within multivesicular bodies (MVBs) and secreted upon fusion of MVBs with the plasma membrane. The sorting of cargos packaged in ILVs is mediated by the tetraspanin CD63, the endosomal sorting complex required for transport (ESCRT) complexes, or affinity towards neutral sphingomyelinase (nSMase)-dependent ceramide-rich lipid microdomains9. The inhibition of LTB4 synthesis ex vivo5 or in vivo10,11,12 or the inhibition of exosome release through neutral sphingomyelinase1 (nSMase1) knockdown3 results in diminished neutrophil recruitment in response to sterile injury or bacterial peptides with a concomitant decrease in recruitment range. In this context, we envision that the packaging of LTB4 in exosomes provides a mechanism to support intercellular signaling in harsh extracellular environments.
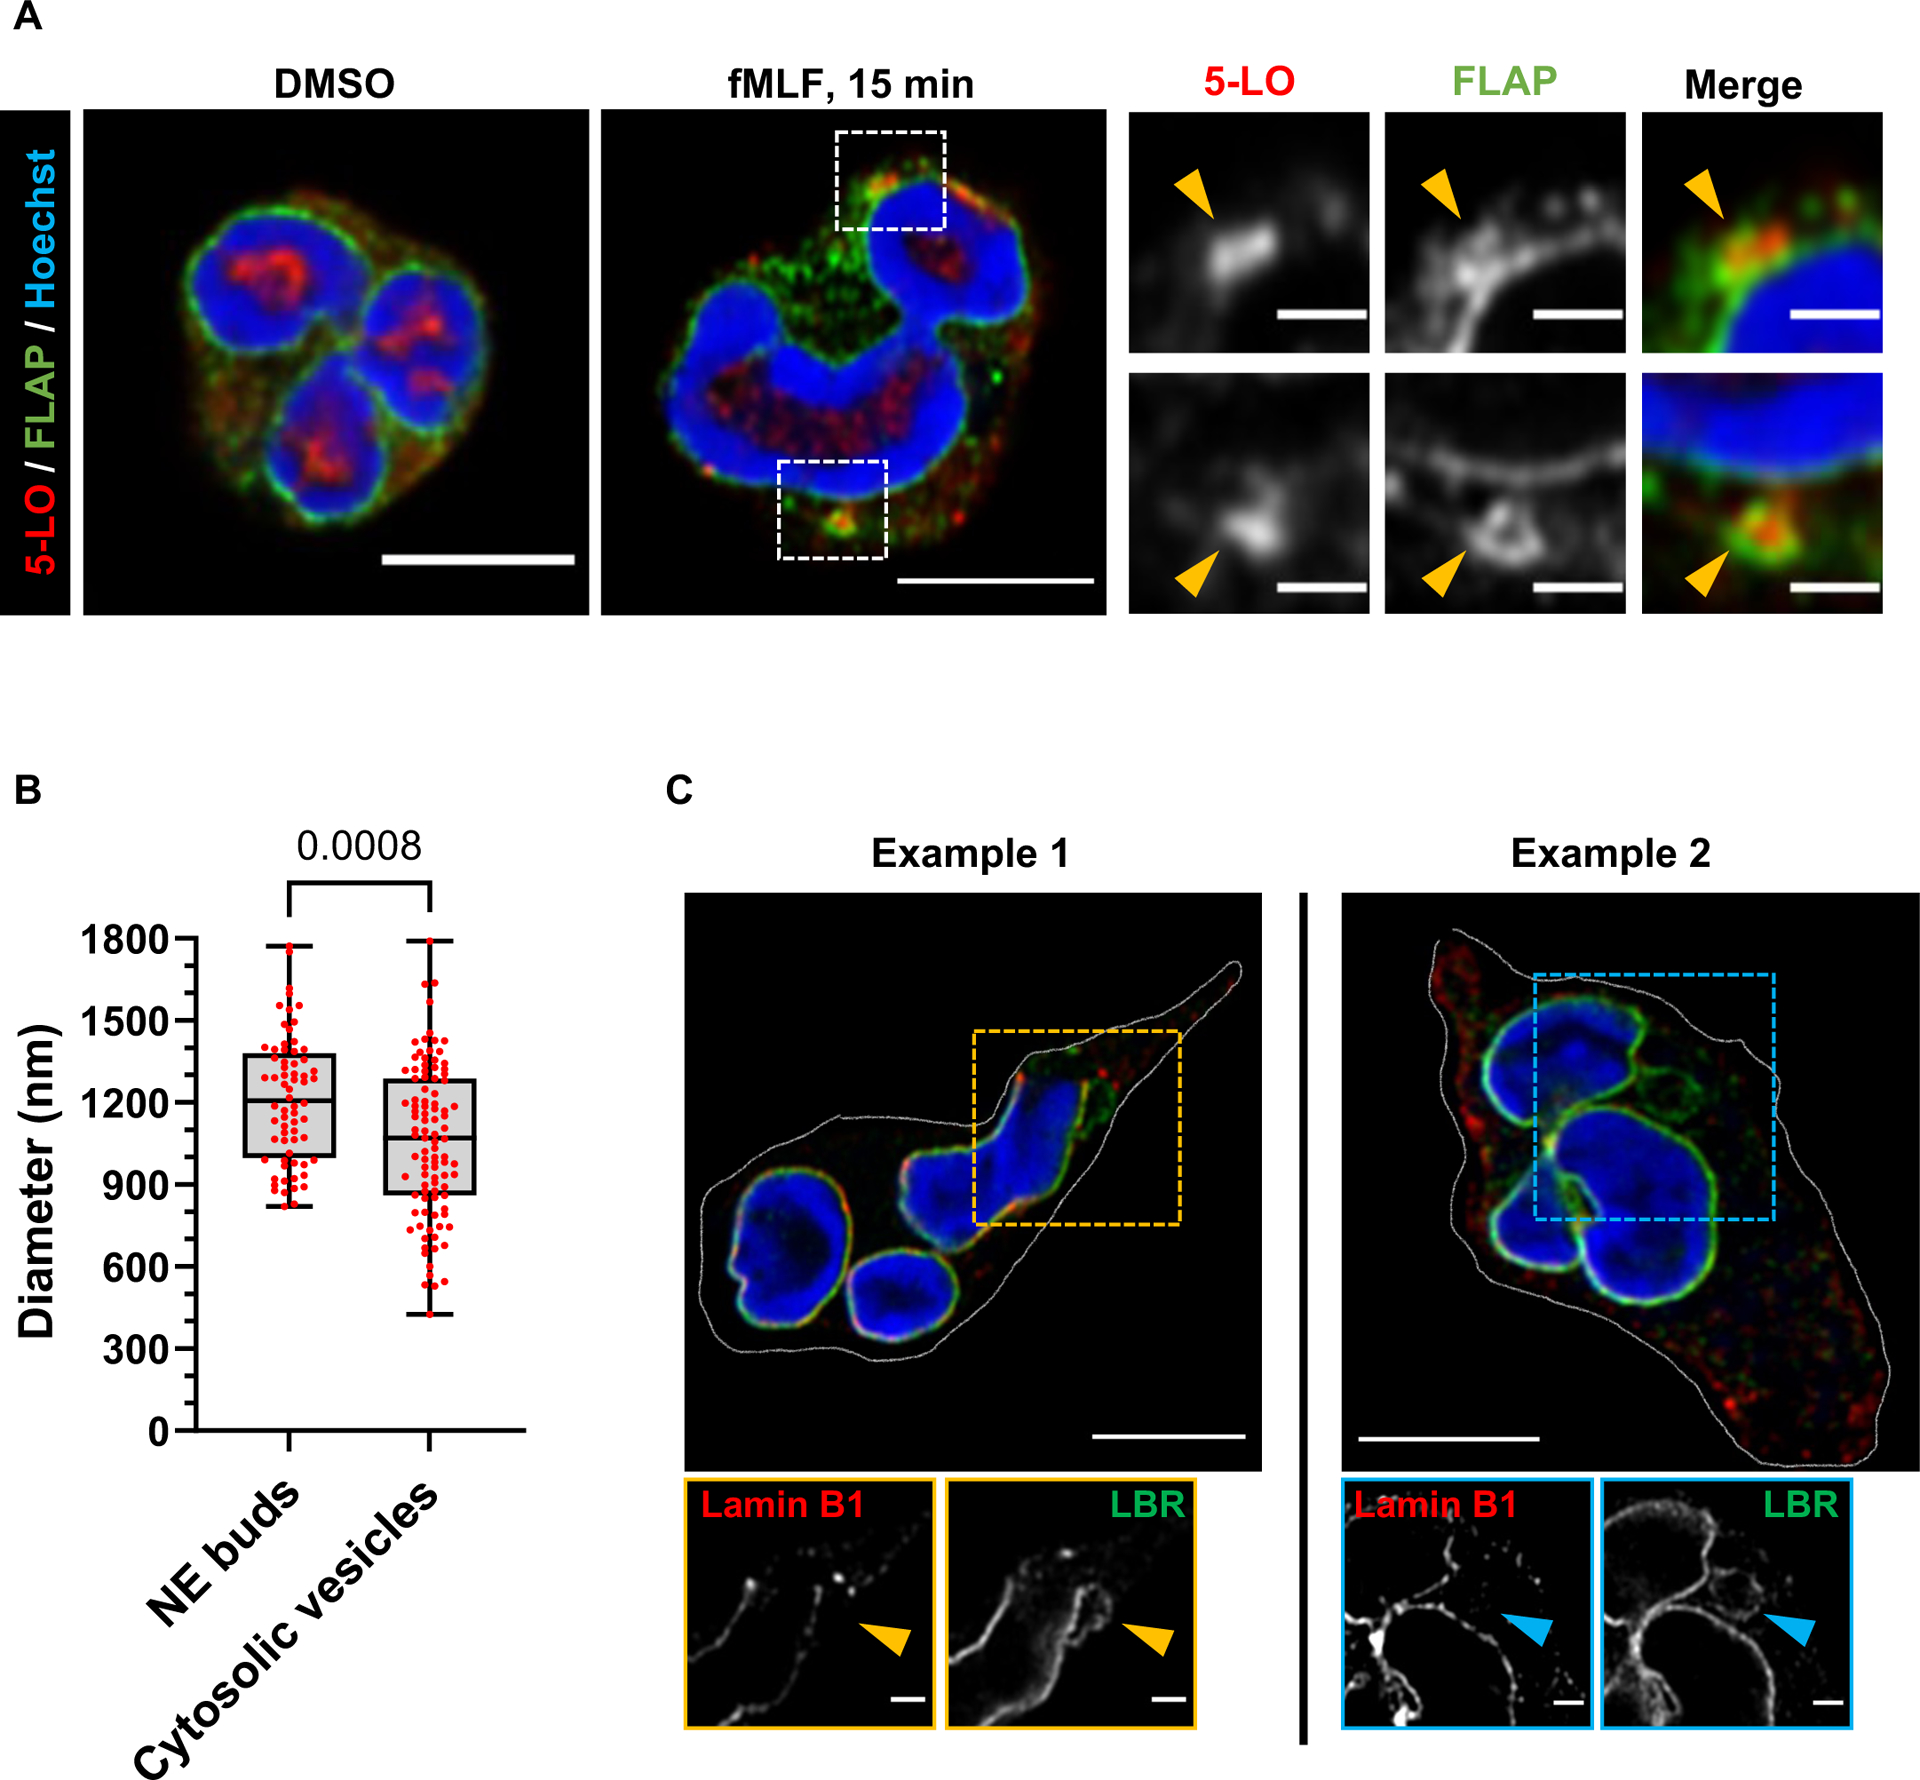
To gain more insight into the mechanisms that regulate the biogenesis of LTB4-containing exosomes, we measured FLAP and 5-LO distribution in activated human peripheral blood-derived primary polymorphonuclear neutrophils (PMNs) uniformly stimulated with fMLF. In resting cells, while FLAP clearly showed NE and reticulate (endoplasmic reticulum) localization, 5-LO mainly localized inside the nucleus. However, 15 min after fMLF addition, we readily observed the appearance of FLAP-positive NE buds that also contained 5-LO (Extended data Fig. 1A). The NE origin of these buds was confirmed using the inner-nuclear membrane (INM) resident protein, Lamin B Receptor (LBR), which we observed around 5-LO-positive perinuclear as well as cytosolic vesicles (Fig. 1A). The temporal increase in the percentage of PMNs with LBR-positive NE buds and cytosolic vesicles upon fMLF stimulation highlights the requirement for chemotactic activation in the generation of NE-derived buds and cytosolic vesicles (Fig. 1B). Similar findings were observed in PMNs chemotaxing towards fMLF (Fig. 1C&D), where we observed that theLBR-positive vesicles present in the cytosol are consistently smaller in size, compared to the NE-associated buds in these cells (Fig. 1C, D and Extended data Fig. 1B). We also observed the presence of LTA4H within the LBR-positive NE-buds and cytosolic vesicles (Fig. 1E&F), substantiating the nuclear origin of the LTB4-containing exosomes. NE budding and vesiculation have been reported during the formation of micronuclei in cancer cells and are characterized by the presence of the nucleoskeleton proteins, LaminB1 and/or Lamin A/C, along with the DNA repair machinery in LBR-positive vesicles13,14. To rule out the possibility that the LBR-positive NE buds and cytosolic vesicles we observed are micronuclei, we immunostained chemotaxing PMNs with Lamin B1 as PMNs express very low levels of Lamin A/C and are devoid of measurable DNA repair15. We found that the LBR positive buds and cytosolic vesicles are devoid of Lamin B1 signal (Extended data Fig. 1C).
Figure 1. The LTB4-synthesizing machinery is packaged in NE-derived buds and cytosolic vesicles in activated neutrophils.
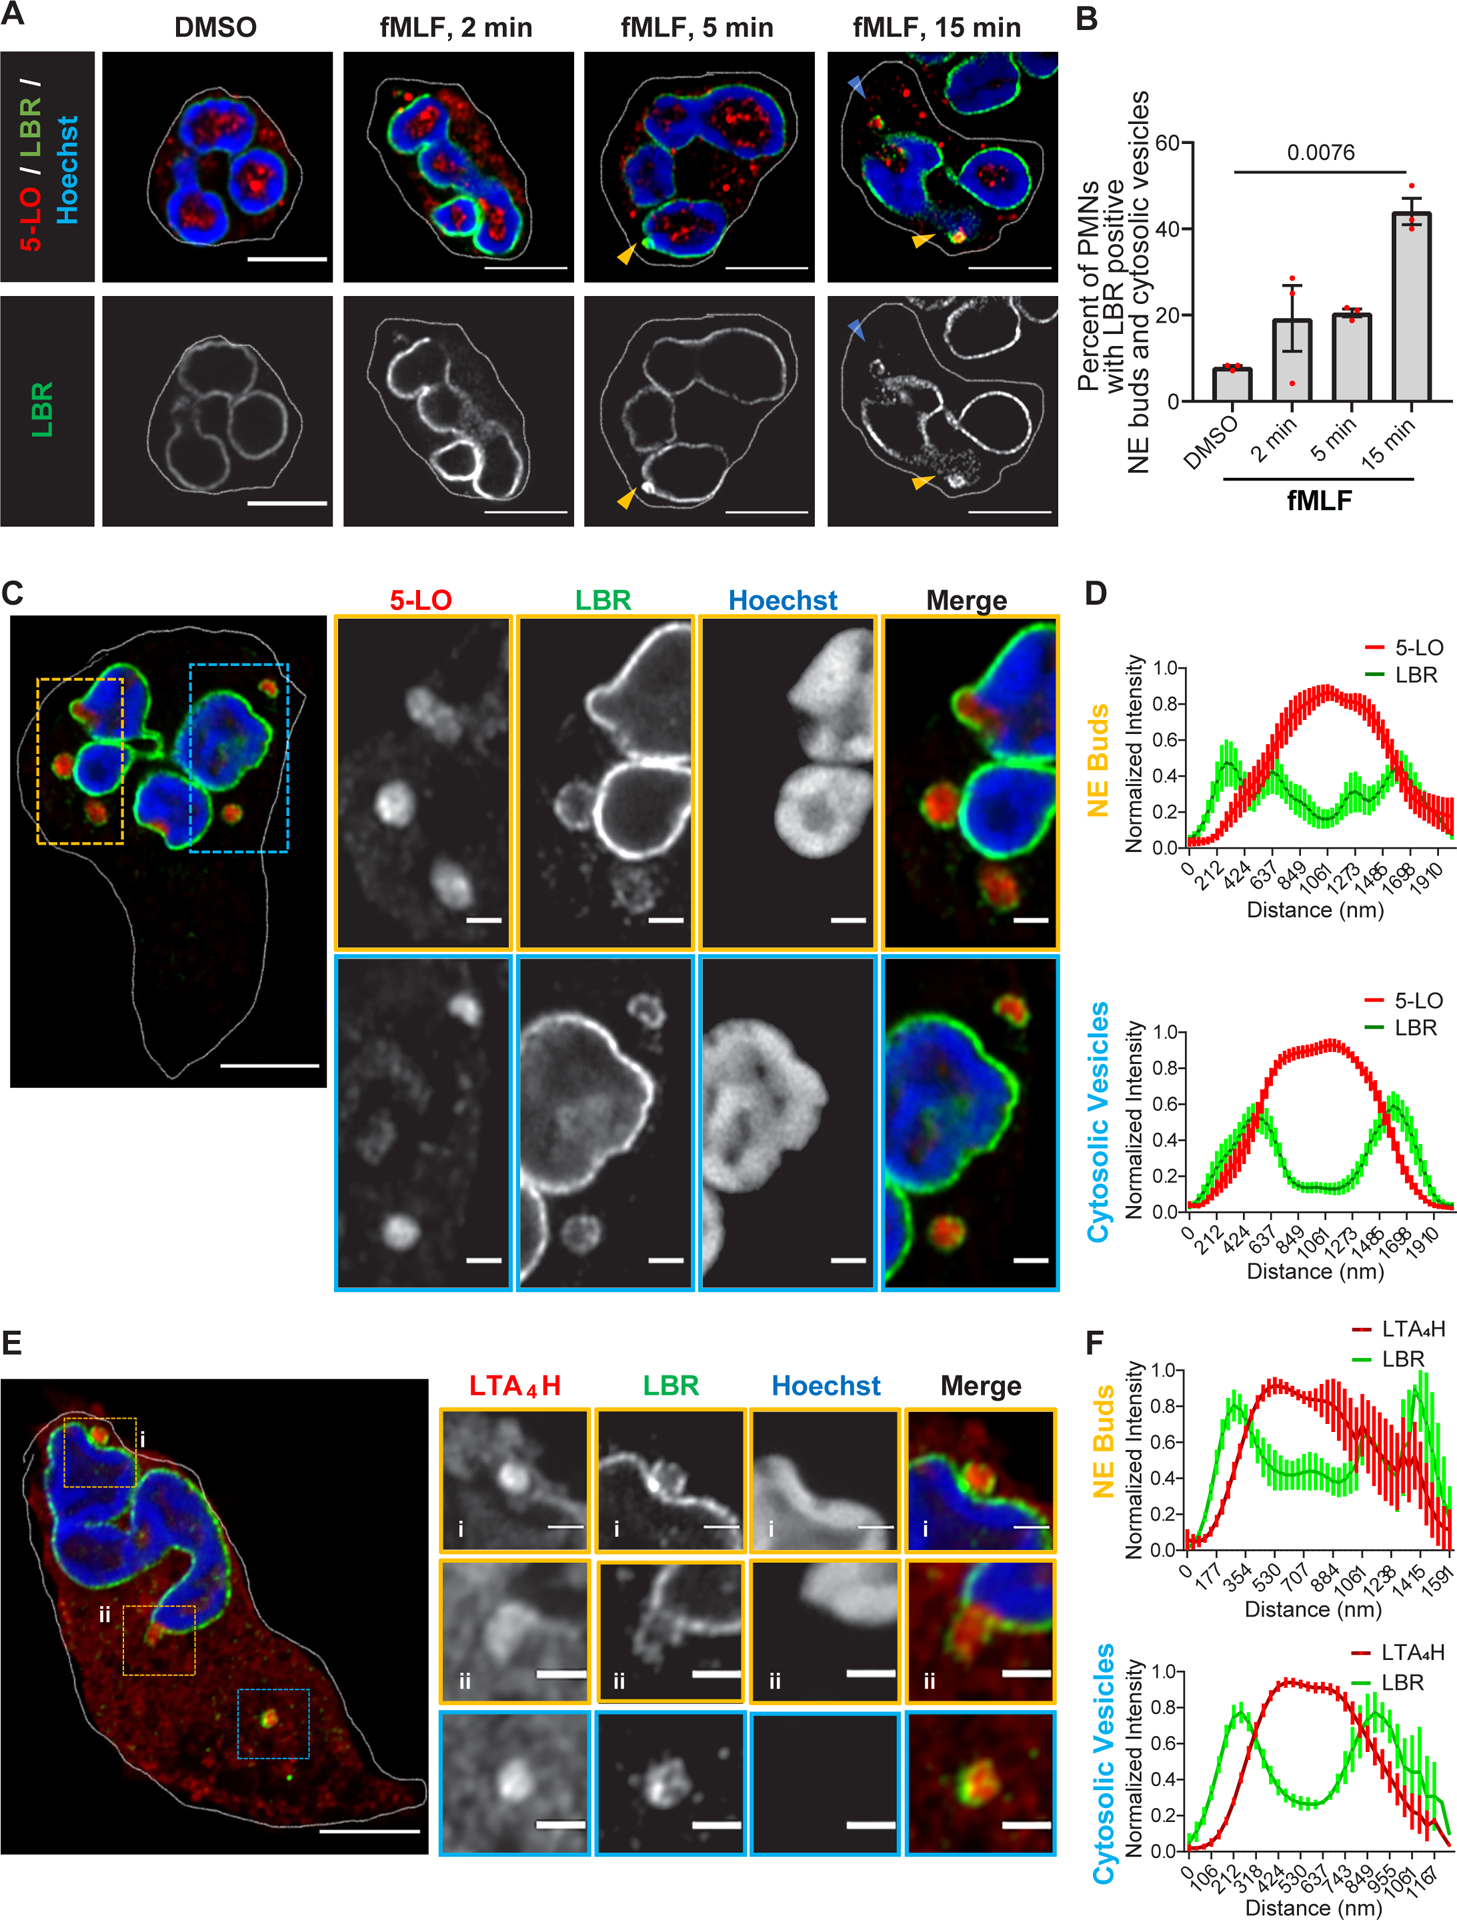
A Representative Airyscan microscopy images showing the distribution of LBR (green) and 5-LO (red) in fixed PMNs uniformly stimulated with 20 nM fMLF (n=3). The yellow arrowheads point to nuclear buds and the blue arrowheads point to cytosolic vesicles. Scale bar is 5 μm.
B Scatter dot plot showing the percentage of PMNs containing LBR-positive buds and cytosolic vesicles in a field of randomly selected images. Data collected from 50, 46, 74, and 66 cells in DMSO, 2min, 5 min, and 15 min fMLF treatment, respectively, pooled from three independent experiments are plotted as mean ± SEM. Each dot represents the value from one experiment. P=0.0076 as obtained from RM one-way ANOVA analysis.
C Representative Airyscan microscopy images of PMNs chemotaxing towards 100 nM fMLF and stained for LBR (green) and 5-LO (red), obtained from six independent experiments. NE buds are shown in yellow boxes and cytosolic vesicles are shown in blue boxes. Scale bar is 5 μm. In magnified insets, the scale bar is 1 μm.
D Histograms showing the normalized intensity of LBR and 5-LO across the diameter of LBR positive buds and cytosolic vesicles. Data points from 15 vesicles and 13 buds within 11 cells pooled from four independent experiments are plotted as mean +/− SEM, with the bold line showing the mean and bar representing the SEM.
E Representative Airyscan microscopy images of fixed PMNs chemotaxing towards 100 nM fMLF and stained for LBR (green) and LTA4H (red), obtained from three independent experiments. See panel C for more details. Scale bar is 5 μm. In the inset, it is 1 μm.
F Histograms showing the normalized intensity of LBR and LTA4H across the diameter of LBR positive buds and cytosolic vesicles. Data points from 5 vesicles and buds each within 5 different cells pooled from three independent experiments were plotted as mean +/− SEM, with the bold line showing the mean and bar representing the SEM. Source numerical data are available in the source data file.
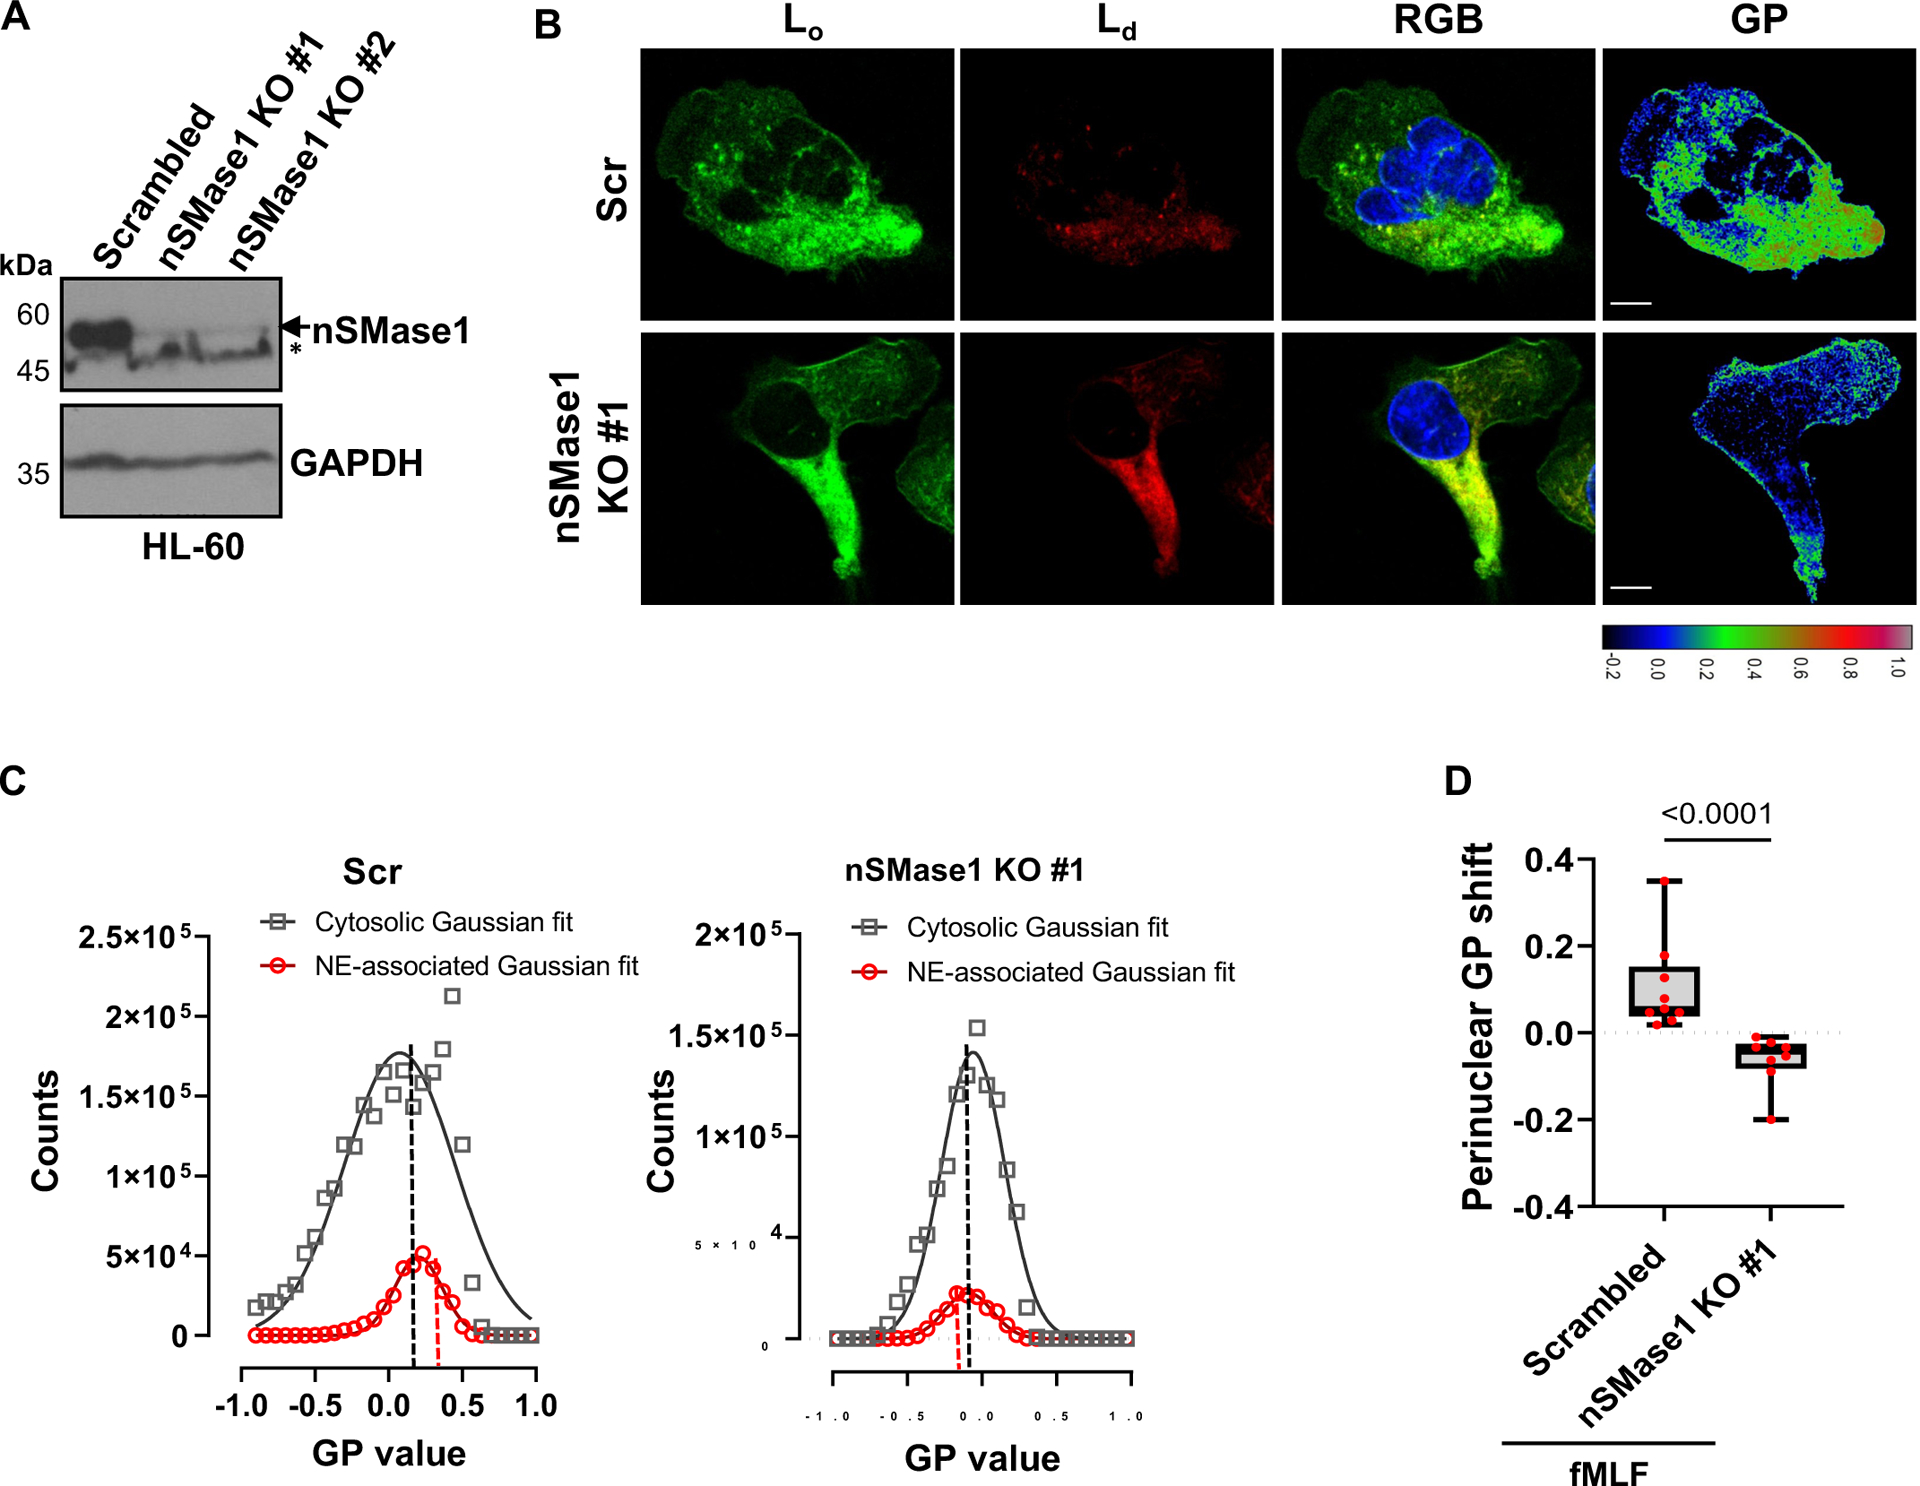
Changes in lipid bilayer symmetry are required to induce membrane curvatures for the initiation of budding. Whereas certain transmembrane or BAR-domain-containing proteins are involved in facilitating membrane curvature, the localized presence of lipids, such as ceramide and lysophosphatidic acid, has also been reported to induce changes in membrane curvature16. Furthermore, lipid-ordered domains that contain ceramide and the ganglioside GM1 are required for the assembly of various signaling complexes and their endocytosis17,18. To assess whether membrane microdomains are involved in NE budding we performed confocal fluorescence microscopy of chemotaxing PMNs in the presence of the phase transition sensitive lipid probe di-4ANEPPDHQ19. We took advantage of the blue shift in fluorescence of di-4ANEPPDHQ upon binding with lipids in ordered membrane environments, to acquire general polarization (GP) images of chemotaxing PMNs, where high GP values indicate lipid ordered (Lo) domains. Time-lapse imaging showed spatiotemporal increases in regions of high GP values in punctae close to the nucleus in PMNs chemotaxing towards fMLF (Supplementary movie S1) and quantification revealed the abundance of Lo punctae within 1μm of the nucleus compared to the rest of the cell (Fig. 2A&B). Sphingomyelin, the major phosphosphingolipid in mammalian cells, is hydrolyzed to ceramide and phosphocholine by the action of sphingomyelinases20. The enrichment of ceramide coalesces nanoscale lipid domains leading to the formation of microscopic ceramide-rich signaling platforms21. The nSMase1 and its substrate sphingomyelin are abundant in the nucleus22 and the depletion of nSMase1 from cancer cells23, neuronal cells24, or neutrophils3 has been reported to decrease the secretion of CD63-positive exosomes as well as FLAP/5-LO-positive exosomes from neutrophils. We, therefore, assessed the role of nSMases on the generation of the nuclear lipid microdomains in chemotaxing PMNs using the nSMase inhibitor GW486923 and found a strong dependence between nSMase activity and the generation of perinuclear Lo domains (Fig. 2C&D). In addition, we found similar defects in differentiated HL-60 (dHL-60) cells genetically lacking nSMase1 (Extended data Fig. 2A–D).
Figure 2. nSMase1 facilitates the recruitment of the LTB4 synthesizing machinery on lipid-ordered NE microdomains.
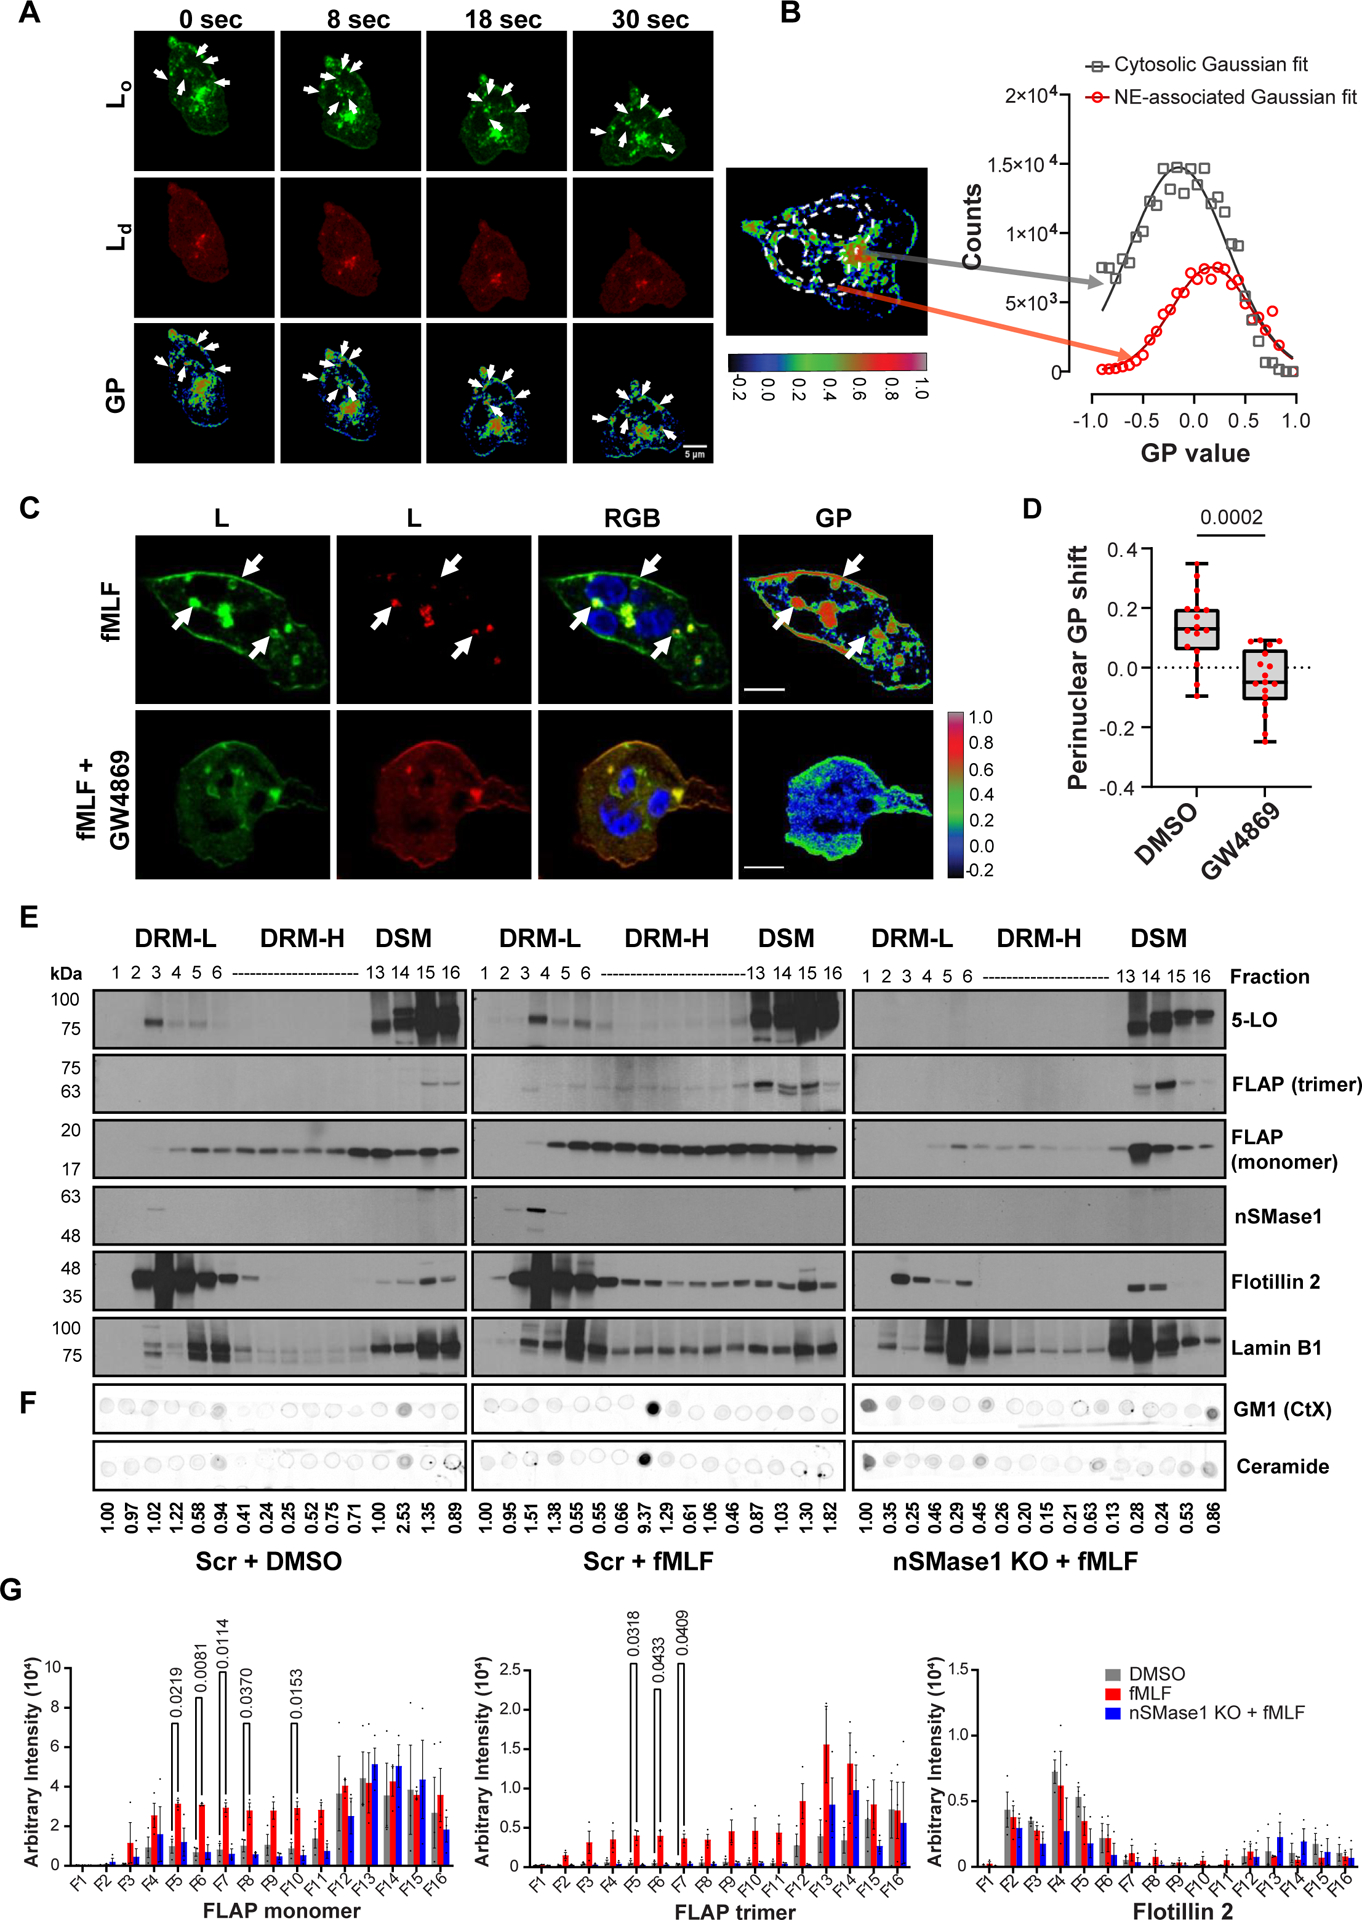
A Representative fluorescence images of di-4-ANEPPDHQ-stained PMNs chemotaxing towards 100 nM fMLF (n=5), showing the temporal distribution of the lipid-ordered (Lo) domains (green), lipid-disordered (Ld) domains (red), and the corresponding GP image. Pseudo-colored GP images are based on the colormap, with white/red shades depicting lipid ordered regions and blue/darker shades representing lipid disordered regions. White arrows mark the perinuclear vesicular regions of high GP values. Scale bar is 5μm.
B Histogram depicting the gaussian distribution of the GP pixel intensity obtained from the two ROIs as depicted in the left image, with the cytosol ROI (gray arrow) 1 μm from the nuclear boundary and the perinuclear ROI (red arrow) extending up to 1 μm from the nucleus.
C Representative fluorescence images of di-4-ANEPPDHQ-stained PMNs chemotaxing towards 100 nM fMLF in the presence of DMSO or 3 μm GW4869 (n=3). The lipid-ordered (Lo) domains (green), lipid-disordered (Ld) domains (red), RGB images as the merge of Ld, Lo, and Hoechst (blue), and GP images are presented. For color scale, refer to panel A. White arrows show the perinuclear vesicular regions of high GP values. Scale bar is 5 μm. Also, see Supplementary Movie S1.
D Graph showing the median value of the perinuclear GP intensity distribution of DMSO- and GW4869-treated PMNs chemotaxing towards fMLF, presented as a box-whisker plot where whiskers indicate the range, and the boundary of the box closest to the x-axis indicates 25th percentile, while farthest one indicates 75th percentile. The line within the box represents the median and the red dots indicate16 data points from the DMSO sample and 17 from the GW4869 sample (n=3). P value quantified using the two-tailed Mann-Whitney test.
E Representative western blots showing the distribution of various proteins in DRM-L, DRM-H, and detergent soluble membranes (DSM) fractions isolated from the NE of Scr or nSMase1 KO dHL-60 cells stimulated with 100 nm fMLF (n=3). Lamin B1 is used as a loading control.
F Representative dot-blots of lipids isolated from the fractions shown in panel E stained for GM1 or ceramide (n=2). The ceramide intensity values of the spots relative to lane 1 of each condition are indicated below the dot blot.
G Bar graphs depicting the arbitrary intensity of FLAP monomer, FLAP trimer, and Flotillin 2 signal in the different fractions of either DMSO- or fMLF-treated Scr cells or fMLF-treated nSMase1 KO cells. Data are plotted as mean ± SEM, and P values are determined using two-way ANOVA, with DMSO as a control column (n=3). Source numerical data and unprocessed blots are available in the source data file.
Lipid-ordered domains are resistant to solubilization in non-ionic detergents, by virtue of their ceramide-, GM1- and cholesterol-rich composition25. To assess the role of nSMase1-dependent lipid ordering in the recruitment of FLAP and 5-LO at sites of NE budding, we isolated nuclei from resting and fMLF-stimulated Scramble (Scr) and nSMase-1 KO dHL-60 cells and separated detergent-resistant membranes (DRMs) and detergent soluble membranes (DSMs) (Extended data Fig. 3A). The purity of the nuclear preparation from resting dHL-60 cells was assessed using GAPDH (cytosol marker), calreticulin (ER marker), LBR (NE marker), Histone H3 (chromatin marker), and LTB4 synthesizing machinery, FLAP, and 5-LO (Extended data Fig. 3B). Flotillin 2 and Lamin B1 were used as ordered lipid microdomain marker and as a loading control, respectively (Fig. 2E). We found an increase in the intensity of FLAP monomers and trimers – the functional form of FLAP26- along with 5-LO in both light detergent resistant membrane fractions (DRM-L) enriched with Flotillin 2 as well as in heavy DRM fractions (DRM-H) enriched with ceramide/GM1, upon fMLF stimulation in Scr dHL-60 cells (Fig. 2E&F). nSMases have been reported to bind sphingomyelin-rich nanodomains for ceramide generation and to dissociate from ceramide-rich microdomains/DRM-H27, accordingly, we found that nSMase1 was only enriched in DRM-L fractions (Fig. 2E). Remarkably, we observed a dramatic inhibition of monomeric and trimeric FLAP signals in the DRM-L and DRM-H fractions in nuclei isolated from fMLF-activated nSMase1 KO dHL-60 cells compared with Scr dHL-60 cells, which also showed a loss of ceramide/GM1 in DRM-H fractions, while Flotillin 2 levels remained grossly unchanged (Fig. 2E–G). Since low temperatures employed during the biochemical isolation of DRMs can artificially induce the formation of DRMs in some cases28, we assessed FLAP aggregation on the NE of fixed nuclei isolated from either DMSO- or fMLF-treated Scr or nSMase1 KO dHL-60 cells. As depicted in Figure 3A, we observed an increase in the regions with high FLAP signal intensity in fMLF-stimulated Scr dHL-60 cells compared to DMSO-treated Scr and fMLF-treated nSMase1 KO dHL-60 cells, demonstrating a nSMase1-dependent increase in FLAP recruitment in response to fMLF activation (also see Supplementary movie S2). However, the absence of nSMase1 did not alter the decrease in the nuclear sphericity observed in response to fMLF stimulation (Fig. 3B). We next labeled the nuclei isolated from PMNs with antibodies against ceramide and FLAP and assessed object colocalization from 3D-reconstructions of z-stacks imaged using Airyscan microscopy. We observed defects in the fMLF-induced increase in the colocalization of FLAP with ceramide clusters in the nuclei isolated from GW4869-treated PMNs (Fig. 3C, Supplementary movie S3). Upon quantification, we measured a significant decrease in FLAP-ceramide co-occurrence and correlation with nSMase inhibition in fMLF activated PMNs (Fig. 3D). Together, these findings establish the requirement of nSMase1 for the ceramide-dependent enrichment of FLAP on the NE of activated neutrophils and dHL-60 cells.
Figure 3. nSMase-dependent enrichment and colocalization of FLAP with ceramide-positive structures on the NE of activated neutrophils.
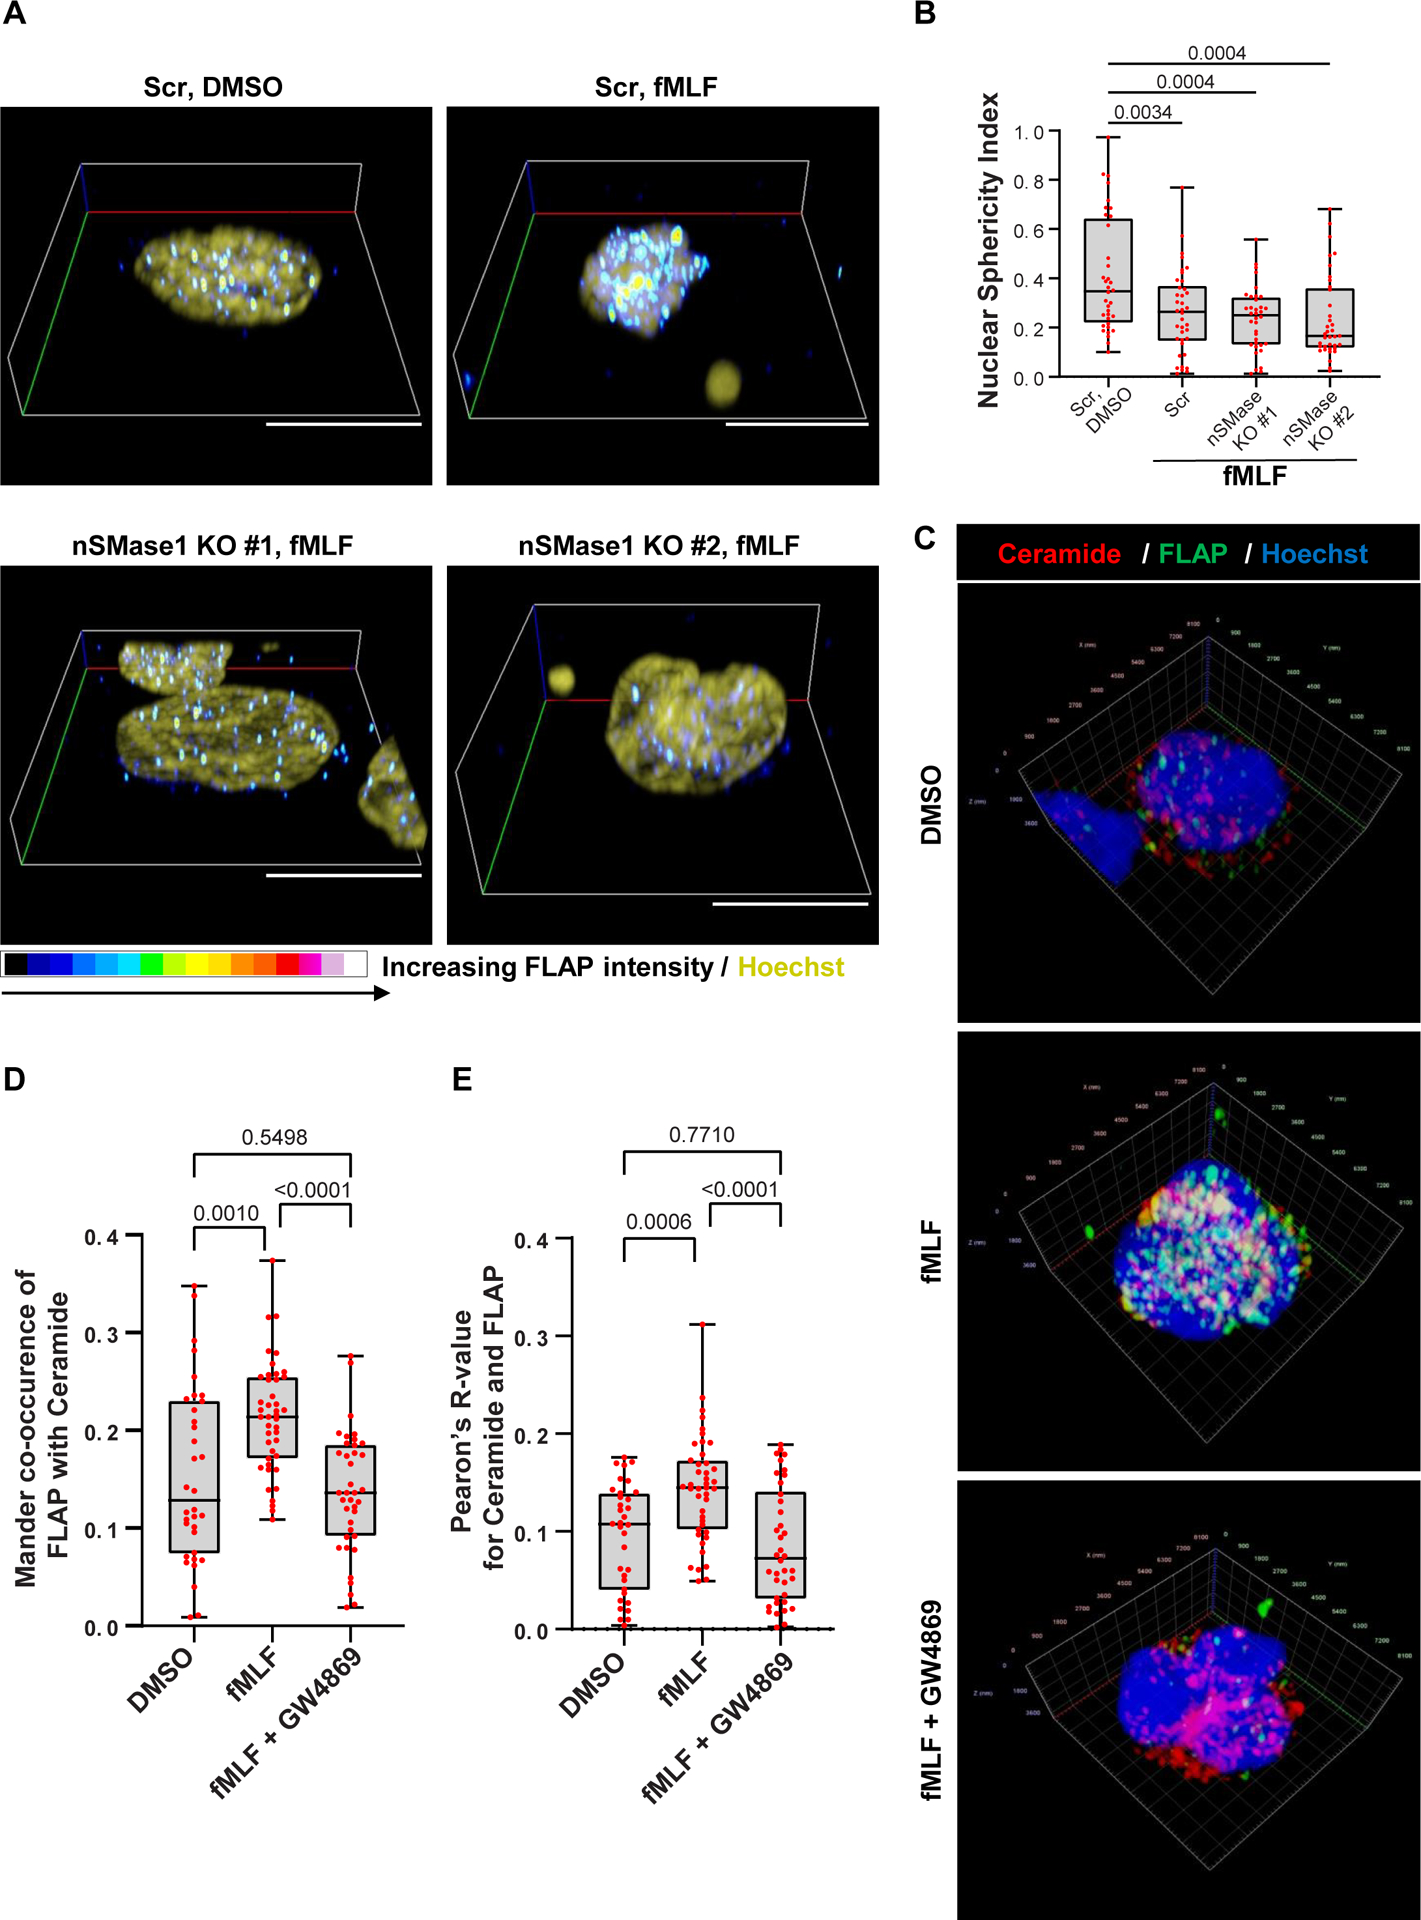
A Representative 3D volumetric render of the fixed nuclei isolated from DMSO or fMLF (100 nM) stimulated Scr or nSMase1 KO dHL-60 cells stained for FLAP (spectrum) and Hoechst (olive). Red/whiter shades as shown in the colormap, denote higher FLAP intensity whereas blue/darker shades represent regions of lower FLAP abundance (n=3). Scale bar is 5 μm. Also, see Supplementary Movie S2.
B Box-whisker plots showing the sphericity of isolated nuclei obtained from 3D-reconstructed images. The whiskers indicate the range, and the boundary of the box closest to zero indicates 25th percentile, while the farthest one indicates 75th percentile. The line within the box represents the median and the red dots indicate data points from at least 36 cells (n=3). P values were determined using Tukey’s multiple comparisons test with ordinary one-way ANOVA.
C Representative 3D volumetric render of the nuclei isolated from PMNs stimulated with either DMSO or fMLF (100 nM) in the presence or absence of GW4869 (3 μM), and immunostained for ceramide (red), FLAP (green), and Hoechst (blue) (n=3). Scale shown on xyz-axis. Also, see Supplementary Movie S3.
D-E Box-whisker plots showing the Mander co-occurrence coefficient (D) and Pearson’s R-value (E) between FLAP- and ceramide-positive structures present on the NE under the indicated conditions, calculated using 3D-reconstructed multiple z-stack images. The whiskers indicate the range, and the boundary of the box closest to zero indicates 25th percentile, while the farthest one indicates 75th percentile. The line within the box represents the median and the red dots indicate all 34 datapoints of DMSO, 43 of fMLF, and 38 of fMLF + GW4869 (n=3). P values determined using ordinary one-way ANOVA, are indicated on the graph. Source numerical data and unprocessed blots are available in the source data file.
We next sought to visualize the distribution of nSMase1 and ceramide in PMNs. We stained PMNs chemotaxing towards fMLF with ceramide and LBR and observed ceramide staining on the NE as well as on the inner periphery of LBR-positive NE buds and cytosolic vesicles (Fig. 4A, B). We also found a strong colocalization between nSMase1 and ceramide and between nSMase1 and 5-LO on NE buds and cytosolic vesicles (Fig. 4C&D). Consistent with the previously reported nuclear localization of nSMase122, we observed nSMase1 localization on the NE (Fig. 4D, green arrows). Similarly, in dHL-60 cells expressing nSMase1-GFP chemotaxing towards fMLF, we observed a clear NE distribution along with a strong enrichment at the sites of NE buds (Extended data Fig. 4; Supplementary movie S4). Since ceramide-induced changes in membrane curvature are required for the initiation of vesicle budding29, we investigated the effect of nSMase inhibition on NE-budding and vesiculation. We found a reduction in the percent of cells showing LBR- and 5-LO-positive NE buds and cytosolic vesicles in GW4869-treated PMNs chemotaxing toward fMLF (Fig. 4E&F). However, most of the few remaining LBR-positive vesicles observed in the GW4869-treated cells were NE-associated (Fig. 4G). These findings suggest that while other components can initiate the formation of NE buds, nSMase activity is required for the release of the NE buds and the generation of cytosolic vesicles. Indeed, the membrane bending properties of cPLA230, which is upstream of nSMase, could contribute to the formation of NE-associated buds.
Figure 4. nSMase1 and ceramide are present within and are required for the generation of NE-derived 5-LO/LBR positive NE buds and cytosolic vesicles.
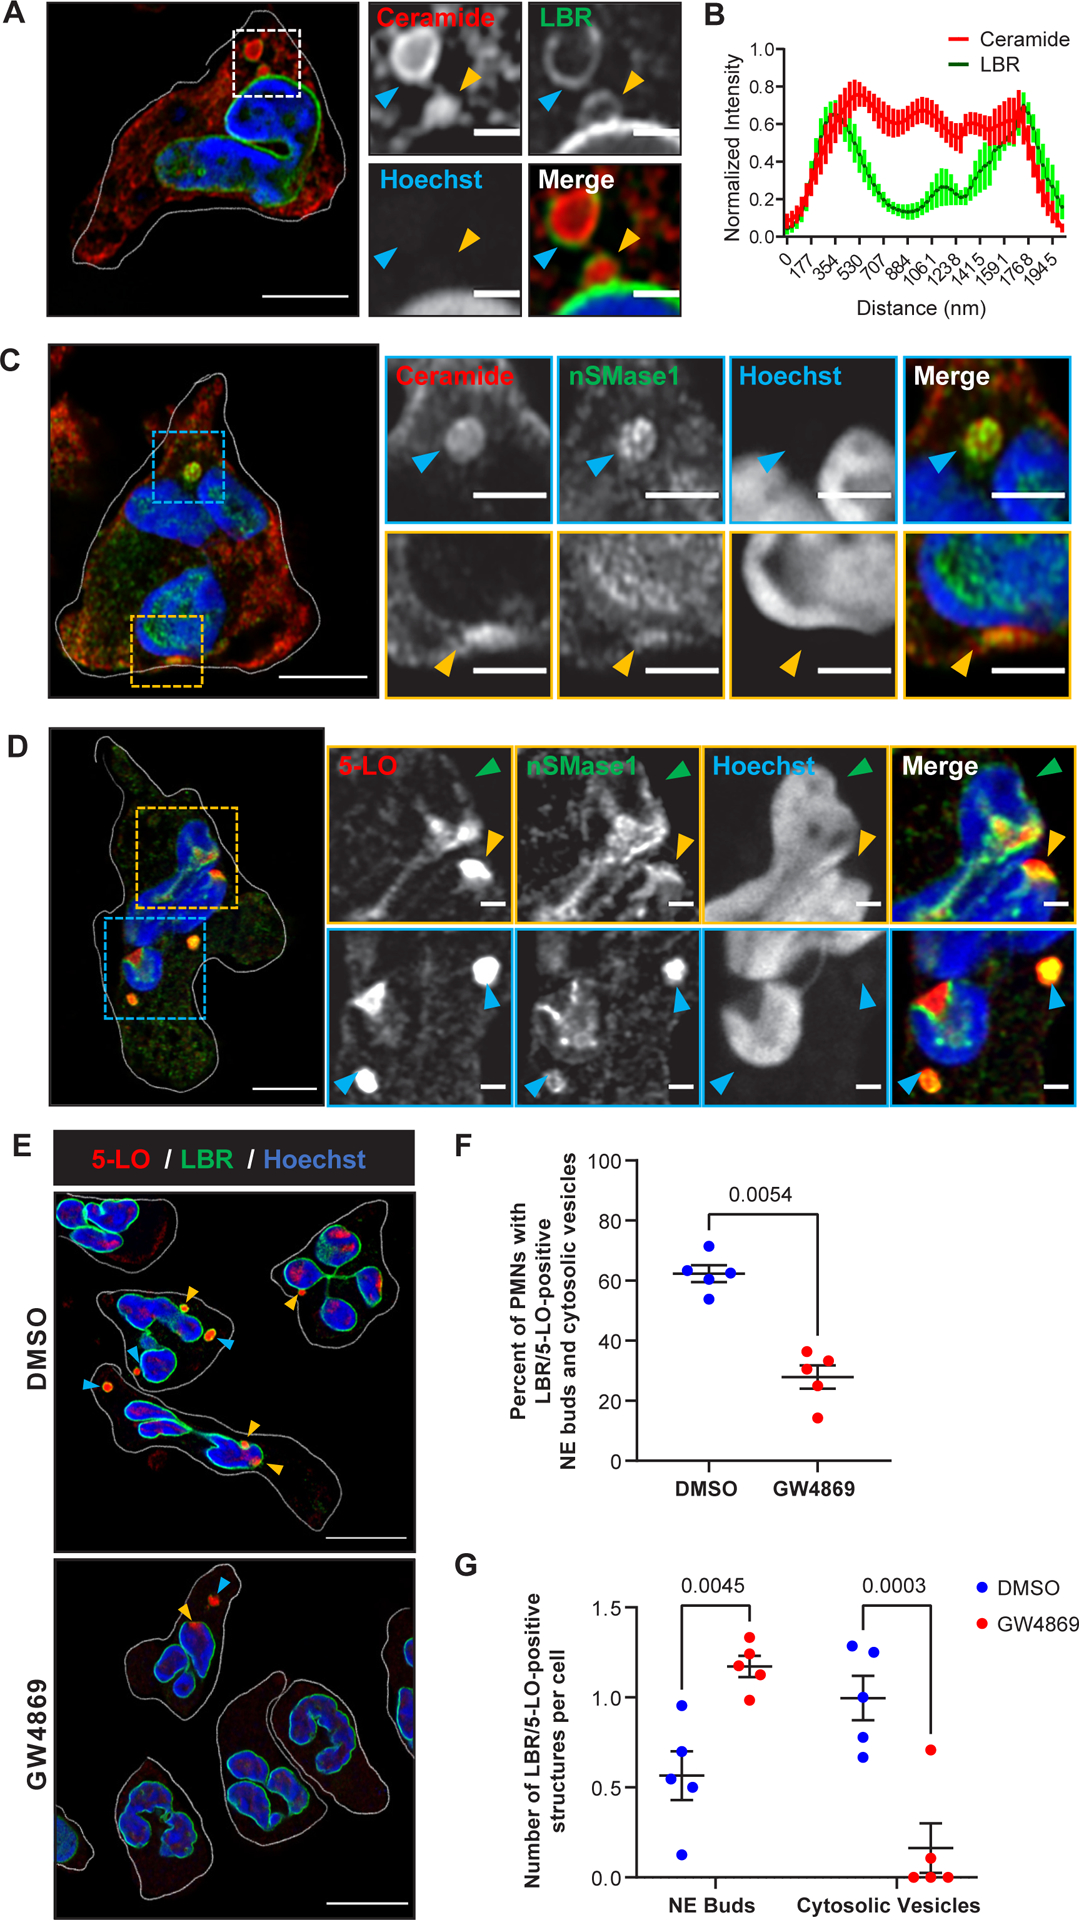
A Representative Airyscan microscopy image of fixed PMNs chemotaxing towards 100 nM fMLF and stained for LBR (green) and ceramide (red) (n=4). The yellow arrowheads point to nuclear buds and the blue arrowheads point to cytosolic vesicles. Scale bar is 5 μm. In the inset, it is 1 μm.
B Histogram showing the normalized intensity of LBR and ceramide across the maximum width of the LBR-positive vesicles. Data are represented as mean ± SEM of 10 NE buds or cytosolic vesicles from three independent experiments.
C Representative Airyscan microscopy images of fixed PMNs chemotaxing towards 100 nM fMLF and stained for nSMase1 (green) and ceramide (red) (n=3). The yellow arrowheads point to nuclear buds and the blue arrowheads point to cytosolic vesicles. Scale bar is 5 μm, in the inset it is 2 μm.
D Representative Airyscan microscopy images of fixed PMNs chemotaxing towards 100 nM fMLF stained for 5-LO (red) and nSMase1 (green) (n=3). The yellow arrowheads point to nuclear buds and the blue arrowheads point to cytosolic vesicles. Green arrowheads point to the 5-LO and nSMase1 on the NE. Scale bar is 5 μm. In the inset it is 1 μm.
E Field Airyscan microscopy images representative of 5 independent experiments of fixed PMNs chemotaxing towards 100 nM fMLF in the presence or the absence of 3 μM GW4869 stained for 5-LO (red) and LBR (green). Scale bar is 10 μm. The yellow arrowheads point to nuclear buds and the blue arrowheads point to cytosolic vesicles.
F Scatter plots showing the percentage of PMNs in DMSO- or GW4869-treated PMNs containing LBR/5-LO-positive NE buds and cytosolic vesicles among the total cells quantified within randomly selected imaging fields. A total of 158 cells in the DMSO sample and 108 cells in GW4869 samples from 5 independent experiments were analyzed and plotted (red dots) as mean ± SEM. P values were determined using a two-tailed paired t-test.
G Scatter plots showing the changes in the number of LBR/5-LO-positive buds and cytosolic vesicles per cell in PMNs treated with GW4869 compared to DMSO control. The data points from five independent experiments (red dots) are plotted as mean ± SEM, and P values determined using two-way RM ANOVA are reported. Source numerical data are available in the source data file.
To further characterize the nature of the 5-LO/FLAP/LBR-positive NE buds and cytosolic vesicles, we used expansion microscopy – a method developed to enable confocal microscopy to visualize sub-diffraction limited details by isotropic enlargement of the samples31,32. PMNs chemotaxing under agarose were fixed, stained, crosslinked, and expanded as described in the methods section, giving rise to an expansion of the sample by ~4x. We observed the clear presence of 5-LO-positive punctae within the LBR-positive cytosolic vesicles (Fig. 5A) and NE-associated buds (Fig. 5B) in chemotaxing cells. We also noted the presence of ceramide mainly at the periphery of the LBR-positive structures, although small ceramide punctae could also be seen inside the structures (Fig. 5A–B), as observed using traditional IF imaging (Fig. 4A–B). The median diameter of the LBR-positive NE buds and cytosolic vesicles was 972.5 nm (Fig. 5C), which closely matched the sizes measured using conventional confocal imaging (1000 ± 200 nm) (Extended data Fig. 1B), and the median diameter of the 5-LO positive punctae present within the LBR NE buds or cytosolic vesicles was 200 nm (Fig. 5D). We also observed a positive correlation between the size of the LBR-positive vesicles and the number of 5-LO-positive punctae within the LBR-positive vesicles (Fig. 5C). Notably, we did not observe the presence of the canonical exosome marker CD63 within the LBR-positive structures, although CD63-positive structures did contain ceramide punctae, indicative of ceramide enriched conventional ILVs33 (Fig. 5E&F, Extended data Fig. 5A&B). The CD63-positive MVBs had a smaller diameter that ranged between 350–420 nm (Extended data Fig. 5C), which matches the reported size range of CD63-positive MVBs34. Using traditional IF, we also found that the number and size of the CD-63-positive MVBs did not change in response to fMLF stimulation (Extended data Fig. 5D&E). We previously observed the colocalization of mCherry-5-LO with CD63-GFP in chemotaxing dHL-60 cells3. We envision that this was a consequence of 5-LO overexpression and/or to the potential multimerization from the mCherry fusion, targeting mCherry-5-LO to the CD63 positive MVBs. Together, these findings suggest that LBR-positive MVBs contain 5-LO-positive ILVs and are distinct from the canonical CD63-positive MVBs in both their composition and their size.
Figure 5. 5-LO-positive and CD63-negative punctae are present within LBR-positive vesicles.
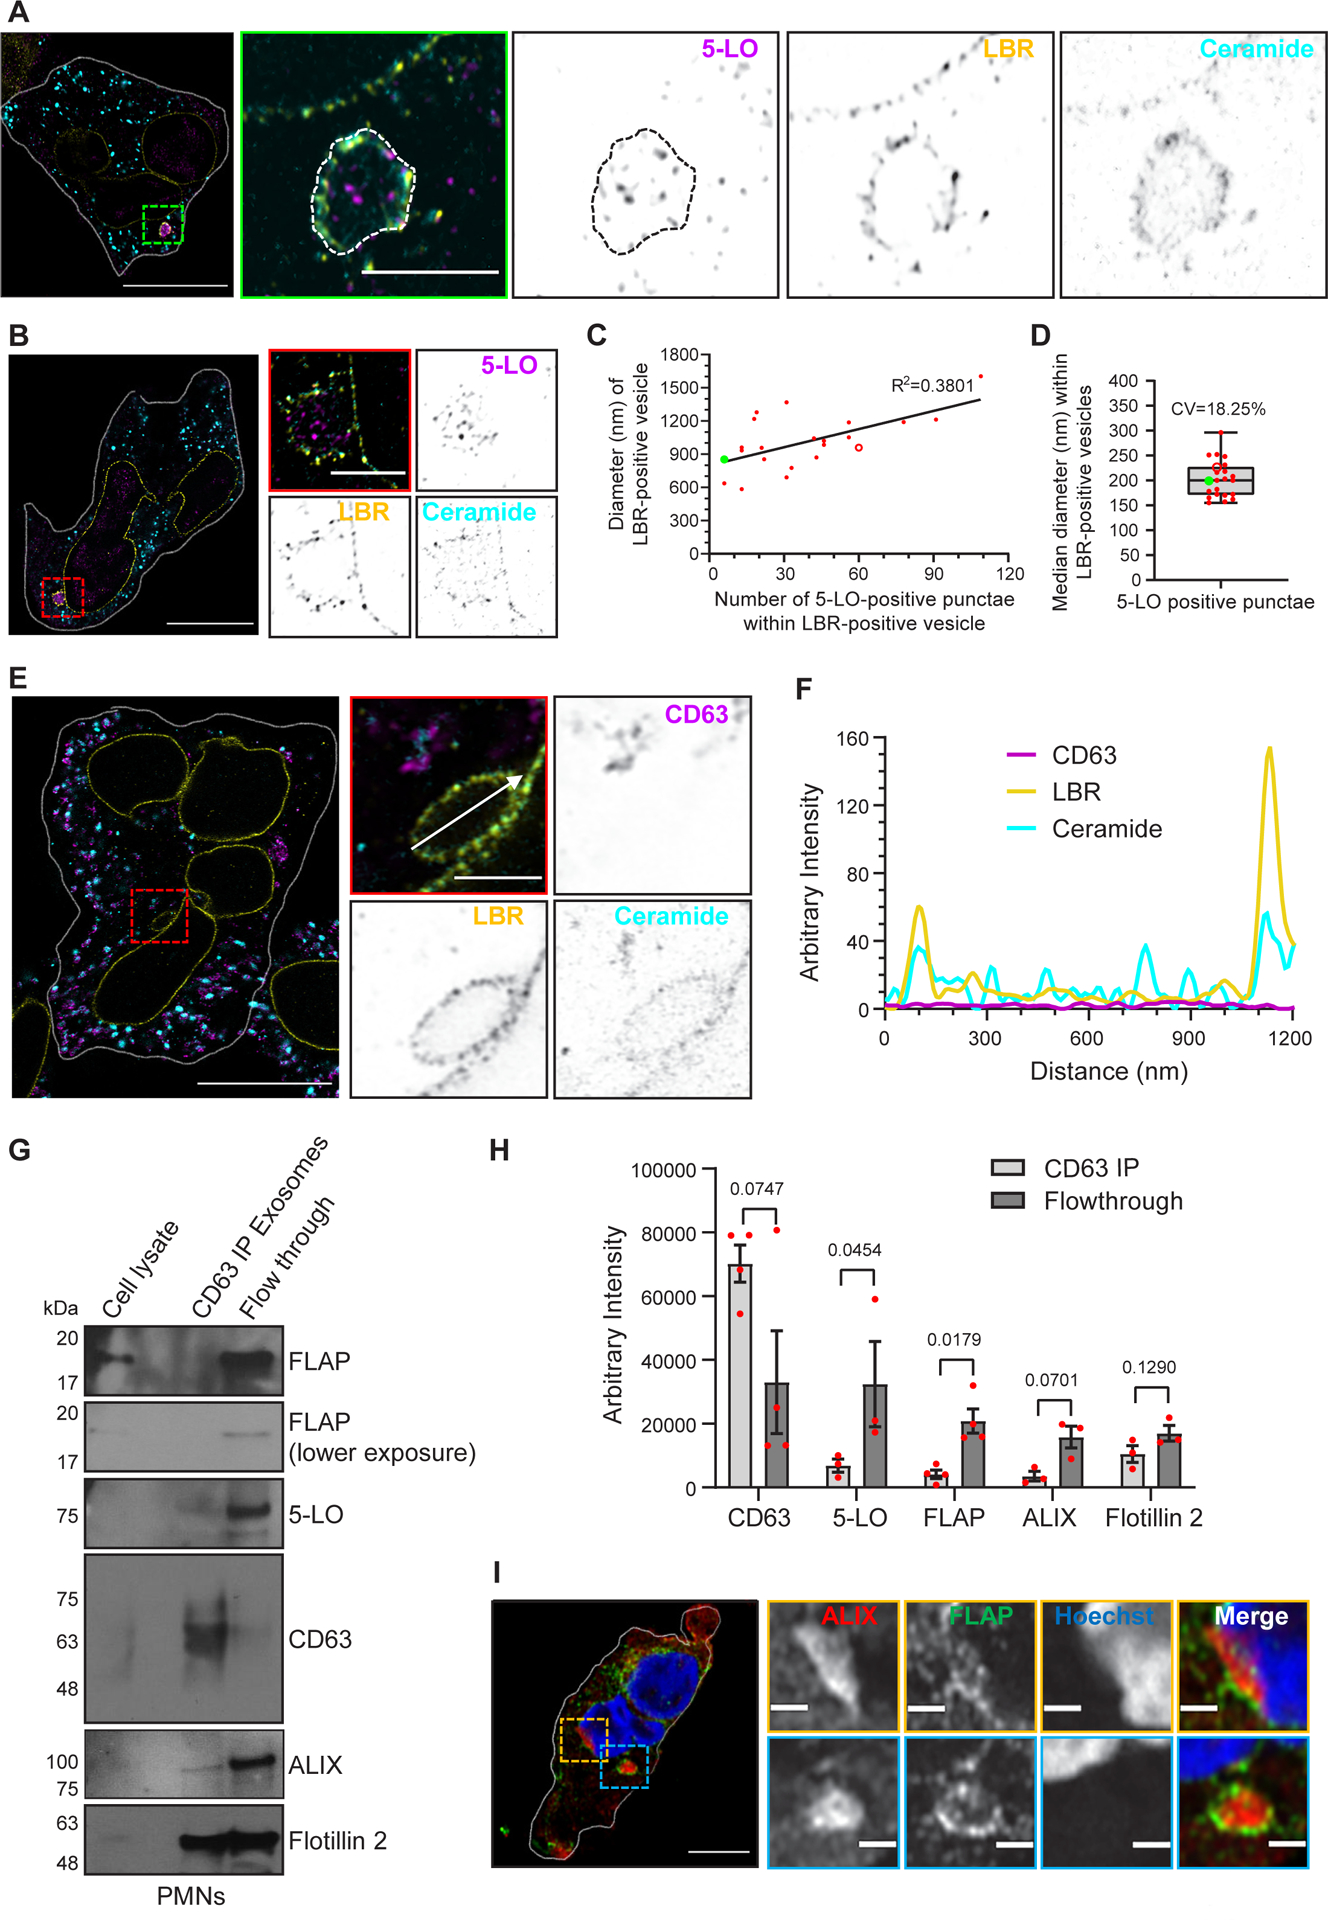
A-B Four-fold expansion images of fixed human PMNs chemotaxing towards 100 nM fMLF, acquired using Airyscan microscopy, stained for 5-LO (magenta), LBR (yellow), and ceramide (cyan) within cytosolic vesicles (A) and NE buds (B), are represented as inverted grayscale zoomed images (n=3). Scale bar is 5 μm. In the inset, the scale bar is 800 nm.
C Scatter plot showing the non-linear regression of the diameter of LBR positive vesicles versus the number of 5-LO positive punctae per LBR-positive vesicle.
D Box-whisker plot showing the distribution of the median diameter of 5-LO-positive punctae per LBR-positive vesicle. The whiskers indicate the range, and the boundary of the box closest to zero indicates 25th percentile, while the farthest one indicates 75th percentile. The line within the box represents the median and the red dots indicate datapoints obtained from 22 LBR-positive vesicles quantified from 10 cells (n=2). In panels C and D, the green dot and open red dot represent data points from panels A and B, respectively.
E Four-fold expansion microscopy image of fixed human PMNs chemotaxing towards 100 nM fMLF, acquired using Airyscan microscopy, stained with CD63 (magenta), LBR (yellow), and ceramide (cyan) within an NE-derived vesicle, represented as inverted grayscale zoomed images (n=3). Scale bar is 800 nm, and in the uncropped image it is 5 μm.
F Histogram showing the arbitrary intensity of LBR, ceramide, and CD63 across the white arrow along the LBR positive bud shown in zoomed and merged image in panel E.
G Representative western blot of exosomes obtained from fractions 4–9 of the density gradient centrifugation from PMNs stimulated with 100 nM fMLF and immunoprecipitated using an antibody against CD63 (n=3–4). CD63-positive and CD63-negative (unbound flowthrough) populations were immunoblotted for FLAP, 5-LO, CD63, ALIX, and Flotillin 2.
H Bar graph showing the quantifications of the band intensity of CD63, 5-LO, FLAP, ALIX, and Flotillin 2 in CD63-IP and flowthrough fractions. Four data points for FLAP and CD63, and three for 5-LO, ALIX, and Flotillin 2 are plotted as mean ± SEM where each red dot represents the value from one experiment. P values determined using a two-tailed ratio paired t-test are reported.
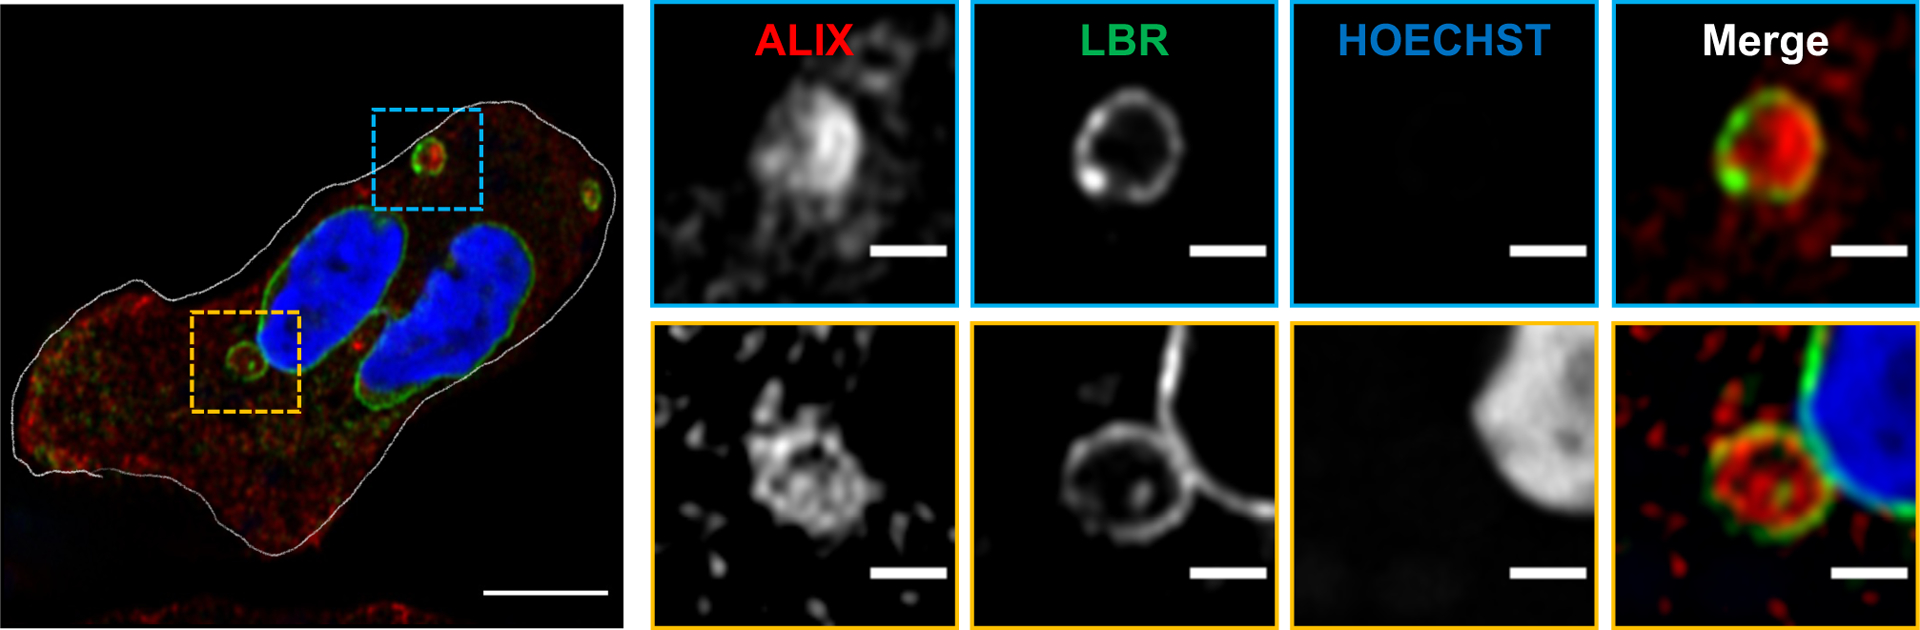
I Representative Airyscan microscopy images of fixed PMNs chemotaxing towards 100 nM fMLF and stained for FLAP (green) and ALIX (red) (n=3). Scale bar is 5 μm. In the inset, the scale bar is 1 μm. NE buds are shown in yellow boxes and cytosolic vesicles are shown in blue boxes. Source numerical data and unprocessed blots are available in the source data file.
As we previously reported using shRNA mediated nSMase1/SMPD2 knockdown HL-60 cells3, we found that fMLF-stimulated nSMase1 KO dHL-60 cells release fewer exosomes, compared to Scr dHL-60 cells. Using nanoparticle tracking analysis (NTA), we now found that Scr cells release two major populations of exosomes in response to fMLF stimulation (Extended data Fig. 6A&B). Interestingly, exosomes isolated from nSMase1 KO dHL-60 cells showed a significant decrease in the number of the larger, >180 nm, particles, which correlated with the size of the 5-LO punctae within the LBR-positive MVBs measured using expansion microscopy (Fig. 5D). We also observed a decrease in the levels of 5-LO and FLAP (Extended data Fig. 6C&D) and of LTB4 content (Extended data Fig. 6E) in exosomes isolated from the nSMase1 KO cells. Although exosomal Flotillin 2 levels did not change significantly in the nSMase1 KO cells, CD63 levels decreased (Extended data Fig. 6C&D), as we previously published3. A closer analysis of the fractions of the supernatants from fMLF-stimulated PMNs separated by density gradient ultracentrifugation revealed that the levels of the canonical exosome markers CD63, Flotillin 2, and TGS101 peaked in the higher density fraction 9 compared with FLAP and the ESCRT-associated protein ALIX9, which appeared more uniformly distributed throughout fractions 4–9 (Extended data Fig. 7A&B). We next used anti-CD63 antibody immunoprecipitation of the exosomes pooled from fractions 4–9 of fMLF activated PMNs to compare the composition of CD63-positive and flowthrough exosome populations. We found that while Flotillin 2 was present in both CD63-positive and flowthrough exosome preparations, CD63-positive exosomes showed decreased levels of FLAP, 5-LO, and ALIX with a concomitant enrichment in the flowthrough fraction (Fig. 5G&H). These results are supported by the exclusion of CD63 signal from LBR-positive NE buds and cytosolic vesicles (Fig. 5E&F) and the substantial recruitment of ALIX to LBR- or FLAP-positive NE buds and cytosolic vesicles in PMNs chemotaxing towards fMLF (Fig. 5I, Extended data Fig. 8). From these findings we conclude that the NE-derived and nSMase1-dependent 5-LO- and FLAP-positive exosomes are synthesized in a CD63 independent manner.
Neutrophil infiltration and exit into and from sites of infection/injury are crucial for potent inflammatory response and tissue homeostasis. Neutrophils are endowed with a highly malleable multilobed nucleus enriched with LBR and expressing high levels of Lamin B1 and relatively low levels of Lamin A/C15. This unique nuclear architecture has been implicated in neutrophil extravasation and squeezing through tight spaces during migration35. The LTB4 signaling pathway plays a key role during neutrophil chemotaxis in vitro3 and in vivo10 as well as during extravasation36,37. We now show that the biogenesis of exosomes containing the LTB4-synthesizing machinery originates at sites of NE budding during neutrophil chemotaxis. Our study identifies nSMase1 as critical for the generation of NE-derived buds and cytosolic vesicles and the subsequent release of FLAP/5-LO-containing exosomes. More importantly, we report that nSMase1 localization on the NE is required for ceramide production, which leads to the generation of lipid-ordered nuclear membrane microdomains and the recruitment of FLAP/5-LO at sites of NE buds. The induction of membrane curvature required for vesicle budding is generally mediated by (i) lipid composition, (ii) protein motif insertion, and/or (iii) clustering of membrane proteins of defined shapes16. Ceramide and its glucoside derivative GM1 are known to facilitate membrane budding by inducing negative and positive membrane curvature, respectively38,39. The enrichment of these lipids at sites of nuclear budding underscores their role in the initiation of FLAP/5-LO-containing NE buds. Moreover, the induction of positive membrane curvature mediated by the insertion of the C2-domain of cPLA2 and lysoPC, the byproduct of cPLA2 activity30, may facilitate the budding of the vesicle from the NE. Indeed, cPLA2 was recently proposed to act as a molecular sensor of nuclear membrane tension in migrating cancer cells and zebrafish40,41. Notably, the released AA through cPLA2 activation is a key factor in LTB4 biogenesis, where it was shown to not only induce FLAP trimerization42 and act as the substrate for 5-LO but also as an activator of nSMases and ceramide production43. We, therefore, propose that the clustering of FLAP, along with the incorporation of ceramide, induces membrane curvatures that are required for NE-derived bud formation. However, as we observe the presence of the INM protein LBR on 5-LO- and FLAP-positive cytosolic vesicles, the transformations needed to generate an MVB from the two NE membranes remain unknown. Interestingly, the emergence of MVBs from the NE has previously been reported in other cell types44,45, where MVBs appear to be enclosed in two membranes. Since ALIX facilitates the sorting of membrane-associated tetraspanin cargos to ILVs/exosomes46 and as FLAP is structurally similar to tetraspanin proteins42, the presence of ALIX within FLAP-positive NE buds and cytosolic vesicles in chemotaxing PMNs also suggests that ALIX is involved in the generation of FLAP/5-LO-positive ILVs. Furthermore, ALIX recruits the ESCRT III complex protein CHMP4B, which is known to induce membrane curvature during vesicle fission and ILV formation47. Finally, as we found that the absence of nSMase1 significantly downregulates the secretion of a larger (>180 nm) 5-LO-positive exosome population that originates within LBR-positive and CD63-negative MVBs, we propose that activated neutrophils release at least two structurally, biochemically, and functionally distinct exosomes populations: namely non-conventional NE-derived and conventional exosomes. Indeed, exosome heterogeneity based on size/density48, cargo type49, and the mechanism of ILV generation50, has recently been reported. We envision that the unique characteristics for the neutrophil nuclei provide a specialized environment for the release of nuclear material during chemotaxis.
METHODS
Ethics Statement
Human neutrophils were isolated from blood obtained from anonymous healthy human donors form the Platelet Pharmacology and Physiology Core at the University of Michigan. The blood was attained through an IRB-approved (IRB#HUM00107120) protocol specifically approved to provide de-identified blood for research purposes. We therefore did not have access to the HIPAA information. All subjects were consented and agreed to provide their blood for research purposes and were financially compensated.
Isolation of human peripheral blood neutrophils
Heparinized whole blood from anonymous healthy human donors that had not taken aspirin for 7 days and NSAIDS for 48 hours was obtained by venipuncture from the Platelet Pharmacology and Physiology Core at the University of Michigan. Neutrophils were isolated using the protocol described earlier51. Briefly, whole blood was incubated with an equal volume of 3% dextran (sigma D1037) in 0.9% NaCl for 30 min at 37°C to facilitate RBC sedimentation. Three volumes of plasma containing platelets monocytes, lymphocytes, and neutrophils were overlayed onto a volume of Histopaque-1077 (Sigma 10771) and centrifuged at 400Xg for 20 min at room temperature to separate peripheral blood mononuclear cells from neutrophils. Residual erythrocytes in the neutrophils pellet were removed using ACK lysing buffer (Thermo Fisher A1049201). The protocol yields >99% live neutrophils with >95% purity.
Cell lines and plasmid constructs
The human myeloid leukemia-derived pro-myelocytic cell line HL-60 was obtained from ATCC (CCL-240™) and maintained in RPMI-1640 media containing 10% HI-FBS, 20 mM HEPES pH 7.4, and penicillin-streptomycin antibiotic cocktail. HL-60 cells are also known as PLB-985 cells, which were originally reported in 1987 to arise from an acute myeloid leukemia patient different from the HL-60 cells52. However, in 2003, Drexler and colleagues determined that the PLB-985 cells are actually a sub-clone of HL-60 cells53. Our PLB-985 cells were authenticated using short tandem repeat analysis and showed to be a 93% match with HL-60 Promyelocytic Leukemia Human cells (ATCC #CCL-240; see Supplementary Table 1). We therefore now refer to them as HL-60 cells in this work and future work form our laboratory. To generate neutrophil-like cells HL-60 were differentiated in culture media containing 1.3% DMSO for 6 days with a change to fresh media every other day as described by Saunders et al54. HEK293T cells obtained from ATCC (CRL-3216™), cultured in DMEM containing 10% FBS were used to generate lentiviral particles for the generation of stable HL-60 cell lines. pVSVG, pCMV dR8.91, and pLentiCRISPR V2 vector expressing SCR/nSMase1 sgRNA or pCDH MSCV MCS EF1 neomycin vector expressing nSMase1 fused with eGFP at the C-terminal were transfected to HEK293T at the ratio of 1:2:4 using Lipofectamine 3000 transfection reagent. The lentiviral particles collected after 48- and 72-hours post-transfection were pooled, concentrated using PEG-it (Systems Biosciences LV810A-1), and added to the HL-60 cells with 8ug/ml polybrene. The clones expressing the construct were selected in 2 μg/ml puromycin and verified by western blotting and genetic sequencing. The SMPD2 sgRNA #1; GCCGACCGCATGAGGCGCCT, and sgRNA#; GAACCAGGAGAGCTTCGACC were cloned in pLentiCRISPR V2 plasmid, which was a kind gift from the Zhang lab. Full-length SMPD2 (NM_003080) was amplified from the cDNA pool generated using oligo dT primer based SuperScript™ IV First-Strand Synthesis System (Thermo Fischer 18091050) kit, using RNA extracted from dHL60 cells. Gene-specific primers: 5’ GGAATTCGCCACCATGAAGCCCAACTTCTC 3’ and 5’ CCGCTCGAGTTGTTCTTTAGTTCTGTCC 3’, were used to amplify SMPD2 with 5’ EcoRI and 3’ XhoI RE sites. The fragment was cloned in pCDH MSCV MCV EF1 Neomycin vector upstream to 5’ XhoI-EGFP using T4 DNA ligase.
Isolation of intact nuclei for microscopy and the purification of nuclear membrane microdomains
The protocol is based on and modified from the DRM isolation protocols by Persaud-Sawin et al.55 and Cascianelli et al.56, as is shown in Extended data Figure 3. dHL-60 or PMNs were resuspended in 1X mHBSS (150 mM NaCl, 4 mM KCl, 1.2 mM MgCl2, 10 mg/ml Glucose, 20 mM HEPES pH 7.4) at a density of 10e6/ml. The cells were treated with either DMSO or 100 nM fMLF (Sigma Aldrich F3506) in the presence or absence of 3 μM GW4869 (Sigma Aldrich D1692) for 5 min at 37°C with 10 RPM rotation. The cells were further incubated with an equal volume of 20 mM dimethyl pimelimidate (DMP) crosslinker (TCI chemicals D4476) in 1X mHBSS for 15 min at 37°C, washed in 20 mM Tris-Cl (pH 8.0) at 500Xg for 5 min at 4°C, and partially lysed twice with 15X trituration in ice-cold hypotonic lysis buffer (10 mM HEPES pH 7.5, 4 mM MgCl2, 25 mM NaCl, 1 mM DTT, and 0.1% NP-40) at a density of 50e6/ml. After centrifugation at 16,000Xg at 4°C for 10 sec, supernatants were saved as vesicle containing cytosol fractions. To remove ER fragments (microsomes), Golgi, and mitochondria, the nuclear pellet was washed with ice-cold Barnes solution (85 mM KCl, 85 mM NaCl, 2.5 mM MgCl2, 5 mM trichloroacetic acid pH 7.4)57. For immunostaining, the purified nuclei were resuspended in ice-cold isotonic resuspension buffer (10 mM HEPES pH 7.4, 4 mM MgCl2, 150 mM NaCl, 1 mM DTT, 250 mM Sucrose) at a density of 1e6/ml for microscopy, added to the poly-L-lysine coated glass coverslip, spun at 500Xg for 5 min at 4°C and fixed with 4% paraformaldehyde in isotonic resuspension buffer for 15 min at room temperature. For the isolation of lipid microdomains, nuclei were further lysed in 650 μl ice-cold TNE buffer (50 mM tris-Cl pH 7.4, 150 mM NaCl, 5 mM EGTA) containing 4 mM MgCl2 and 1% Triton X-100. The suspension was passed through a 23 G needle 30X and incubated on ice for 30 min. The NE supernatant was collected at 110Xg for 10 min at 4°C and adjusted to 40% iodixanol concentration using 60% Optiprep solution (Sigma D1556) and overlayed with 7 ml of 30% iodixanol, 2 ml of 20% iodixanol, and 1 ml of 5% iodixanol solution in TNE buffer, in a 13 ml ultracentrifuge tube. Sixteen fractions of 750 μl each from the top (F1) were collected after centrifugation at 150,000Xg for 16 hours at 4°C. One-fifth of the volume of the individual fraction was used to extract lipids by the methanol-chloroform based lipid extraction58. Briefly, 150 μl sample was thoroughly mixed with 450 μl of chloroform: methanol (2:1) for 15 min at room temperature followed by the addition of 100 μl distilled water, vortexed and centrifuged at 1,000Xg for 15 min at room temperature, which yield lipids in the bottom organic layer, which were dried under nitrogen gas in fume hood, and resuspended in 20 μl chloroform: methanol (2:1). The rest of the fraction volume was used to concentrate protein by the TCA-acetone method, and proteins were resuspended in 75 μl of 1X Laemmli sample buffer and boiled at 95°C for 10 min before loading on 4–12% Bis-Tris gel for electrophoresis. The electrophoresed proteins were transferred to 0.2-micron PVDF membrane, blocked using 1X Fish gelatin (Fischer Scientific NC0382999) in TBS containing 0.1% Tween-20 and probed for specific proteins using antibody against FLAP (1 μg/ml, Abcam 85227), 5-LO (1:1000, Abcam 169755), Flotillin 2 (1:1000, CST 3436), nSMase1 (1:500, CST 3867), and Lamin B1 (1:1000, Abcam 133741). The lipids (5 μl) were spotted on the nitrocellulose membrane, blocked with 1X fish gelatin in DPBS and dot blots were probed with 1 μg/ml CF®568-conjugated cholera toxin (Biotium 00071) in DPBS for GM1 and with mouse anti-ceramide antibody (1:500, Sigma C8104-50TST) followed by the Rhodamine Red™-X-conjugated goat anti-mouse IgM μ-chain specific secondary antibody (1:500, Jackson Immuno research 115-297-020) to detect ceramide.
Underagarose chemotaxis assay, live imaging, and immunofluorescence microscopy
The chemotaxis assay was performed as described by Saunders et al54. Cell culture dishes were coated with 1% BSA in DPBS at 37°C for 1 hr. 0.5% agarose in DPBS: HBSS (1:1) was poured and allowed to solidify for 45 min. Three 1 mm diameter wells were carved 2 mm from each other. fMLF (100 nM) in HBSS was placed in the middle well creating a gradient of 50 pM/μm as described by Afonso and colleagues5. A total of 50,000 cells in 5 μl mHBSS were plated in the outer wells and incubated at 37°C. The chemotaxing cells were imaged under a 63X oil objective in a temperature-controlled chamber set at 37°C. Images of nSMase1-GFP expressing HL-60 cells were acquired at 10-sec intervals, using Airy disk imaging array “Airyscan” to rapidly achieve resolution beyond the diffraction limit (140 nm at 488 nm). The acquired images were reconstructed using the Airyscan processing tool using the Zen imaging software and were converted to a movie using Fiji. For immunostaining, the PMNs were allowed to chemotax for 1 hr and fixed with 4% PFA in HBSS for 20 min at 37°C. The agarose was removed and PMNs were blocked for 1 hour at room temperature followed by staining in blocking buffer (0.2% saponin, 2% goat serum in 1X mHBSS) at 4°C overnight with antibodies against FLAP (1μg/ml, Abcam 85227), 5-LO (1:500, BD biosciences 610694), nSMase1 (1:100, Abcam 131330), and Lamin B1 (1:100, Proteintech 66095-1), LBR (1:400, Abcam 32535), LTA4H (1:100, Santacruz biotechnology sc23070), Ceramide (1:50, Sigma C8104-50TST), CD63 (1:800, BD biosciences 556019), and ALIX (1:200, Abcam 117600). The PMNs were washed with HBSS 3X for 5 min each and incubated with Alexa fluor-conjugated secondary antibody (1:500, Invitrogen A11008, A11031) along with 1 μg/ml of Hoechst 33342, for 1 hr at room temperature. The washed PMNs were mounted with Immumount™ (Fischer Scientific FIS9990402), z-stacks were acquired at an interval of 160 nm, using 63x objective in Zeiss LSM 880 confocal microscope fitted with Airyscan, and the acquired images were reconstructed using Airyscan processing in Zen 3.4 Blue edition software. The immunostaining of isolated fixed nuclei was performed in non-permeabilizing conditions (2% goat serum in DPBS).
di-4ANEPPDHQ fluorescence imaging
The image acquisition and anisotropy quantification were performed as described earlier by Owen et al19. Briefly, cells were incubated with HBSS containing 1 μM di-4ANEPPDHQ (ThermoFisher D36802) and Hoechst for 30 min at 37°C, washed, and added to the under agarose well as described above. Cells chemotaxing towards fMLF were imaged using a 63X oil immersion lens at 37°C. di-4NEPPDHQ fluorescence was excited using 488 nm argon laser, and the emission was collected at 500–580 nm (Lo) and 620–750 (Ld) nm range, respectively. Hoechst was excited using a 405 nm laser and the signal was captured using a simultaneous line scanning approach on a Zeiss 880 Airyscan microscope. Images were captured at 10-sec intervals and reconstructed by Airyscan processing. Generalized polarization (GP) images were created based on the methodology outlined by Owen et al19. To calculate the perinuclear GP shift, the brighter lipid ordered (Lo, green) channel was used to create a mask of the whole cell and the perinuclear mask with a width of 15 pixels was created using Hoechst image. The cell cytosol area was obtained by subtracting the perinuclear mask from the whole-cell mask. The GP value of every pixel in both the perinuclear area and the cytosol area was calculated using the formula below:
Where I500–580 and I620–750 are pixel intensities acquired in the Lo and Ld emission channels and G is the calibration factor manually adjusted to center the GP histogram of cytosol area around zero. GP distributions were obtained from the binned GP values and fitted into non-linear Gaussian using GraphPad Prism. Finally, after fitting the GP histograms of the cytosol area and perinuclear area, the GP shift = the median value of GP perinuclear histogram - the median value of GP cytosol histogram.
Exosome Isolation, immunoprecipitation, and LTB4 ELISA
Exosome isolation was performed following the guidelines described by Thery et al59. PMNs or Scr and nSMase1 KO HL-60 cells were stimulated with 100 nM fMLF in RPMI-1640 containing 10 U/ml DNaseI (Sigma Aldrich DN25) for 30 min at 37°C and the supernatants were collected at 500Xg at 4°C for 5 min. The microvesicles and apoptotic bodies were removed at 4000Xg for 20 min followed by filtration through a 0.45 μm polyethersulfone membrane filter. The extracellular vesicles (EVs) present in the filtered supernatant were concentrated with 8% PEG-6000 (Bio Basic PB0432) in 20 mM HEPES and 500 mM NaCl, at 4°C for 36 hrs, followed by centrifugation at 4000Xg at 4°C for 1 hr. The concentrated EVs, resuspended in 1 ml 250 mM sucrose and 20 mM Tris-Cl pH 7.4, were overlayed on the top of optiprep gradients and centrifuged at 100,000Xg for 16 hrs at 4°C. The optiprep gradients were prepared in 250 mM sucrose and 20 mM Tris-Cl, starting from the bottom as 3 ml of 40% optiprep, 3 ml of 20% optiprep, 3 ml of 10% optiprep, and 2 ml of 5% optiprep. The fractionated exosomes were collected as 12 fractions of 1 ml each from the top (lower to higher density).
For exosome immunoprecipitation, fractions 4–9 (Iodixanol density 1.083–1.142 g/ml) as described in Majumdar et al.3 were pooled, diluted in DPBS, centrifuged at 100,000Xg for 1 hr, resuspended in DPBS containing 1% 0.2 μm filtered BSA, and incubated with anti-CD63 antibody-conjugated magnetic beads (Thermo Scientific 10606D) overnight at 4°C with 10 RPM rotation. The CD63-specific bead-bound exosomes were separated using DynaMag™ magnets (Thermo Scientific 12321D) and washed once with DPBS containing 1% BSA. The supernatant containing unbound exosomes was collected and centrifuged at 100,000Xg for 1 hr. The unbound exosome pellet and the CD63 positive bead-bound exosomes were lysed in RIPA buffer for 15 min on ice, boiled in an equal volume of 2X reducing Laemmli buffer at 95°C for 5 min, loaded in 4–12% bistris gel, electrophoresed, and transferred to PVDF membrane for western blotting with anti-ALIX antibody (1:1000, Abcam 117600), anti-CD63 antibody (1:500, BD biosciences 556019), anti-Flotillin 2 antibody (1:1000, cell signaling technology 3436), anti-5-LO antibody (1:1000, Abcam 169755) and anti-FLAP antibody (1μg/ml, Abcam 85227), and detected using protein A-HRP (1:5000, Invitrogen 101023).
The LTB4 ELISA kit (Cayman Chemicals 520111) was used to assess the LTB4 levels within the exosomes. The isolated exosomes were homogenized in 100 μl ELISA buffer using a 3 mm diameter sonicator probe at an amplitude of 20% with 2 sec ON/OFF cycles for a total of 10 cycles on ice. To detect LTB4 concentrations within the linear range, 50 ul of concentrated homogenate was diluted 4X in ELISA buffer and LTB4 levels were quantified according to the manufacturer’s instructions. The values obtained were plotted using GraphPad prism.
Nano-tracking analysis
The data for NTA was captured using a Malvern Nanosight NS300 equipped with a 488 nm laser and a high sensitivity sCMOS camera and analyzed using the NTA 3.3 Dev Build 3.3.301 software. The exosomes purified using optiprep-density gradient centrifugation were resuspended in DPBS, vortexed, and diluted to 1:1000 in 0.22 μm filtered particle-free water to obtain a recommended concentration range of 1–10 × 108 particles/ml for reliable measurement. Using a syringe pump speed of 100/AU to inject exosome suspension in the flow channel, videos of the particle’s inflow were captured in script control mode, as 5 videos of 60 s each with 1 s delay and viscosity of water at 25°C. A total of 1,500 frames/sample at a capture rate of 25 frames/sec at constant camera level for each experimental set were captured.
Expansion microscopy
To maintain the structural integrity of PMNs, samples were processed with a few modifications from the protocols described earlier31,60. PMNs migrating under 3 ml of agarose over a 22×22 mm glass coverslip (#1.5, BSA coated) in a 35-mm dish were fixed with 1 ml of 4% PFA and 0.05% glutaraldehyde in PHEM buffer (60 mM PIPES, 25 mM HEPES, 10 mM EGTA and 2 mM MgCl2, pH 6.9) at 37°C for 20 min. After careful removal of the agarose, the fixed cells were immunostained in saponin-containing buffer, as described above. Post staining, the cells on the coverslips were washed thrice with 1X PBS and crosslinked with 3 mM Acryloyl-X, SE (Sigma Aldrich A20770) in 1X PBS, overnight at room temperature. To remove residual cross-linker, cells were washed thrice with 1X PBS for 15 min each at room temperature. The coverslips were incubated with an 80 μl drop of gelation solution comprising 8% sodium acrylate (Sigma Aldrich 408220), 10% Acrylamide (Sigma Aldrich 4058), 0.1% bisacrylamide (Sigma Aldrich M1533), 2M NaCl, and 1X PBS containing 1% heat-induced initiator VA-044 (Fischer scientific A3012), at 4°C for 10 min. The coverslip was assembled in the gelation chamber as illustrated by Truckenbrodt et al.60, 200 μl of gelation solution was added, and the gelation chamber was incubated in a humidified chamber at 37°C for a minimum of 2 hrs to allow polymerization. The gelation chamber was disassembled and the gel on the coverslip was washed quickly with 1X PBS to remove the unpolymerized gel. The gel was treated with 2 ml of the digestion buffer consisting of 50 mM Tris-Cl, 800 mM Guanidine hydrochloride, 1 mM EDTA, and 0.5% Triton-X 100 adjusted to pH 8.0, with 8 U/ml of proteinase K (NEB P8107S) added just before use, in a 35 mm dish, at 37°C for 1 hr. The gel containing the homogenized sample was washed thrice with 1X PBS (2 ml each) for 15 min each at room temperature. The gel was slid carefully into a 100 mm dish to allow for gel expansion, by sequentially changing the buffer to 10 ml of 1X>0.5X>0.02X>0.01X PBS for 20 min each at room temperature, followed by incubation in ddH2O overnight at 4°C. Gel size both before and after the expansion was measured using a ruler and was found to be approximately 4X lengthwise. Gel pieces containing the cells were excised to fit into a 12 mm glass-bottom 35 mm dish coated with poly-L-lysine (Sigma Aldrich P8920). The gel was gently pressed using a soft painting brush to ensure its adherence to the coverslip and avoid gel drift during imaging. 100μl ddH2O was slowly added to the empty spaces of the chamber to cover the gel and avoid the shrinking of the polymer. The sample was imaged using a Zeiss 880 confocal microscope fitted with an Airyscan detector, under a 63X (1.4NA) oil objective. Since Airyscanning provides 120 nm lateral and 350 nm axial resolution61, using 4X expansion of the sample has increased the resolution between 30–40 nm laterally and approximately 100 nm axially. The z-stacks acquired at an interval of 160 nm were ~50 nm apart, after expansion adjustment. All the scales shown in the images were after 4X adjustment, as verified by measuring the CD63 positive MVB size (~400 nm post adjustment). All the zoomed images representing buds/vesicles were deconvoluted using fast iterative algorithm and were used for presentation and data quantification.
Image quantification and data representation
Nuclei sphericity as presented in figure 3B, was quantified from z-stacks of Hoechst-stained nuclei. Briefly, the entire stack is converted to 8-bit and intensity thresholded (Otsu) with dark background for individual images. Volume, surface area, and sphericity were calculated using analyze>analyze 3D options of MorphLibJ plugin. To quantify the colocalization between ceramide and FLAP in the nuclei, 3D images were thresholded using maximum entropy parameters, and Pearson’s R-value and Mander colocalization coefficients (figure 3D) were determined using the JaCoP plugin in Fiji image analysis software. Intensity profiles of RGB channels (Figures 1D, 1F, 4B, 5F, and Extended data figure 5B) across the diameter of the vesicle of interest were determined using the RGB profiler plugin (https://imagej.net/plugins/rgb-profiler) from the Fiji image analysis tool. The resulting data was exported to GraphPad prism and plotted as histograms with mean ± SEM. The size of LBR-positive vesicles presented in figure 5C and Extended data figure 1B, was determined by manually drawing a line across the max diameter of the vesicle MFI projection image and quantifying the difference between the max intensity of LBR at the vesicle boundary. The size of CD63 vesicle presented in Extended data figure 5C was quantified as Feret diameter of the ROI around individual CD63-positive MVBs, as presented in the zoomed panel of Extended data figure 5A, using Analyze>Measure tool of Fiji image analysis software. The size of CD63 punctae as presented in Extended data figure 5E were quantified using Analyze regions 3D option of MorphLibJ plugin in Fiji software, from the CD63 images thresholded using Max entropy filter. The scale on the expansion microscopy images was adjusted 4X, and the size of LBR positive vesicles was determined by manually drawing an ROI and using the Measure option from the Fiji toolbar to determine the Feret diameter. The 5-LO channel was extracted, intensity thresholded using the Max entropy algorithm, and both the number and mean radii of 5-LO positive objects within the LBR-positive ROI were determined using Analyze>Analyze region 3D option in the MorphLibJ plugin of Fiji software. The data were exported to Microsoft Excel spreadsheet and plotted in Graphpad prism. The band intensities on the western blots were quantified using the Gels plugin from Analyze toolbar and were plotted in GraphPad prism. To quantify the integrated pixel density of the spots obtained from the dot blots, circular ROI of uniform size was manually created, and the intensity was quantified using Analyze>Measure tool in Fiji image analysis tool. The 3D reconstruction of the z-stack images as presented in Figure 3A and 3C, were performed by exporting the Spectrum LUT (FLAP intensity) and olive pseudo color (Hoechst) images for figure 3A, and unmodified images for Figure 3C directly to Arivis Vision 4D 3.5 platform. In the software the volumetric rendering of the 3D images were performed using maximum intensity enabling projection of data along view direction. Rendered volumes were tilted to an angle of 125° and rotated along the Y-axis at 25 frames per second containing a total of 125 frames, to create a stereoscopic view.
Statistics and reproducibility
All data presented are from at least three independent biological replicates. An appropriate test of significance has been used to determine the level of confidence and variability in the data and mentioned in the corresponding figure legends.
Extended Data
Extended Data Fig. 1. Characterization of LBR-positive NE buds and cytosolic vesicles.
A Representative Airyscan microscopy image of fixed PMNs uniformly stimulated with either DMSO or 20 nM fMLF showing the distribution of FLAP (green) and 5-LO (red) (n = 3). The yellow arrowheads point to nuclear buds. Scale bar is 5 μm, in the inset scale bar is 2 μm.
B Box-whisker plots showing the size distribution of LBR-positive NE buds and cytosolic vesicles in PMNs chemotaxing towards fMLF (n = 5), where each red dot represents the value from the individual bud (68) and cytosolic vesicle (99), plotted as box-whisker plot with whiskers indicating the range. The boundary of the box closest to zero indicates 25th percentile, while the farthest one indicates 75th percentile, where the line within the box represents median. The indicated P value was determined using the two-tailed Mann-Whitney test.
C Examples of fixed PMNs chemotaxing towards 100 nM fMLF and stained for LBR (green), Lamin B1 (red), and Hoechst (blue) acquired using Airyscan microscopy (n = 3). Scale bar is 5 μm, in the inset it is 1 μm. NE buds are shown in yellow boxes and cytosolic vesicles are shown in blue boxes. The yellow arrowheads point to nuclear buds and the blue arrowheads point to cytosolic vesicles. Source numerical data are available in the source data file.
Extended Data Fig. 2. nSMase1 regulates fMLF-induced perinuclear lipid order.
A Representative western blot image showing the levels of nSMase1 in Scr or nSMase1 CRISPR KO HL-60 cell lysates. GAPDH was used as a loading control (n = 2). * Denotes non-specific band detected by the nSMase1 antibody.
B Representative fluorescence microscopy images, showing the lipid-ordered (Lo) domains, lipid-disordered (Ld) domains, RGB images of Ld, Lo, and Hoechst merged, and GP images of either Scr or nSMase 1 KO dHL-60 cells chemotaxing towards 100 nM fMLF stained with di 4ANEPPDHQ (n = 3). Pseudo-colored GP images are based on the colormap, with white/red shades depicting lipid ordered regions and blue/darker shades representing lipid disordered regions. Scale bar is 5 μm.
C Histogram depicting the gaussian distribution of the GP pixel intensity obtained from the cytosol and perinuclear ROI (as depicted in Fig. 2b).
D Graph showing the median value of the perinuclear GP intensity distribution obtained from the GP images of Scr and nSMase1 KO dHL-60 cells. Data is quantified from 9 cells out of three independent experiments and is presented as box-whisker plot where whiskers indicate the range, and the boundary of the box closest to x-axis indicates 25th percentile, while the farthest one indicates 75th percentile and the line within the box represents the median. Each red dot represents the value from one cell. Indicated P value is determined using two-tailed Mann Whitney test. Source numerical data and unprocessed blots are available in the source data file.
Extended Data Fig. 3. Characterization of NE membranes from WT dHL-60 cells.
A Schematic illustration of the methodology used to isolate DRM and DSM fractions from the isolated NE.
B Representative western blot showing the efficiency of the fractionation protocol using resting WT dHL60 cells (n = 2). Scanned unprocessed blots are available in the source data file.
Extended Data Fig. 4. nSMase1-GFP is enriched at sites of nuclear budding.
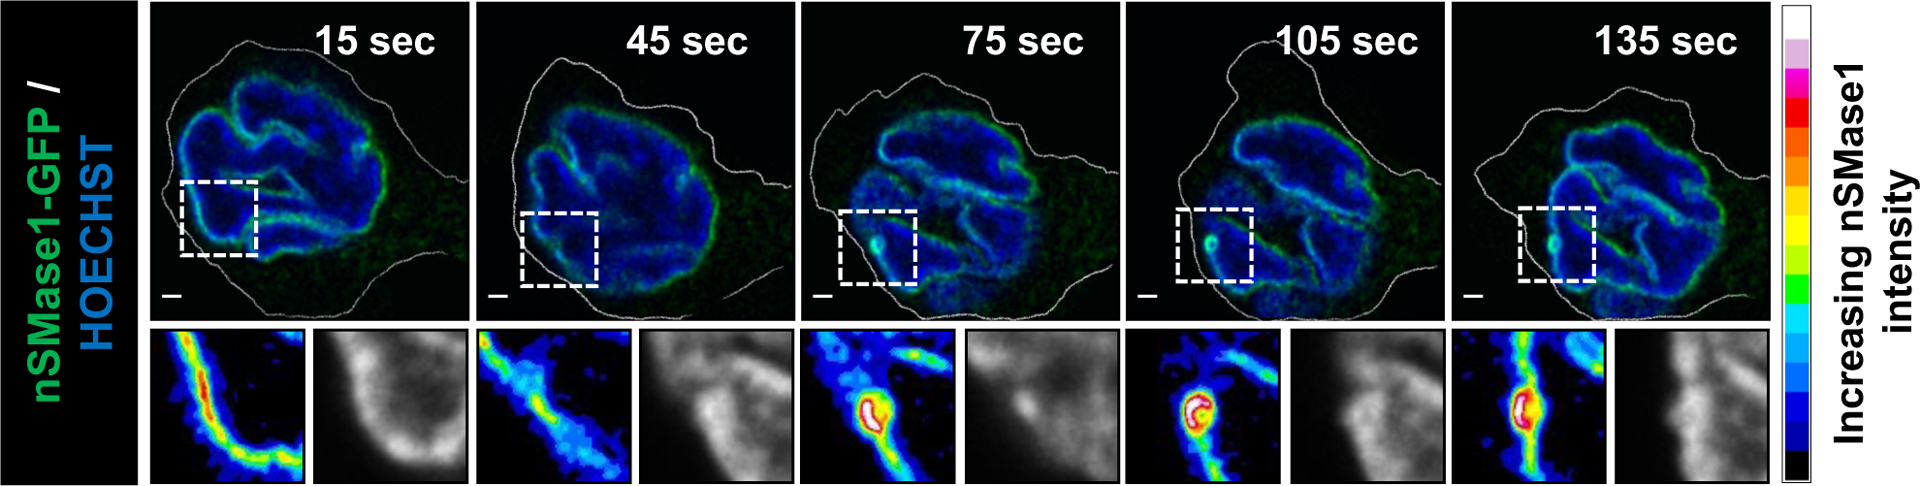
Representative time-lapse images of dHL-60 cells expressing nSMase1-GFP chemotaxing towards 100 nM fMLF. The zoomed section of the images shows the nSMase1-GFP signal as fluorescence intensity spectrum (scale on right) and Hoechst in grayscale. Scale bar is 2 μm, in the zoomed images it is 1 μm. N = 6 cells acquired from two independent experiments. Also, see Supplementary Movie 4.
Extended Data Fig. 5. Characterization of CD63 positive vesicles in activated neutrophils.
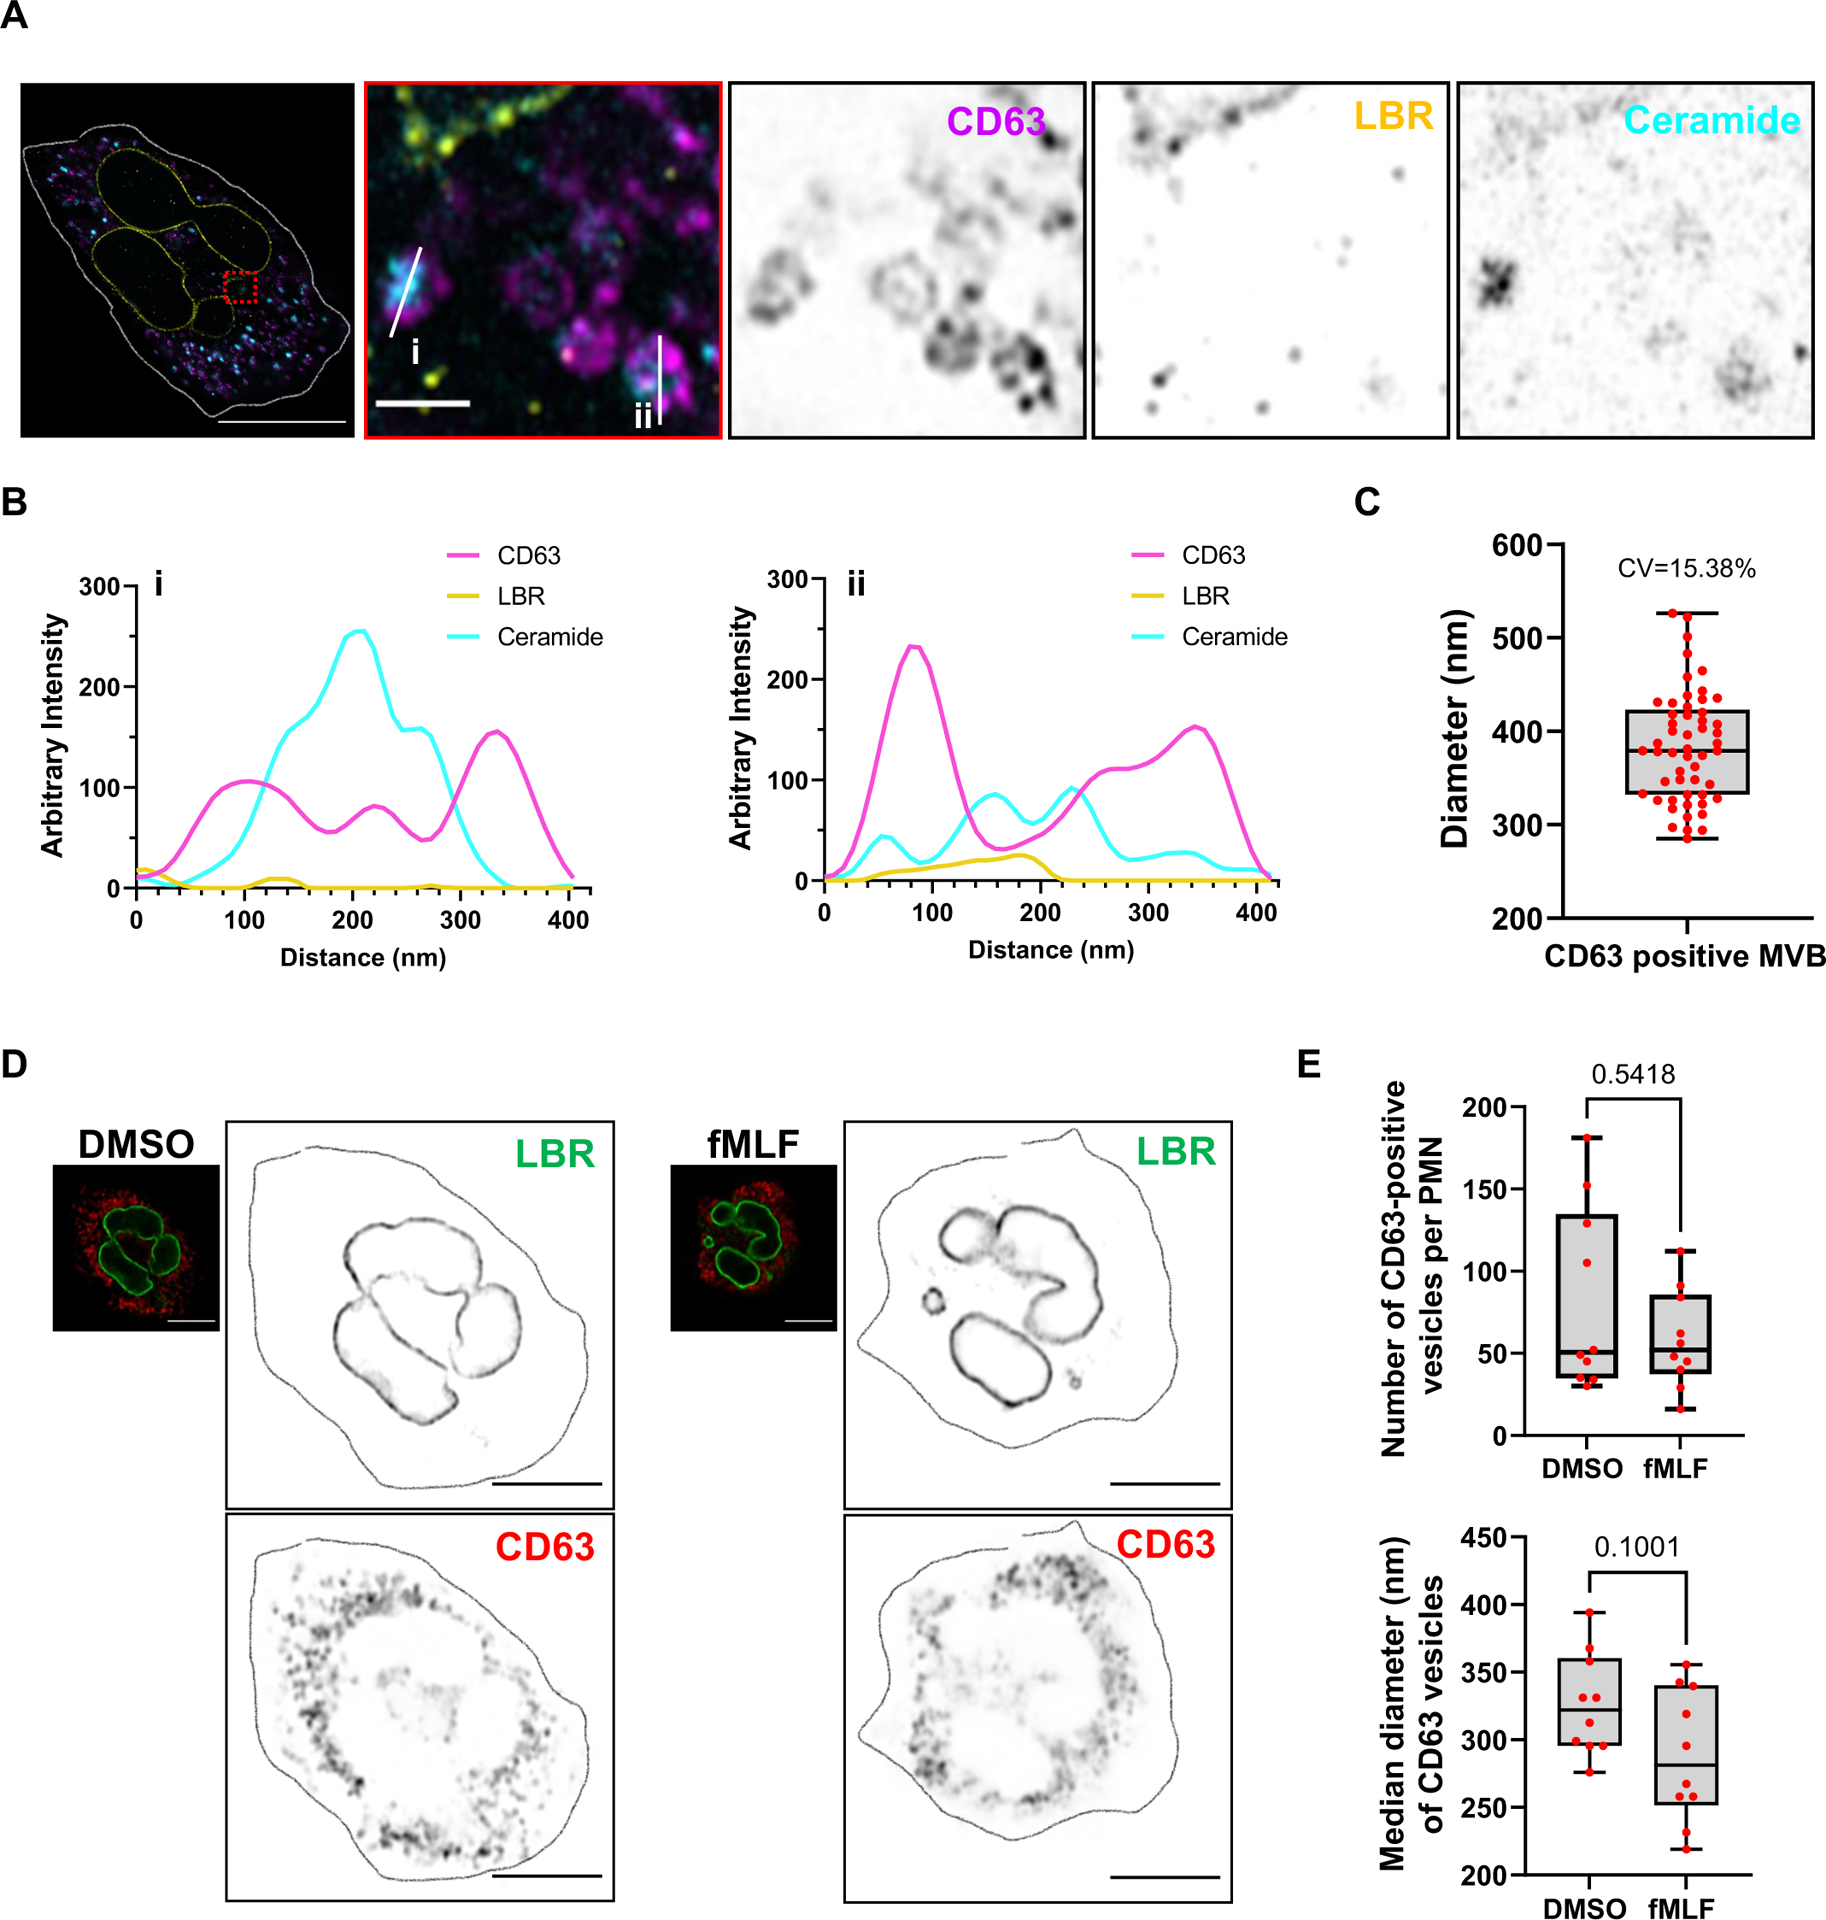
A Representative four-fold expansion microscopy image of fixed human PMNs chemotaxing towards 100 nM fMLF, captured using Airyscan microscopy, stained for CD63 (magenta), LBR (yellow) and ceramide (cyan) (n = 3). Scale bar 5 μm. In the inset, the scale bar is 400 nm.
B Line profiles showing the presence of 50–100 nm ceramide (cyan) positive punctae within the CD63 (magenta) positive MVBs from panel A.
C Graph showing the distribution of the median diameter of CD63-positive MVBs. Data are plotted as box-whisker plot where whiskers indicate the range, and the boundary of the box closest to 200 nm indicates 25th percentile, while the farthest one indicates 75th percentile and the line within the box represents the median. The red dots represent data of 52 CD63-positive MVBs (red dots) from 8 cells pooled from two independent experiments.
D Representative Airyscan microscopy images of fixed PMNs uniformly stimulated with 100 nM fMLF for 30 min and stained with LBR (green) and CD63 (red) (n = 3). Enlarged images are depicted in inverted grayscale. Scale bar is 5 μm.
E Box-whisker plots showing the number (top) and median diameter (bottom) of CD63-positive vesicles per cell, as shown in panel C, where whiskers indicate the range, and the boundary of the box closest to zero or 200 nm indicates 25th percentile, while the farthest one indicates 75th percentile and the line within the box represents the median. P value calculated using two-tailed Mann-Whitney test yield non-significant values (n = 3). Source numerical data are available in the source data file.
Extended Data Fig. 6. Characterization of exosomes isolated from activated Scr and nSMase1 KO dHL-60 cells.
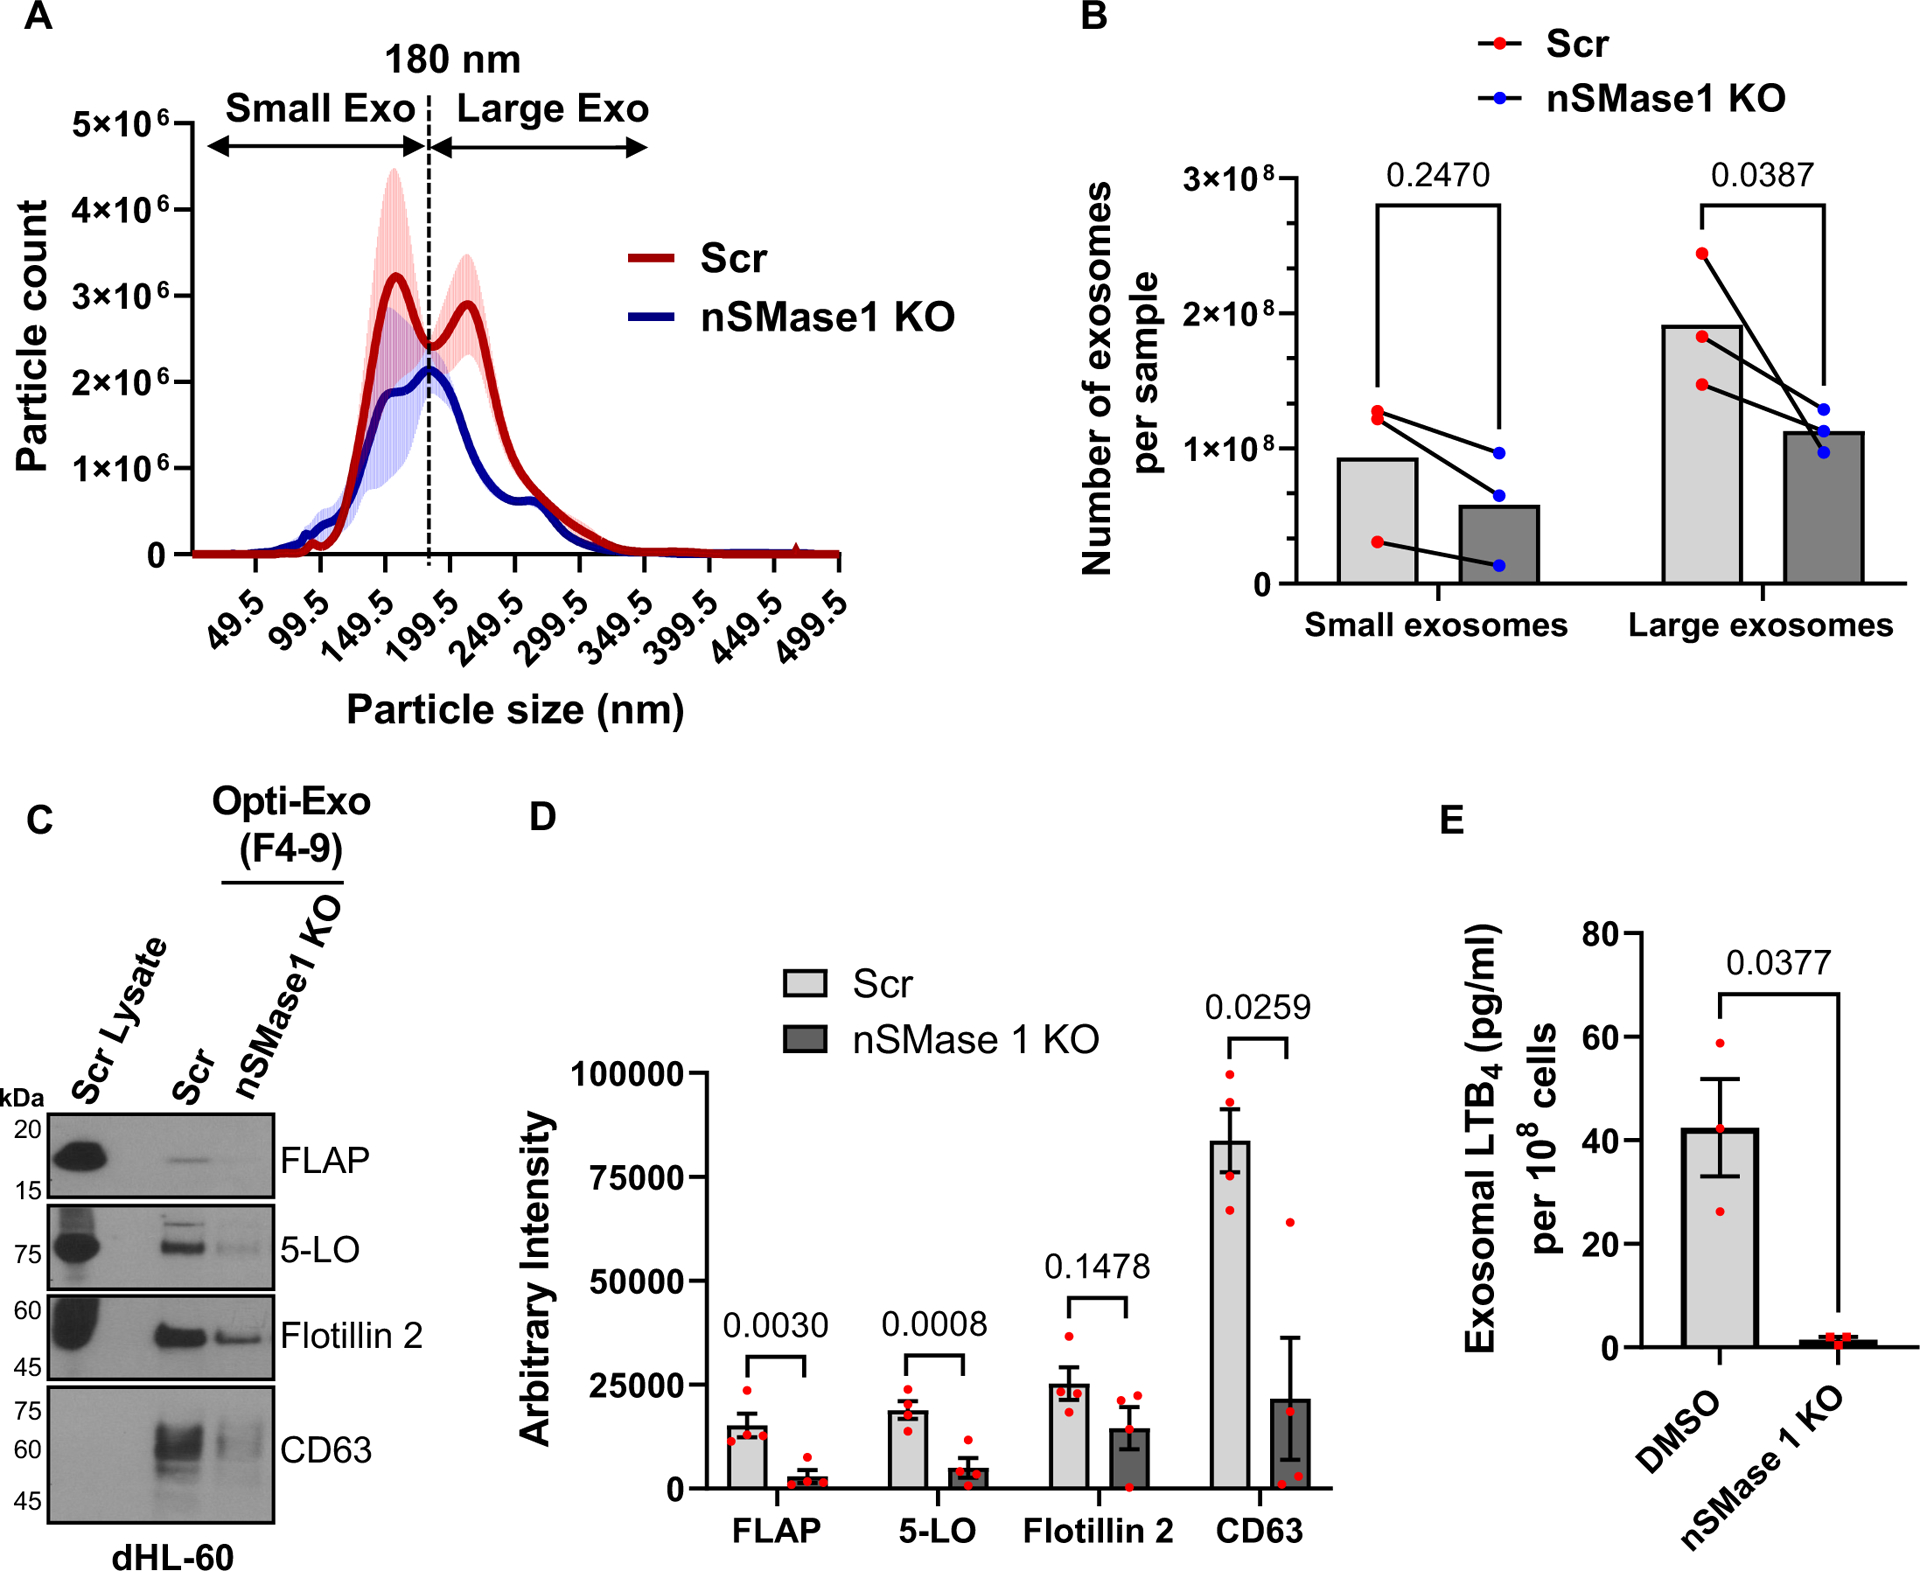
A Histogram showing the particle count and size of exosomes purified from either Scr or nSMase1 KO dHL60 cells stimulated with 100 nM fMLF for 15 min. Data were obtained from nanoparticle tracking analysis (NTA) of the isolated exosomes and is plotted from three independent experiments as mean ± SEM. The dotted line parallel to the y-axis, at 180 nm, indicate the segregation of two exosome populations, small (0–180 nm) and large (181–360 nm).
B Quantification of the area under the curve from the NTA data. Data from three independent experiments are presented as paired experiments. P-value was obtained using two-way RM ANOVA.
C Representative western blot images showing the levels of FLAP, 5-LO, Flotillin 2, and CD63 in pooled fractions 4–9 of density-gradient purified exosomes isolated from either Scr or nSMase1 KO dHL-60 cells stimulated with 100 nM fMLF for 15 min. Scr cell lysate represents the amount of protein from 1/100th the number of cells used for exosome isolation (n = 4).
D Bar graph showing the quantifications of the band intensity of FLAP, 5-LO, Flotillin 2, and CD63 in Scr and nSMase1 KO exosomes. Four data points are plotted as mean ± SEM where each red dot represents the value from one experiment. P values determined using two-tailed paired multiple t-test are reported.
E Bar graph showing exosomal LTB4 levels from the Scr or nSMase1 KO dHL60 cells stimulated with 100 nM fMLF for 15 min. Data from three independent experiments are plotted as mean ± SEM. P value was obtained using two-tailed ratio paired t-test. Source numerical data and unprocessed blots are available in the source data file.
Extended Data Fig. 7. Characterization of exosomes isolated form activated PMNs.
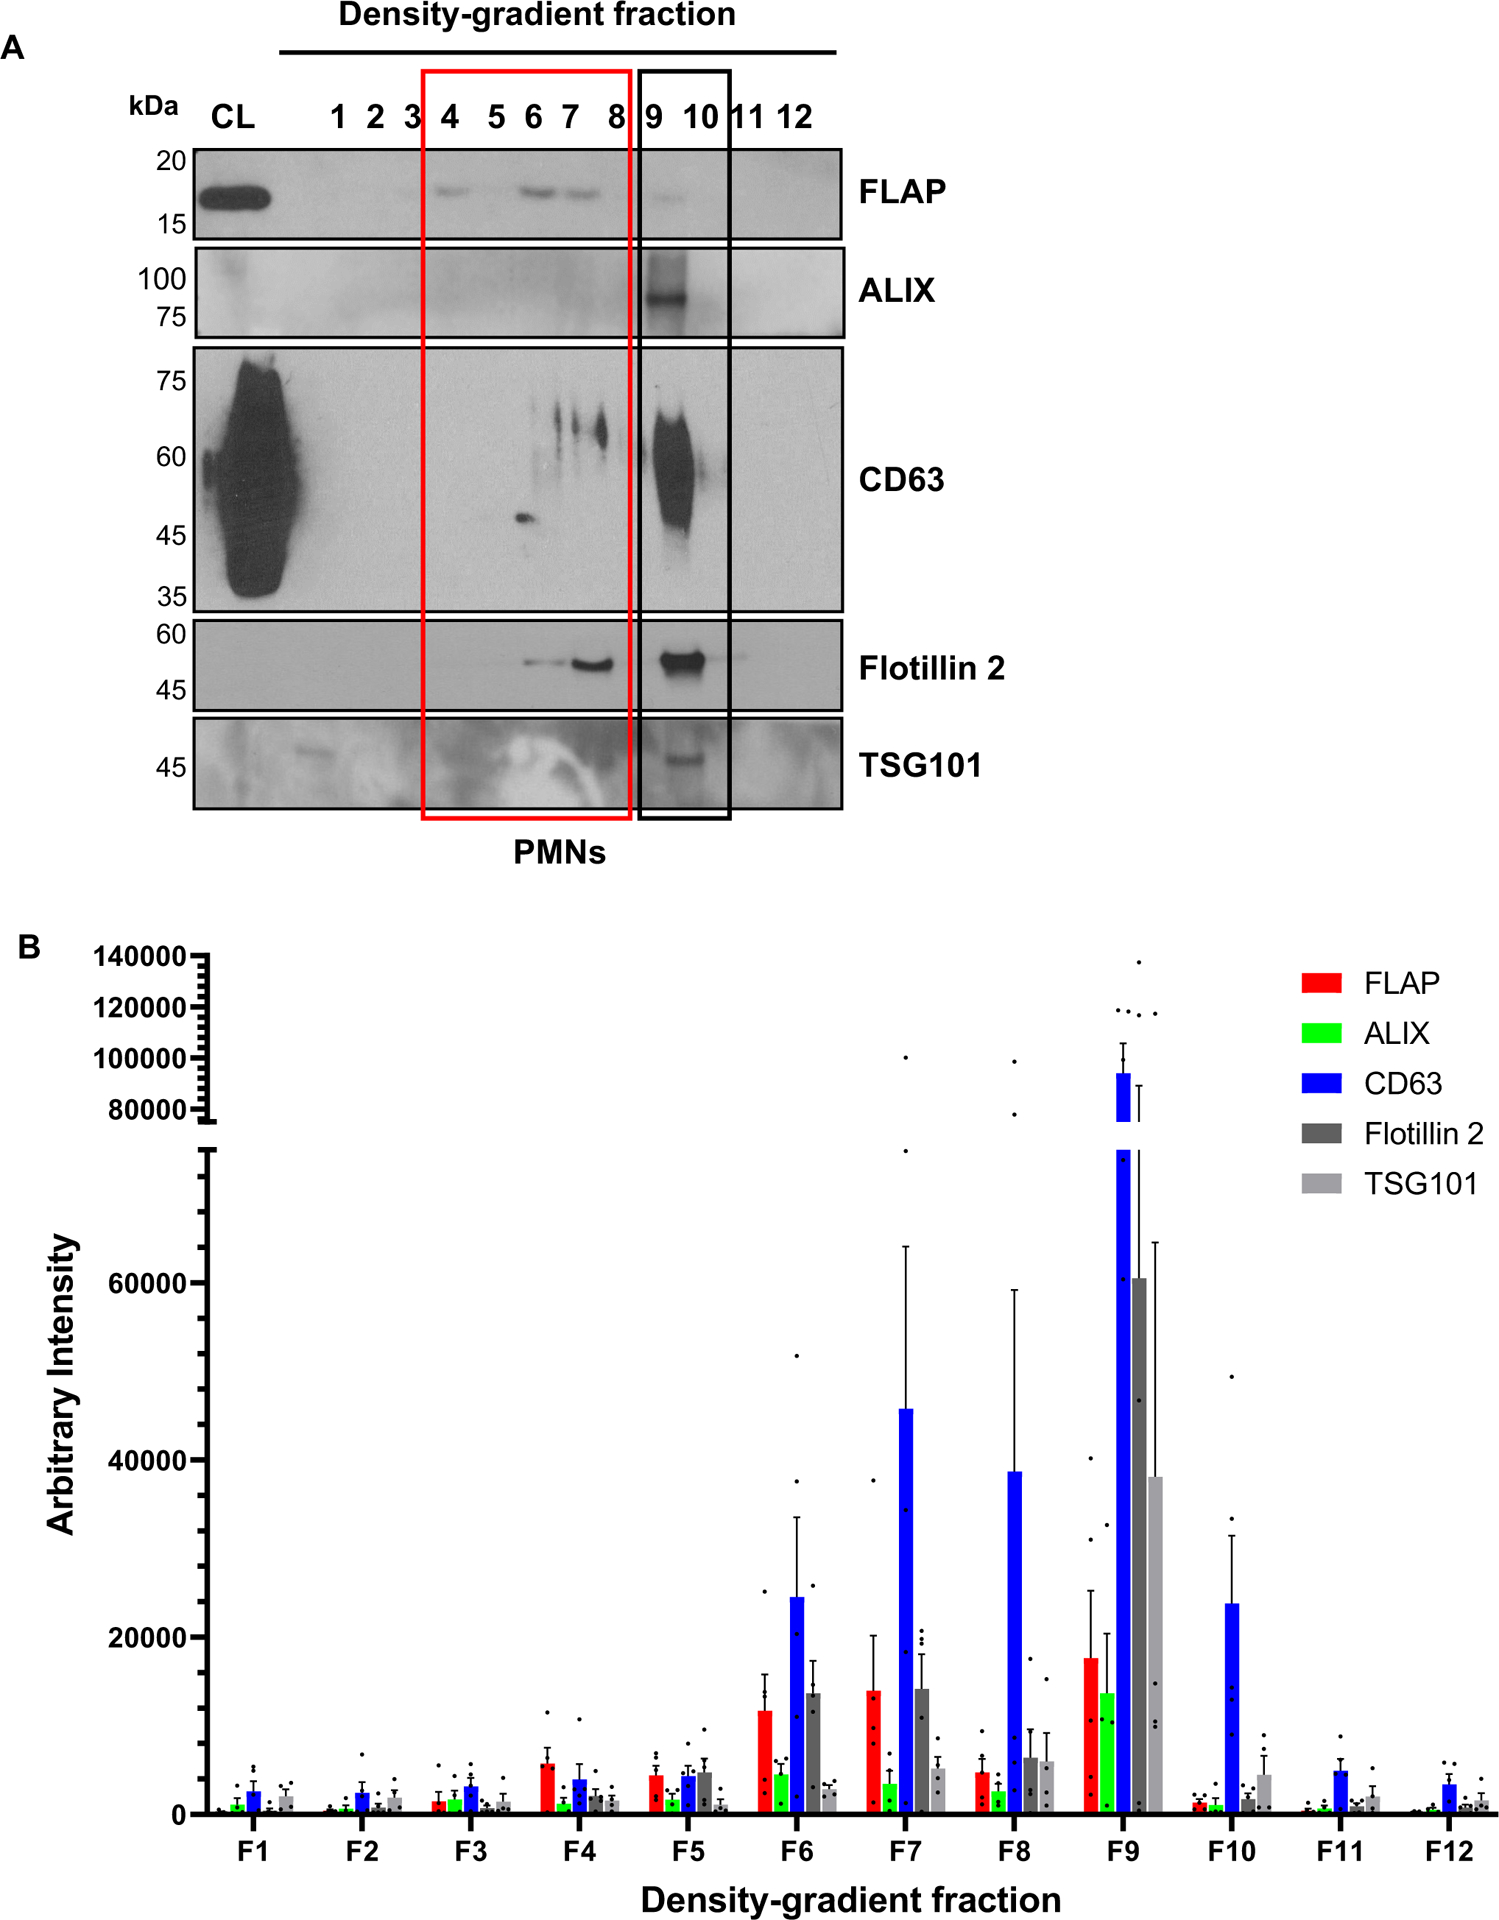
A Representative western blot showing the distribution of FLAP, CD63, Flotillin 2, TSG101, and ALIX in various fractions of density-gradient purified exosomes isolated from the supernatant of PMNs stimulated with 100 nM fMLF for 15 min (n = 4–5).
B Bar graph showing the arbitrary band intensity of the indicated proteins. Data are plotted as mean ± SEM of at least three independent experiments. Source numerical data and unprocessed blots are available in the source data file.
Extended Data Fig. 8. ALIX and LBR distribution in activated PMNs.
Representative Airyscan microscopy images of fixed PMNs chemotaxing towards 100 nM fMLF and stained for LBR (green) and ALIX (red) (n = 3). Scale bar is 5 μm. In the inset, the scale bar is 1 μm. NE buds are shown in yellow boxes and cytosolic vesicles are shown in blue boxes.
Supplementary Material
Stitched time-lapse images of di-4ANEPPDHQ stained PMNs chemotaxing towards 100 nM fMLF, showing Lo regions (green, left), Ld regions (red, center), and the corresponding GP image. Pseudo-colored GP images are based on the colormap, with white/red shades depicting lipid ordered regions and blue/darker shades representing lipid disordered regions. For colormap, see Figure 2A. Images were captured at 15-sec intervals and stitched together to create a movie at 20 frames per sec speed.
Time-lapse movie of dHL60 cells expressing nSMase1-eGFP (green) and stained with Hoechst (blue) chemotaxing towards 100 nM fMLF. Images were captured at 15-sec intervals and stitched together at frame rate of 2 frames per sec.
Stereoscopic rendering of olive-colored Hoechst-stained isolated nuclei, showing the intensity distribution of FLAP staining, as presented in Figure 3A.
Stereoscopic rendering of FLAP, ceramide, and Hoechst 33342 stained isolated nuclei, showing the differential localization of FLAP and ceramide, as presented in Figure 3C.
ACKNOWLEDGEMENTS
We thank the Platelet Pharmacology and Physiology Core at the University of Michigan for providing human blood from healthy volunteers. We are grateful to Drs. Dawen Cai and Ye Li (University of Michigan) for their assistance in the expansion microscopy experiments. We also acknowledge Drs. Ritankar Majumdar and Cosmo Saunders as well as Jeannie Yoojin Park for their intellectual contributions. Finally, many thanks to members of the Parent laboratory, and Drs. Phyllis Hanson (University of Michigan) and Pierre Coulombe (University of Michigan) for their valuable suggestions and help during the progress of this work. This work was supported by funding from the University of Michigan School of Medicine (CAP), by the Lucchesi Predoctoral Fellowship Award (SC), by an American Heart Association Predoctoral Award (FJ), and by R01 AI152517 (CAP).
Footnotes
COMPETING INTERESTS STATEMENT
Authors declare no competing interests
DATA AVAILABILITY
All the raw data and associated statistic calculations presented have been provided as “source data” for the respective figures. Owing to the large size of high-resolution z-stack microscopy images, the raw microscopy images are available from the corresponding author upon reasonable request.
REFERENCES
- 1.Subramanian BC, Majumdar R, & Parent CA The role of LTB4-BLT1 axis in chemotactic gradient sensing and directed leukocyte migration. Seminars in Immunology 33, 16–29 (2017). [DOI] [PMC free article] [PubMed] [Google Scholar]
- 2.He R, Chen Y & Cai Q The role of the LTB4-BLT1 axis in health and disease. Pharmacological Research 158, 104857–104868 (2020). [DOI] [PubMed] [Google Scholar]
- 3.Majumdar R, Tameh AT, Arya SB & Parent CA Exosomes mediate LTB4 release during neutrophil chemotaxis. PLoS Biology 19, 1–28 (2021). [DOI] [PMC free article] [PubMed] [Google Scholar]
- 4.Burn GL, Foti A, Marsman G, Patel DF & Zychlinsky A The Neutrophil. Immunity 54, 1377–1391 (2021). [DOI] [PubMed] [Google Scholar]
- 5.Afonso PV et al. LTB4 Is a Signal-Relay Molecule during Neutrophil Chemotaxis. Developmental Cell 22, 1079–1091 (2012). [DOI] [PMC free article] [PubMed] [Google Scholar]
- 6.Schievella AR, Regier MK, Smith WL & Lin LL Calcium-mediated translocation of cytosolic phospholipase A2 to the nuclear envelope and endoplasmic reticulum. Journal of Biological Chemistry 270, 30749–30754 (1995). [DOI] [PubMed] [Google Scholar]
- 7.Sadik CD & Luster AD Lipid-cytokine-chemokine cascades orchestrate leukocyte recruitment in inflammation. Journal of Leukocyte Biology 91, 207–215 (2012). [DOI] [PMC free article] [PubMed] [Google Scholar]
- 8.Esser J et al. Exosomes from human macrophages and dendritic cells contain enzymes for leukotriene biosynthesis and promote granulocyte migration. Journal of Allergy and Clinical Immunology 126, 1032–1040 (2010). [DOI] [PubMed] [Google Scholar]
- 9.van Niel G, D’Angelo G & Raposo G Shedding light on the cell biology of extracellular vesicles. Nature Reviews Molecular Cell Biology 19, 213–228 (2018). [DOI] [PubMed] [Google Scholar]
- 10.Lämmermann T, et al. Neutrophil swarms require LTB4 and integrins at sites of cell death in vivo. Nature 498, 371–375 (2013). [DOI] [PMC free article] [PubMed] [Google Scholar]
- 11.Marleau S et al. Role of 5-lipoxygenase products in the local accumulation of neutrophils in dermal inflammation in the rabbit. Journal of immunology 163, 3449–3458 (1999). [PubMed] [Google Scholar]
- 12.Oyoshi MK et al. Leukotriene B4-Driven Neutrophil Recruitment to the Skin Is Essential for Allergic Skin Inflammation. Immunity 37, 747–758 (2012). [DOI] [PMC free article] [PubMed] [Google Scholar]
- 13.Terradas M, Martín M, Tusell L & Genescà A DNA lesions sequestered in micronuclei induce a local defective-damage response. DNA Repair 8, 1225–1234 (2009). [DOI] [PubMed] [Google Scholar]
- 14.Terradas M, Martín M, Hernández L, Tusell L & Genescà A Nuclear envelope defects impede a proper response to micronuclear DNA lesions. Mutation Research - Fundamental and Molecular Mechanisms of Mutagenesis 729, 35–40 (2012). [DOI] [PubMed] [Google Scholar]
- 15.Manley HR, Keightley MC & Lieschke GJ The Neutrophil Nucleus: An Important Influence on Neutrophil Migration and Function. Front Immunol 9, 2867 (2018). [DOI] [PMC free article] [PubMed] [Google Scholar]
- 16.McMahon HT & Boucrot E Membrane curvature at a glance. Journal of Cell Science 128, 1065–1070 (2015). [DOI] [PMC free article] [PubMed] [Google Scholar]
- 17.Eich C et al. Changes in membrane sphingolipid composition modulate dynamics and adhesion of integrin nanoclusters. Scientific Reports 6, 1–15 (2016). [DOI] [PMC free article] [PubMed] [Google Scholar]
- 18.Kabbani AM, Raghunathan K, Lencer WI, Kenworthy AK & Kelly CV Structured clustering of the glycosphingolipid GM1 is required for membrane curvature induced by cholera toxin. Proc Natl Acad Sci U S A 117, 14978–14986 (2020). [DOI] [PMC free article] [PubMed] [Google Scholar]
- 19.Owen DM, Rentero C, Magenau A, Abu-Siniyeh A & Gaus K Quantitative imaging of membrane lipid order in cells and organisms. Nature Protocols 7, 24–35 (2012). [DOI] [PubMed] [Google Scholar]
- 20.Lucki NC & Sewer MB Nuclear sphingolipid metabolism. Annual Review of Physiology 74, 131–151 (2012). [DOI] [PMC free article] [PubMed] [Google Scholar]
- 21.Hannun MVA and Y. A. Sphingolipid metabolism and neutral sphingomyelinases. Handb Exp Pharmacol 215, 57–76 (2013). [DOI] [PMC free article] [PubMed] [Google Scholar]
- 22.Mizutani Y et al. Nuclear localization of neutral sphingomyelinase 1: Biochemical and immunocytochemical analyses. Journal of Cell Science 114, 3727–3736 (2001). [DOI] [PubMed] [Google Scholar]
- 23.Luberto C et al. Inhibition of tumor necrosis factor-induced cell death in MCF7 by a novel inhibitor of neutral sphingomyelinase. Journal of Biological Chemistry 277, 41128–41139 (2002). [DOI] [PubMed] [Google Scholar]
- 24.Guo BB, Bellingham SA & Hill AF The neutral sphingomyelinase pathway regulates packaging of the prion protein into exosomes. Journal of Biological Chemistry 290, 3455–3467 (2015). [DOI] [PMC free article] [PubMed] [Google Scholar]
- 25.Magee AI & Parmryd I Detergent-resistant membranes and the protein composition of lipid rafts. Genome Biology 4, 1–4 (2003). [DOI] [PMC free article] [PubMed] [Google Scholar]
- 26.Mandal AK et al. The nuclear membrane organization of leukotriene synthesis. Proc Natl Acad Sci U S A 105, 20434–20439 (2008). [DOI] [PMC free article] [PubMed] [Google Scholar]
- 27.Kolesnick R The therapeutic potential of modulating the ceramide/sphingomyelin pathway. Journal of Clinical Investigation 110, 3–8 (2002). [DOI] [PMC free article] [PubMed] [Google Scholar]
- 28.Schuck S, Honsho M, Ekroos K, Shevchenko A & Simons K Resistance of cell membranes to different detergents. Proc Natl Acad Sci U S A 100, 5795–5800 (2003). [DOI] [PMC free article] [PubMed] [Google Scholar]
- 29.Trajkovic K et al. Ceramide Triggers Budding of ExosomeVesicles into Multivesicular Endosomes. Science (1979) 319, 1244–1247 (2008). [DOI] [PubMed] [Google Scholar]
- 30.Ward KE, Ropa JP, Adu-Gyamfi E & Stahelin RV C2 domain membrane penetration by group IVA cytosolic phospholipase A 2 induces membrane curvature changes. Journal of Lipid Research 53, 2656–2666 (2012). [DOI] [PMC free article] [PubMed] [Google Scholar]
- 31.Gambarotto D et al. Imaging cellular ultrastructures using expansion microscopy (U-ExM). Nat Methods 16, 71–74 (2019). [DOI] [PMC free article] [PubMed] [Google Scholar]
- 32.Nijenhuis W et al. Optical nanoscopy reveals SARS-CoV-2-induced remodeling of human airway cells. bioRxiv preprint 1–57 (2021) doi: 10.1101/2021.08.05.455126. [DOI] [Google Scholar]
- 33.Elsherbini A & Bieberich E Ceramide and Exosomes: A Novel Target in Cancer Biology and Therapy. in Advances in Cancer Research vol. 140 121–154 (2018). [DOI] [PMC free article] [PubMed] [Google Scholar]
- 34.Verweij FJ et al. Quantifying exosome secretion from single cells reveals a modulatory role for GPCR signaling. Journal of Cell Biology 217, 1129–1142 (2018). [DOI] [PMC free article] [PubMed] [Google Scholar]
- 35.Rowat AC et al. Nuclear envelope composition determines the ability of neutrophil-type cells to passage through micron-scale constrictions. Journal of Biological Chemistry 288, 8610–8618 (2013). [DOI] [PMC free article] [PubMed] [Google Scholar]
- 36.Miyabe Y, Miyabe C, Mani V, Mempel TR & Luster AD Atypical complement receptor C5aR2 transports C5a to initiate neutrophil adhesion and inflammation. Sci Immunol 4, eaav5951 (2019). [DOI] [PubMed] [Google Scholar]
- 37.Subramanian BC et al. The LTB4-BLT1 axis regulates actomyosin and β2-integrin dynamics during neutrophil extravasation. J Cell Biol 219, 32854115 (2020). [DOI] [PMC free article] [PubMed] [Google Scholar]
- 38.Sarmento MJ, Ricardo JC, Amaro M & Šachl R Organization of gangliosides into membrane nanodomains. FEBS Letters 594, 3668–3697 (2020). [DOI] [PubMed] [Google Scholar]
- 39.Dasgupta R, Miettinen MS, Fricke N, Lipowsky R & Dimova R The glycolipid GM1 reshapes asymmetric biomembranes and giant vesicles by curvature generation. Proc Natl Acad Sci U S A 115, 5756–5761 (2018). [DOI] [PMC free article] [PubMed] [Google Scholar]
- 40.Venturini V et al. The nucleus measures shape changes for cellular proprioception to control dynamic cell behavior. Science (1979) 370, eaba2644 (2020). [DOI] [PubMed] [Google Scholar]
- 41.Lomakin AJ et al. The nucleus acts as a ruler tailoring cell responses to spatial constraints. Science (1979) 370, eaba2894 (2020). [DOI] [PMC free article] [PubMed] [Google Scholar]
- 42.Ferguson AD et al. Crystal structure of inhibitor-bound human 5-lipoxygenase-activating protein. Science (1979) 317, 510–512 (2007). [DOI] [PubMed] [Google Scholar]
- 43.Jayadev S et al. Phospholipase A2 is necessary for tumor necrosis factor α-induced ceramide generation in L929 cells. Journal of Biological Chemistry 272, 17196–17203 (1997). [DOI] [PubMed] [Google Scholar]
- 44.Kilarski W & Jasiński A The formation of multivesicular bodies from the nuclear envelope. J Cell Biol 45, 205–211 (1970). [DOI] [PMC free article] [PubMed] [Google Scholar]
- 45.Conti CJ & Klein-Szanto AJ Nuclear multivesicular bodies in cultured hamster cells. Experientia 29, 850–851 (1973). [DOI] [PubMed] [Google Scholar]
- 46.Larios J, Mercier V, Roux A & Gruenberg J ALIX- And ESCRT-III-dependent sorting of tetraspanins to exosomes. Journal of Cell Biology 219, e201904113 (2020). [DOI] [PMC free article] [PubMed] [Google Scholar]
- 47.McCullough J, Fisher RD, Whitby FG, Sundquist WI & Hill CP ALIX-CHMP4 interactions in the human ESCRT pathway. Proc Natl Acad Sci U S A 105, 7687–7691 (2008). [DOI] [PMC free article] [PubMed] [Google Scholar]
- 48.Willms E et al. Cells release subpopulations of exosomes with distinct molecular and biological properties. Scientific Reports 6, 22519 (2016). [DOI] [PMC free article] [PubMed] [Google Scholar]
- 49.Song L, Tian X & Schekman R Extracellular vesicles from neurons promote neural induction of stem cells through cyclin D1. Journal of Cell Biology 220, e202101075 (2021). [DOI] [PMC free article] [PubMed] [Google Scholar]
- 50.Matsui T, Osaki F, Hiragi S, Sakamaki Y & Fukuda M ALIX and ceramide differentially control polarized small extracellular vesicle release from epithelial cells. EMBO Rep 22, e51475 (2021). [DOI] [PMC free article] [PubMed] [Google Scholar]
- 51.Kremserova S & Nauseef WM Isolation of Human Neutrophils from Venous Blood. Methods in Molecular Biology 2087, 33–42 (2020). [DOI] [PubMed] [Google Scholar]
- 52.Tucker KA, Lilly MB, Heck L & Rado TA Characterization of a new human diploid myeloid leukemia cell line (PLB-985) with granulocytic and monocytic differentiating capacity. Blood 70, 372–8 (1987). [PubMed] [Google Scholar]
- 53.Drexler HG, Dirks WG, Matsuo Y & MacLeod RAF False leukemia-lymphoma cell lines: an update on over 500 cell lines. Leukemia 17, 416–26 (2003). [DOI] [PubMed] [Google Scholar]
- 54.Saunders CA, Majumdar R, Molina Y, Subramanian BC & Parent CA Genetic manipulation of PLB-985 cells and quantification of chemotaxis using the underagarose assay. Methods in Cell Biology vol. 149 (Elsevier Inc., 2019). [DOI] [PMC free article] [PubMed] [Google Scholar]
- 55.Persaud-Sawin DA, Lightcap S & Harry GJ Isolation of rafts from mouse brain tissue by a detergent-free method. Journal of Lipid Research 50, 759–767 (2009). [DOI] [PMC free article] [PubMed] [Google Scholar]
- 56.Cascianelli G et al. Lipid Microdomains in Cell Nucleus. Mol Biol Cell 19, 5289–5295 (2008). [DOI] [PMC free article] [PubMed] [Google Scholar]
- 57.Albi E, Lazzarini R & Magni MV Reverse sphingomyelin-synthase in rat liver chromatin. FEBS Letters 549, 152–156 (2003). [DOI] [PubMed] [Google Scholar]
- 58.Moltu K et al. A proteomic approach to screening of dynamic changes in detergent-resistant membranes from activated human primary T cells. Journal of Proteomics and Bioinformatics 6, 072–080 (2013). [Google Scholar]
- 59.Théry C et al. Minimal information for studies of extracellular vesicles 2018 (MISEV2018): a position statement of the International Society for Extracellular Vesicles and update of the MISEV2014 guidelines. Journal of Extracellular Vesicles 7, 1535750 (2018). [DOI] [PMC free article] [PubMed] [Google Scholar]
- 60.Truckenbrodt S, Sommer C, Rizzoli SO & Danzl JG A practical guide to optimization in X10 expansion microscopy. Nature Protocols 14, 832–863 (2019). [DOI] [PubMed] [Google Scholar]
- 61.Huff J et al. The new 2D Superresolution mode for ZEISS Airyscan. Nature Methods 14, 1223–1223 (2017). [Google Scholar]
Associated Data
This section collects any data citations, data availability statements, or supplementary materials included in this article.
Supplementary Materials
Stitched time-lapse images of di-4ANEPPDHQ stained PMNs chemotaxing towards 100 nM fMLF, showing Lo regions (green, left), Ld regions (red, center), and the corresponding GP image. Pseudo-colored GP images are based on the colormap, with white/red shades depicting lipid ordered regions and blue/darker shades representing lipid disordered regions. For colormap, see Figure 2A. Images were captured at 15-sec intervals and stitched together to create a movie at 20 frames per sec speed.
Time-lapse movie of dHL60 cells expressing nSMase1-eGFP (green) and stained with Hoechst (blue) chemotaxing towards 100 nM fMLF. Images were captured at 15-sec intervals and stitched together at frame rate of 2 frames per sec.
Stereoscopic rendering of olive-colored Hoechst-stained isolated nuclei, showing the intensity distribution of FLAP staining, as presented in Figure 3A.
Stereoscopic rendering of FLAP, ceramide, and Hoechst 33342 stained isolated nuclei, showing the differential localization of FLAP and ceramide, as presented in Figure 3C.
Data Availability Statement
All the raw data and associated statistic calculations presented have been provided as “source data” for the respective figures. Owing to the large size of high-resolution z-stack microscopy images, the raw microscopy images are available from the corresponding author upon reasonable request.