

Summary
Vagus nerve stimulation (VNS) is a neuromodulation therapy for a broad and expanding set of neurologic conditions. Yet, the mechanism through which VNS influences central nervous system circuitry is not well described, limiting therapeutic optimization. VNS leads to widespread brain activation, but the effects on behavior are remarkably specific, indicating plasticity unique to behaviorally-engaged neural circuits. To understand how VNS can lead to specific circuit modulation, we leveraged genetic tools including optogenetics and in vivo calcium imaging in mice learning a skilled reach task. We find that VNS enhances skilled motor learning in healthy animals via a cholinergic reinforcement mechanism, producing a rapid consolidation of an expert reach trajectory. In primary motor cortex (M1), VNS drives precise temporal modulation of neurons that respond to behavioral outcome. This suggests that VNS may accelerate motor refinement in M1 via cholinergic signaling, opening new avenues for optimizing VNS to target specific disease-relevant circuitry.
Introduction
Vagus Nerve Stimulation (VNS) is currently used in clinical care to treat epilepsy (Ben-Menachem et al., 1994; The Vagus Nerve Stimulation Study Group, 1995) and depression (Rush et al., 2005), but novel stimulation paradigms may treat a growing range of neurologic injuries (Dawson et al., 2021; Shi et al., 2013; Tyler et al., 2017). Recently, VNS paired with motor rehabilitation was FDA-approved for the treatment of motor deficits associated with stroke (Dawson et al., 2021). Preclinical and early clinical studies suggest that other paired-VNS paradigms can accelerate functional recovery from neurologic conditions including spinal cord injury, peripheral nerve injury and traumatic brain injury (Ganzer et al., 2018; Meyers et al., 2019; Pruitt et al., 2016). Despite the wide-ranging etiology of these conditions, the therapeutic model is similar: VNS is paired with a relevant rehabilitation protocol. It is hypothesized that precise timing of stimulation drives targeted circuit plasticity for recovery (Kimberley et al., 2018; Tyler et al., 2017). Yet, the lack of a clear circuit mechanism limits optimization of VNS therapy to treat neurologic injury.
The circuitry that mediates the effects of VNS on central nervous system plasticity remains poorly understood. Vagus nerve afferents terminate in the brainstem nucleus tractus solitarius (NTS) (Krahl et al., 1998), and NTS projects to subcortical and cortical brain regions, including neuromodulatory nuclei (Beaumont et al., 2017; Collins et al., 2021; Hulsey et al., 2017). Lesions of neuromodulatory centers, including the cholinergic basal forebrain (BF), limit both VNS-driven cortical map plasticity (Hulsey et al., 2019, 2016) and functional rehabilitation after peripheral nerve damage (Meyers et al., 2019). In addition, the cholinergic basal forebrain has been indicated as necessary for motor learning (Conner et al., 2010), and phasic cholinergic signals are thought to play critical roles in reinforcement learning and outcome representation (Hangya et al., 2015; Zhang et al., 2019). Together, these data suggest a possible role for phasic cholinergic signaling in mediating the effects of VNS-driven learning.
Paired-VNS drives expansion of the cortical map for the associated sensory(Borland et al., 2016) or motor representation(Porter et al., 2012). However, map expansion is delayed relative to changes in behavior, and does not always correlate to improved performance (Reed et al., 2011). To achieve the improvements in motor and sensory learning, VNS must also influence neural activity and plasticity on shorter, behaviorally-relevant timescales. Electrophysiological (Chase et al., 1966; Fraschini et al., 2013; Usami et al., 2013) and in vivo imaging studies(Collins et al., 2021) have identified broad, excitatory effects of VNS across multiple cortical regions. Yet, this non-specific alteration in excitatory drive cannot account for the selectivity of paired-VNS stimulation, which requires a specific refinement of relevant cortical circuits (Ganzer et al., 2018).
To understand the mechanism by which VNS selectively modulates neural circuits to optimally enhance motor behavior, we compared the effect of VNS timing on skilled reach learning in mice and probed the underlying circuit using optogenetic cholinergic circuit manipulation, kinematic analysis, and in vivo calcium imaging in the motor cortex. Paired-VNS enhanced skilled reach learning, but only when applied after a successful reach (Success VNS). Improved reach performance was explained by accelerated consolidation of reach trajectory onto an expert trajectory, indicating earlier and more effective motor learning. Cholinergic neural activity in the BF was required for the effects of VNS on motor learning and reach kinematics. VNS altered specific neural populations relevant to outcome representation in the primary motor cortex, and the effects of VNS in M1 were mitigated by cholinergic antagonists. These results indicate that VNS enhances motor learning through precisely-timed phasic cholinergic signaling to reinforce outcome, resulting in the recruitment of specific, behaviorally-relevant cortical circuits.
Results
VNS enhances skilled motor learning when paired with successful task outcome
To induce motor rehabilitation and cortical plasticity, VNS must be paired with movement (Engineer et al., 2011; Porter et al., 2012), yet an optimal pairing protocol has not been identified (Ganzer et al., 2018). To determine the optimal timing of VNS during skilled motor learning, we applied multiple VNS pairing protocols as mice learned a skilled forelimb reaching task (Whishaw et al., 2008). Using a newly developed chronic VNS approach for mice (Mughrabi et al., 2021), we implanted a microfabricated stimulation cuff on the left cervical vagus nerve (Fig. 1a), connected to a skull-mounted headcap. Mice were trained to perform a the skilled reach task, where they learn to reach through a slit to grab a food pellet off a post, for 14 days (Fig. 1b,c,).
Figure 1 |. VNS modulates forelimb reach learning and requires temporally specific stimulation.
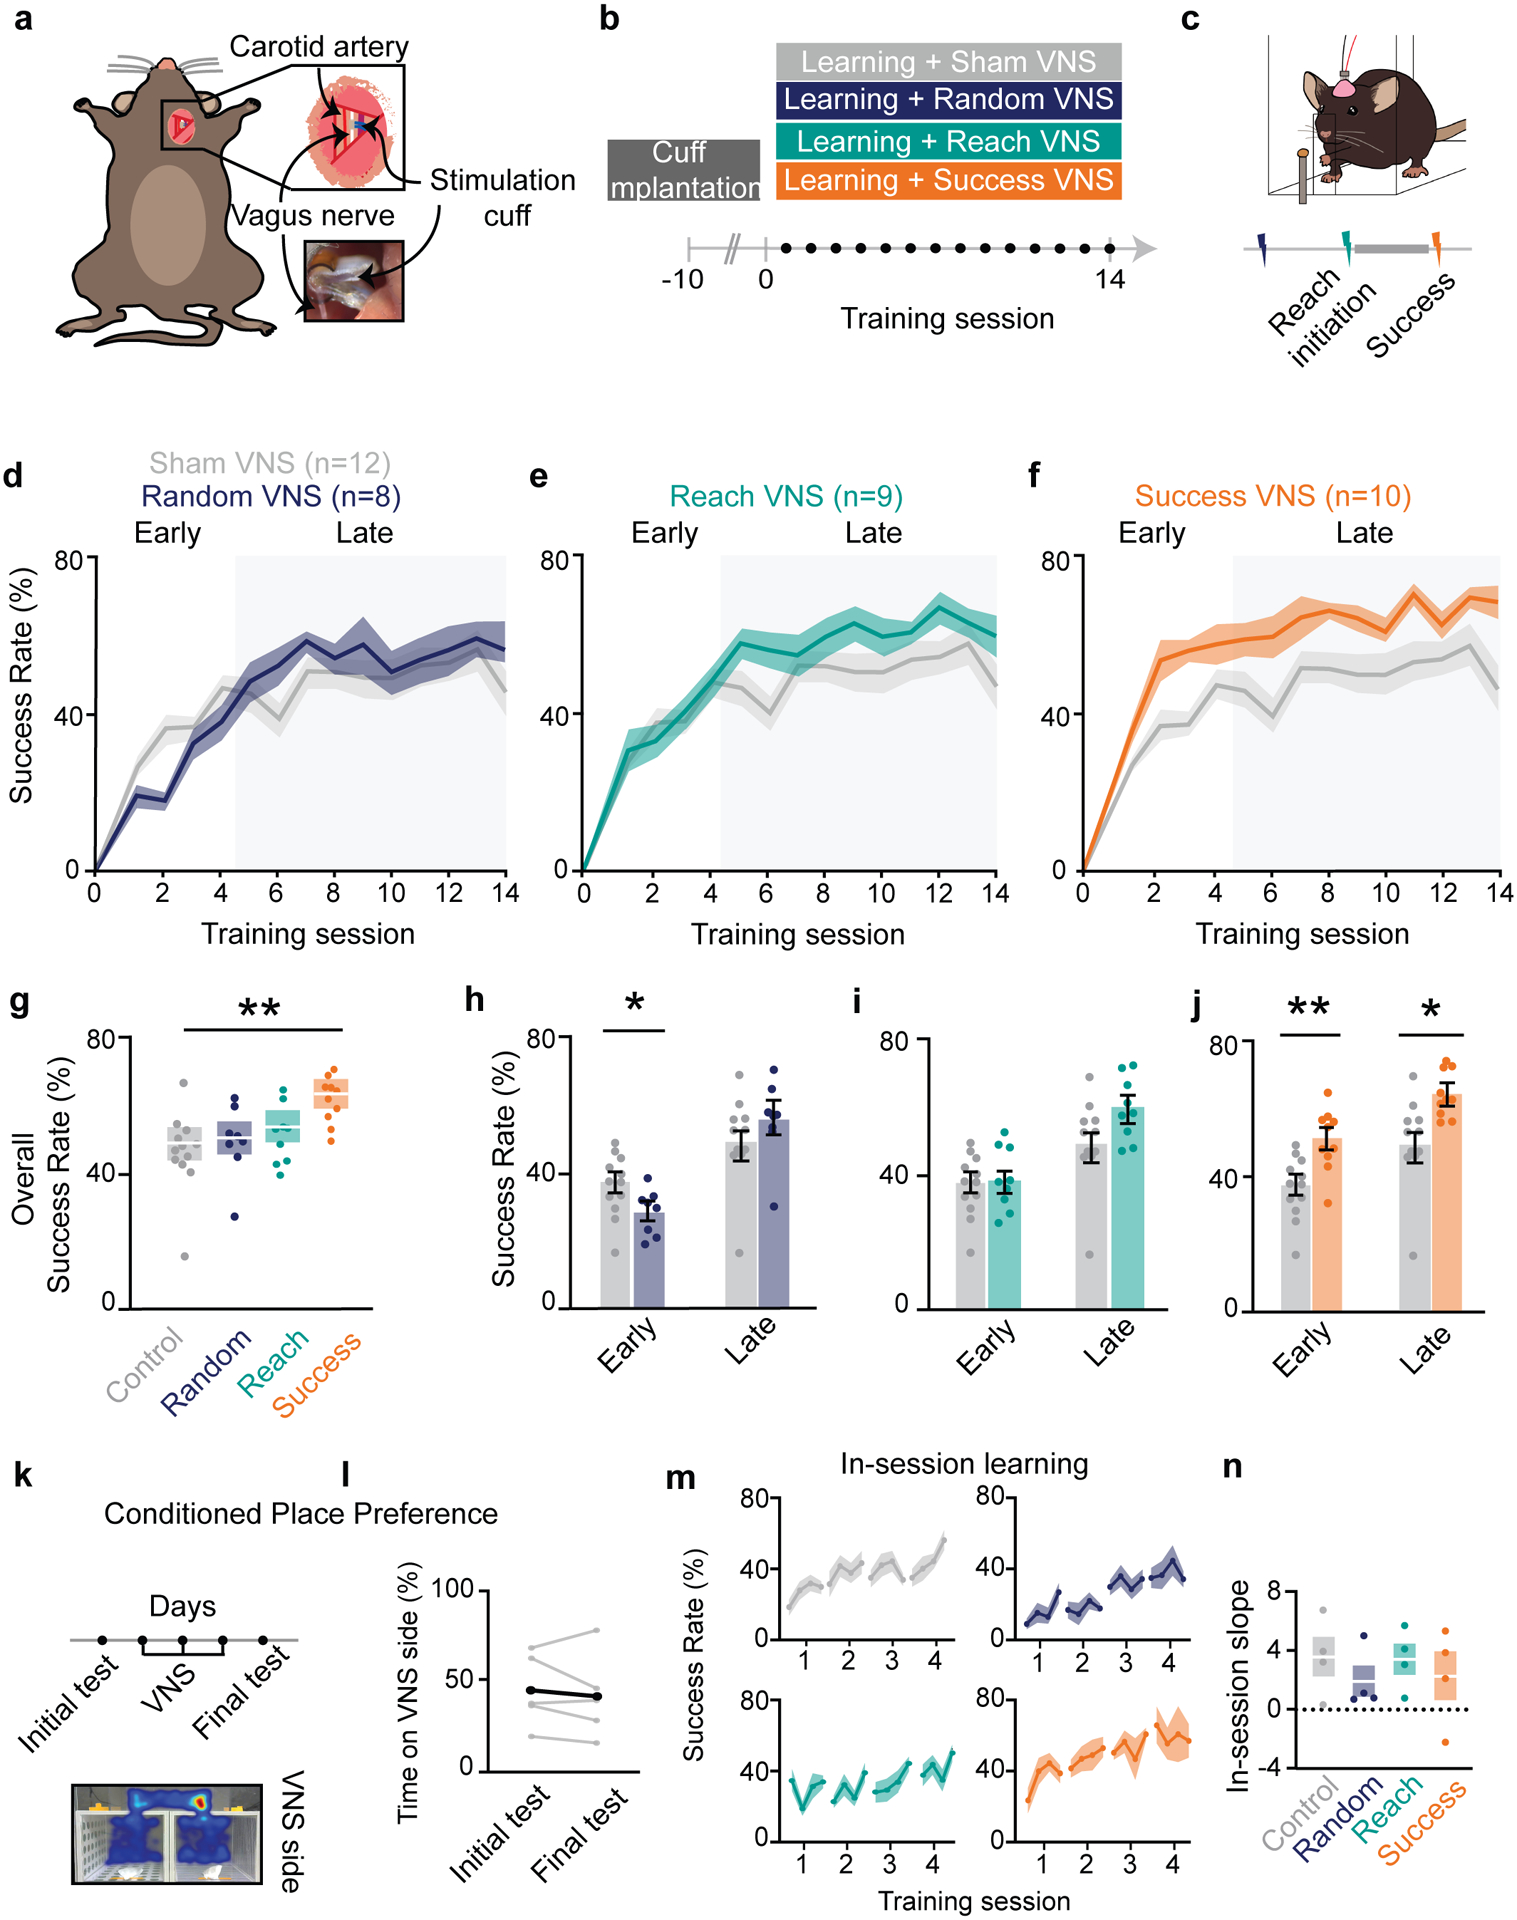
a, VNS surgical approach b, Behavior timeline c, Stimulation protocol, with Reach and Success VNS applied before and after reach, respectively. d-f, Random VNS, Reach VNS, and Success VNS success rate across 14 sessions of training. g, Comparison of mean performance across all days between control and stimulated groups (Success VNS: p=0.0065, f=9.24, Random VNS: p>0.05, Reach VNS: p>0.05, REML). Shaded boxes denote s.e.m. h, Comparison of mean success rate for control and Random VNS mice during early (p=0.028, f=7.07, Student T test) and late learning (p>0.05). i, Comparison of mean success rate for control and Reach VNS mice during early and late learning (p>0.05). j, Comparison of mean success rate for control and Success VNS mice during early (p=0.0031) and late learning (p=0.0126). k&l, VNS mice performed a conditioned place preference test after 3 days being stimulated in one of two distinct rooms. m&n, In-session learning trajectories for each group. o, Comparison of within session learning between all groups across 4 days of learning. In all figures, *p < 0.05, **p < 0.01, ***p< 0.001 bars and error bars represent the mean ± s.e.m.
We explored three possible mechanisms by which VNS could influence motor learning: arousal, spike-timing dependent plasticity and reinforcement (Fig. 1b,c, see Methods). To test if VNS drives plasticity by increasing widespread cortical excitation and arousal (Collins et al., 2021; Groves and Brown, 2005; Narayanan et al., 2002), VNS was applied at pseudo-random intervals (Random VNS) during the 20-minute training session. To determine if VNS acts through modulation of short-term attention or by influencing spike timing dependent plasticity (Feldman, 2012), VNS was applied at the initiation of a subset of reach movements (Reach VNS). To explore if VNS may augment reward or reinforcement related to movement outcome (Dayan and Balleine, 2002; Leong et al., 2017), VNS was applied after successful reach completion (Success VNS). The surgical control cohort was implanted with stimulation cuffs and connected to a stimulation isolation unit that was turned ‘off’ (Sham VNS). To ensure that each VNS group received a similar number of stimulation pulses, the mean stimulation pulse number per session was calculated for a small cohort of Success VNS animals, and then applied to the experimental design of the Random and Reach VNS groups (Methods). A post-hoc analysis of stimulation pulse number demonstrated that Random VNS received ~2 additional stimulation pulses per session (17.90 ± 0.92) than Reach VNS (15.75 ± 1.75) and Success VNS (15.96 ± 1.68) (Random-Reach: p=0.021, Random-Success: p=0.005, Tukey HSD; Supp. Fig. 1a). However, the amount of stimulation delivered did not correlate with success across groups (Supp. Fig. 1b) or within groups (Supp. Fig. 1c), suggesting that the additional pulses did not influence reach learning or performance. Animals in all cohorts learned to perform the skilled reach task (Sham VNS: p=0.0001, Random VNS: p=0.0001, Reach VNS: p=0.0002, Success VNS: p=0.001; Supp. Fig. 2b). Neither Random nor Reach VNS altered the success rate of the animals relative to Sham VNS (Random VNS: 47.4 ± 3.9%; Reach VNS: 53.6 ± 3.5%; Sham VNS: 46.3 ± 3.2%; Fig. 1d,e,g). However, Success VNS improved the overall success rate compared to Sham VNS (59.2 ± 3.1% vs 46.3 ± 3.2%; Fig. 1f,g), demonstrating that paired VNS can enhance motor learning in healthy animals.
Prior work on learning of a skilled reach suggests a multiphasic approach to learning, with distinct early and late learning phases (Padmashri and Dunaevsky, 2019; Peters et al., 2017). Yet the timing of early to late transition has not been empirically demonstrated. Using a Weibull growth curve nonlinear model of the control learning curve, we identified an inflection point (55.49% ± 6.81) to determine early learning (days 1–4) and late learning (days 5–14; Supp. Fig. 2a). We next examined if VNS exerted distinct effects during different learning stages. Despite having no effect on the overall success rate, Random VNS impaired early learning (27.3 ± 7.3% vs. 37.4 ± 8.9%), but performance recovered during late learning (Fig. 1h). Reach VNS had no influence on success rates at any phase of learning (Fig. 1i). Success VNS increased success rates during the early and late phases (Early: 50.6 ± 9.4% vs. 37.4 ± 8.9%; Late: 63.6 ± 6.9 vs. 49.6 ± 13.2%; Fig. 1j). To determine if Success VNS improved learning above the other stimulation protocols (Random or Reach VNS) we compared these groups during early and late learning. During early learning, Success VNS increases success rate compared to Random and Reach VNS, and Random VNS has a lower success rate than Reach VNS (Random VNS: 27.3 ± 7.3%, Reach VNS: 38.0±9.3%, Success VNS: 50.6 ± 9.4% Supp. Fig. 2c). In contrast, during late learning, there were no differences across stimulation groups (Supp. Fig. 2c). These data suggest that VNS paired with a successful outcome accelerates learning, while random VNS temporarily impairs early learning. Moreover, during early learning, Success VNS outperforms Reach and Random VNS, while in late learning differences between VNS protocols are not significant, suggesting the timing of VNS is critical during early learning, but more flexible in late learning.
Only Success VNS enhanced motor learning, indicating a mechanism contingent on successful outcomes, likely reward or reinforcement. To determine if VNS serves as a rewarding or aversive stimulus (Wickens et al., 2003), we used the conditioned place preference test (CPP) (Fig. 1k). Implanted mice were introduced to two rooms with distinct visual and olfactory cues, with VNS applied in only one room for several days. On the final day probe session, mice spent equal time in the conditioned room as they did in their initial naïve session (44.8 ± 2.0% and 41.4 ± 2.3%; Fig. 1l), indicating that VNS is not inherently rewarding or aversive. Together, these results suggest that Success VNS may act by augmenting reinforcement cues, but not serve as a rewarding stimulus.
To determine if VNS alters within-session learning or between-session learning (Censor et al., 2012), training session data was grouped into 4 blocks of 5 trials each (Fig. 1m,n), and the within-session learning slope was quantified over the first 4 days (Fig. 1o). The within-session learning slope was not significantly different between conditions, suggesting that Success VNS likely enhances between-session learning.
VNS confers short-term performance benefits during the execution of learned tasks.
To further confirm the behavioral results were due to learning, and not short-term modulation of attention, we compared the success rate of trials that immediately follow a stimulation (post-success) to those immediately prior (pre-success). We found no effect of VNS on the success rate of trials following stimulation (Fig. 2a,b). We next compared the response to Success VNS to an unstimulated probe trial block included on days 7 and 14 (Fig. 2c). On day 14, the success rate for unstimulated trials was greater than Sham VNS (61.9 ± 6.3% vs. 46.6 ± 9.2%; Fig. 2d), suggesting that Success VNS led to stimulation-independent, lasting learning. Yet, success rate during stimulated blocks was greater than unstimulated blocks on day 14 (69.7 ± 10.2% and 61.9 ± 6.3%), but not day 7 (Fig. 2e), implying an additional short-term performance benefit that emerges during late learning.
Figure 2 |. VNS improves success rate within sessions and in learned mouse during rehearsal of forelimb reach task.
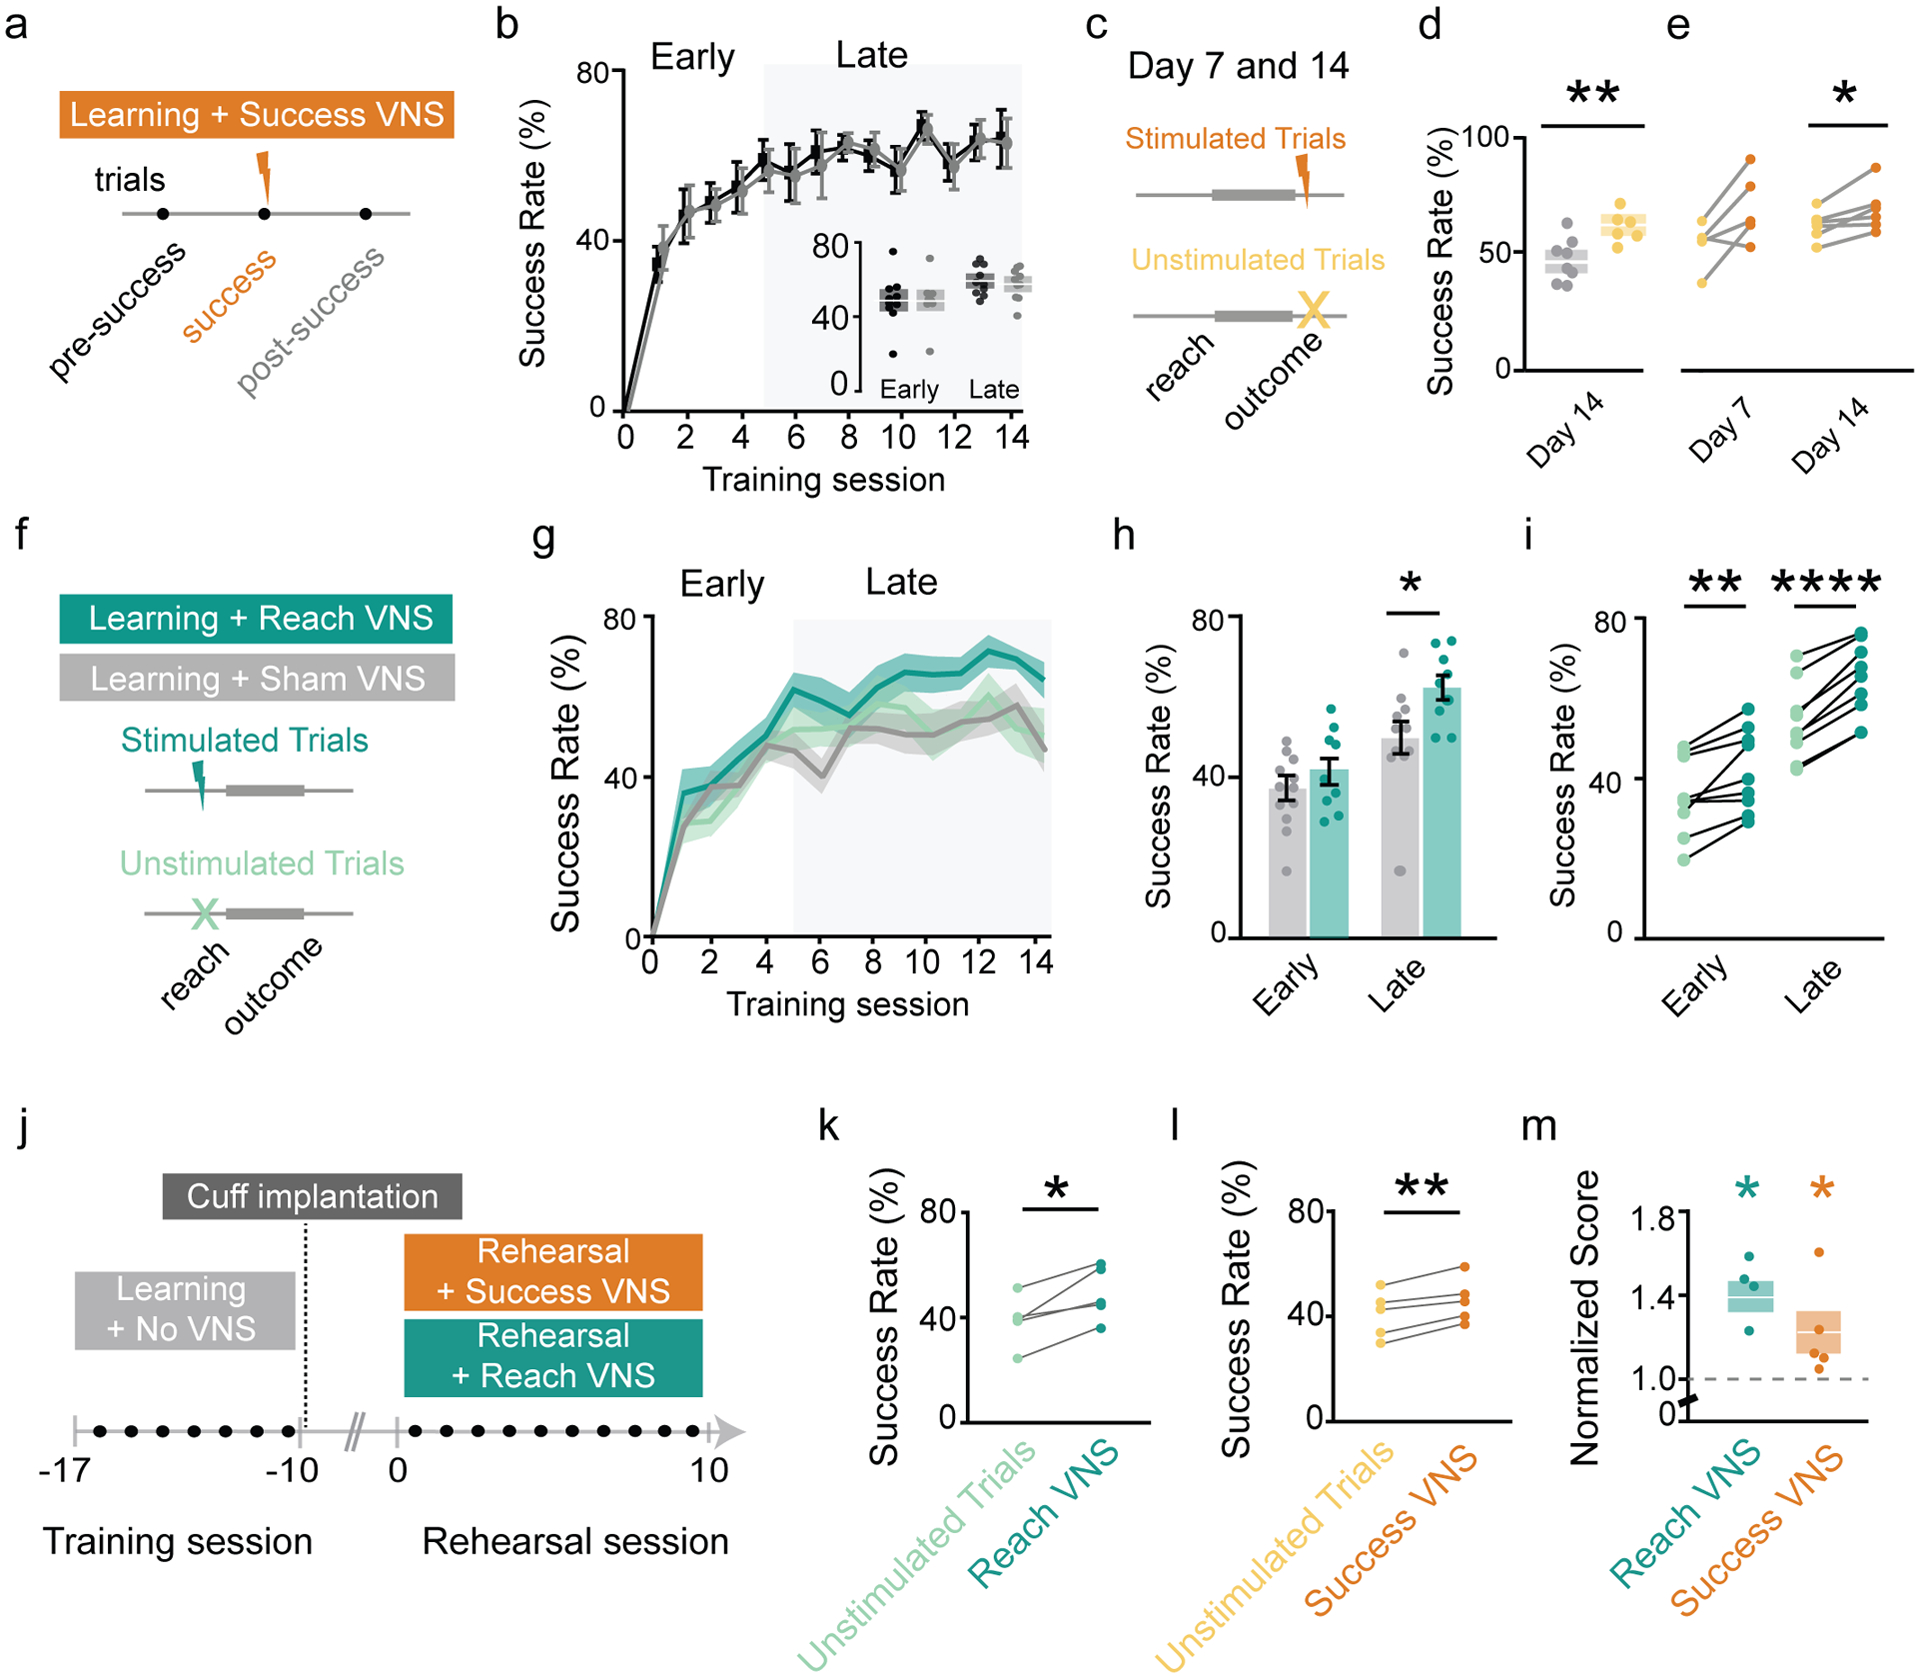
a, Trials before and after a stimulated success are investigated in success VNS. b, Comparison of success rate for reaches preceding or following stimulated reach. c, For Success VNS, day 7 and 14 trials are divided into equal blocks of unstimulated and stimulated trials. d, Comparison of unstimulated (light orange) and sham (grey) trials on day 14 (p=0.0059, t=3.34, Student’s T test). e, Comparison of stimulated (dark orange) and unstimulated (light orange) trials on days 7 & 14 (Day 7: p>0.05; Day 14: p=0.0499, t=2.57, Ratio paired t test). f, Reach VNS schematic. g, Success rates across training sessions for Sham (grey), Stimulated Reach VNS (dark green), and Unstimulated Reach VNS (light green). h, Comparison of Stimulated Reach VNS and Sham VNS trials in early (p>0.05) and late learning (p=0.024, t=2.47, Student’s T test). i, Comparison between stimulated Reach VNS and unstimulated Reach VNS trails in early (p=0.004, t=3.98, paired t test) and late learning (p<0.0001, t=10.08, paired t test). j, Success VNS and Reach VNS applied during rehearsal of reach task in trained mice. k, Stimulated Reach VNS trials improve success rate during rehearsal (p=0.015, t=4.058, paired t test). l, Stimulated Success VNS trials improve success rate during rehearsal (p=0.005, t=5.62, paired t test). m, Normalized improvement of Stimulated Reach VNS (p=0.047, t=3.56) and stimulated Success VNS trials (p=0.028, t=4.16) compared to unstimulated trials (Sidak’s multiple comparison’s test in RM one-way ANOVA).
To further explore potential short-term benefits of VNS, we performed subgroup analysis of only stimulated or unstimulated reaches in the Reach VNS group (Fig. 2f). During late learning, the success rate of stimulated trials, but not unstimulated trials, is greater than sham (64.0 ± 9.4% vs. 50.8 ± 13.7%; Fig. 2h; Supp. Fig. 2d). Paired analysis for individual animals shows a higher success rate for stimulated trials compared to unstimulated trials in both the early and late phase (Early: 41.9 ± 10.2% vs. 35.3 ± 9.7%; Late: 64.0 ± 9.4% vs. 53.7 ± 9.5%; Fig. 2i). Taken together, Reach VNS provides a short-term performance boost for stimulated trials throughout learning. Similar to Success VNS (Fig. 2e), Reach VNS most effectively modulates short-term performance for during late learning.
To explore if this generalizes to tasks that are already known (learned without VNS), we applied paired VNS to animals already proficient in the skilled reaching task (Fig. 2j). Both Success VNS (Fig. 2l,m) and Reach VNS (Fig. 2k,m), delivered on alternate days for 10 days, improved performance over trial blocks without VNS (Success VNS: 46.0 ± 8.5% vs. 40.8 ± 8.9%; Reach VNS: 49.0 ± 10.2% vs. 38.8 ± 9.5%), confirming that either pairing protocol is sufficient to modulate the short-term performance of a known task. This demonstrates that VNS confers short-term enhancement to performance of known motor skills.
VNS drives neural activity in the basal forebrain (BF)
Cholinergic neuromodulation is associated with reinforcement-driven plasticity (Guo et al., 2019; Hangya et al., 2015) and is required for motor learning (Kucinski et al., 2019; Ramanathan et al., 2009, 2015). The BF is the source of cortically-projecting cholinergic neurons (Gielow and Zaborszky, 2017), however it was unknown if BF neurons respond to VNS. To address this question, we implanted tetrodes into the BF of mice with implanted VNS cuffs (Fig. 3a). Extracellular activity was recorded during VNS in awake animals in their home cage (30 Hz, 0.6 mA, 100 μs pulse, 500 ms train). VNS modulated the firing rate of BF neurons (Fig. 3b,c), with altered activity in 43% of recorded units, and increased activity in 61% of those units (Fig. 3d). On average, the firing rate modulation of activated neurons began during the stimulation train (200 ms after stim onset) and persisted for ~1s after stimulation ended (Fig. 3e).
Figure 3 |. VNS drives BF neural activity in anesthetized and awake mice.
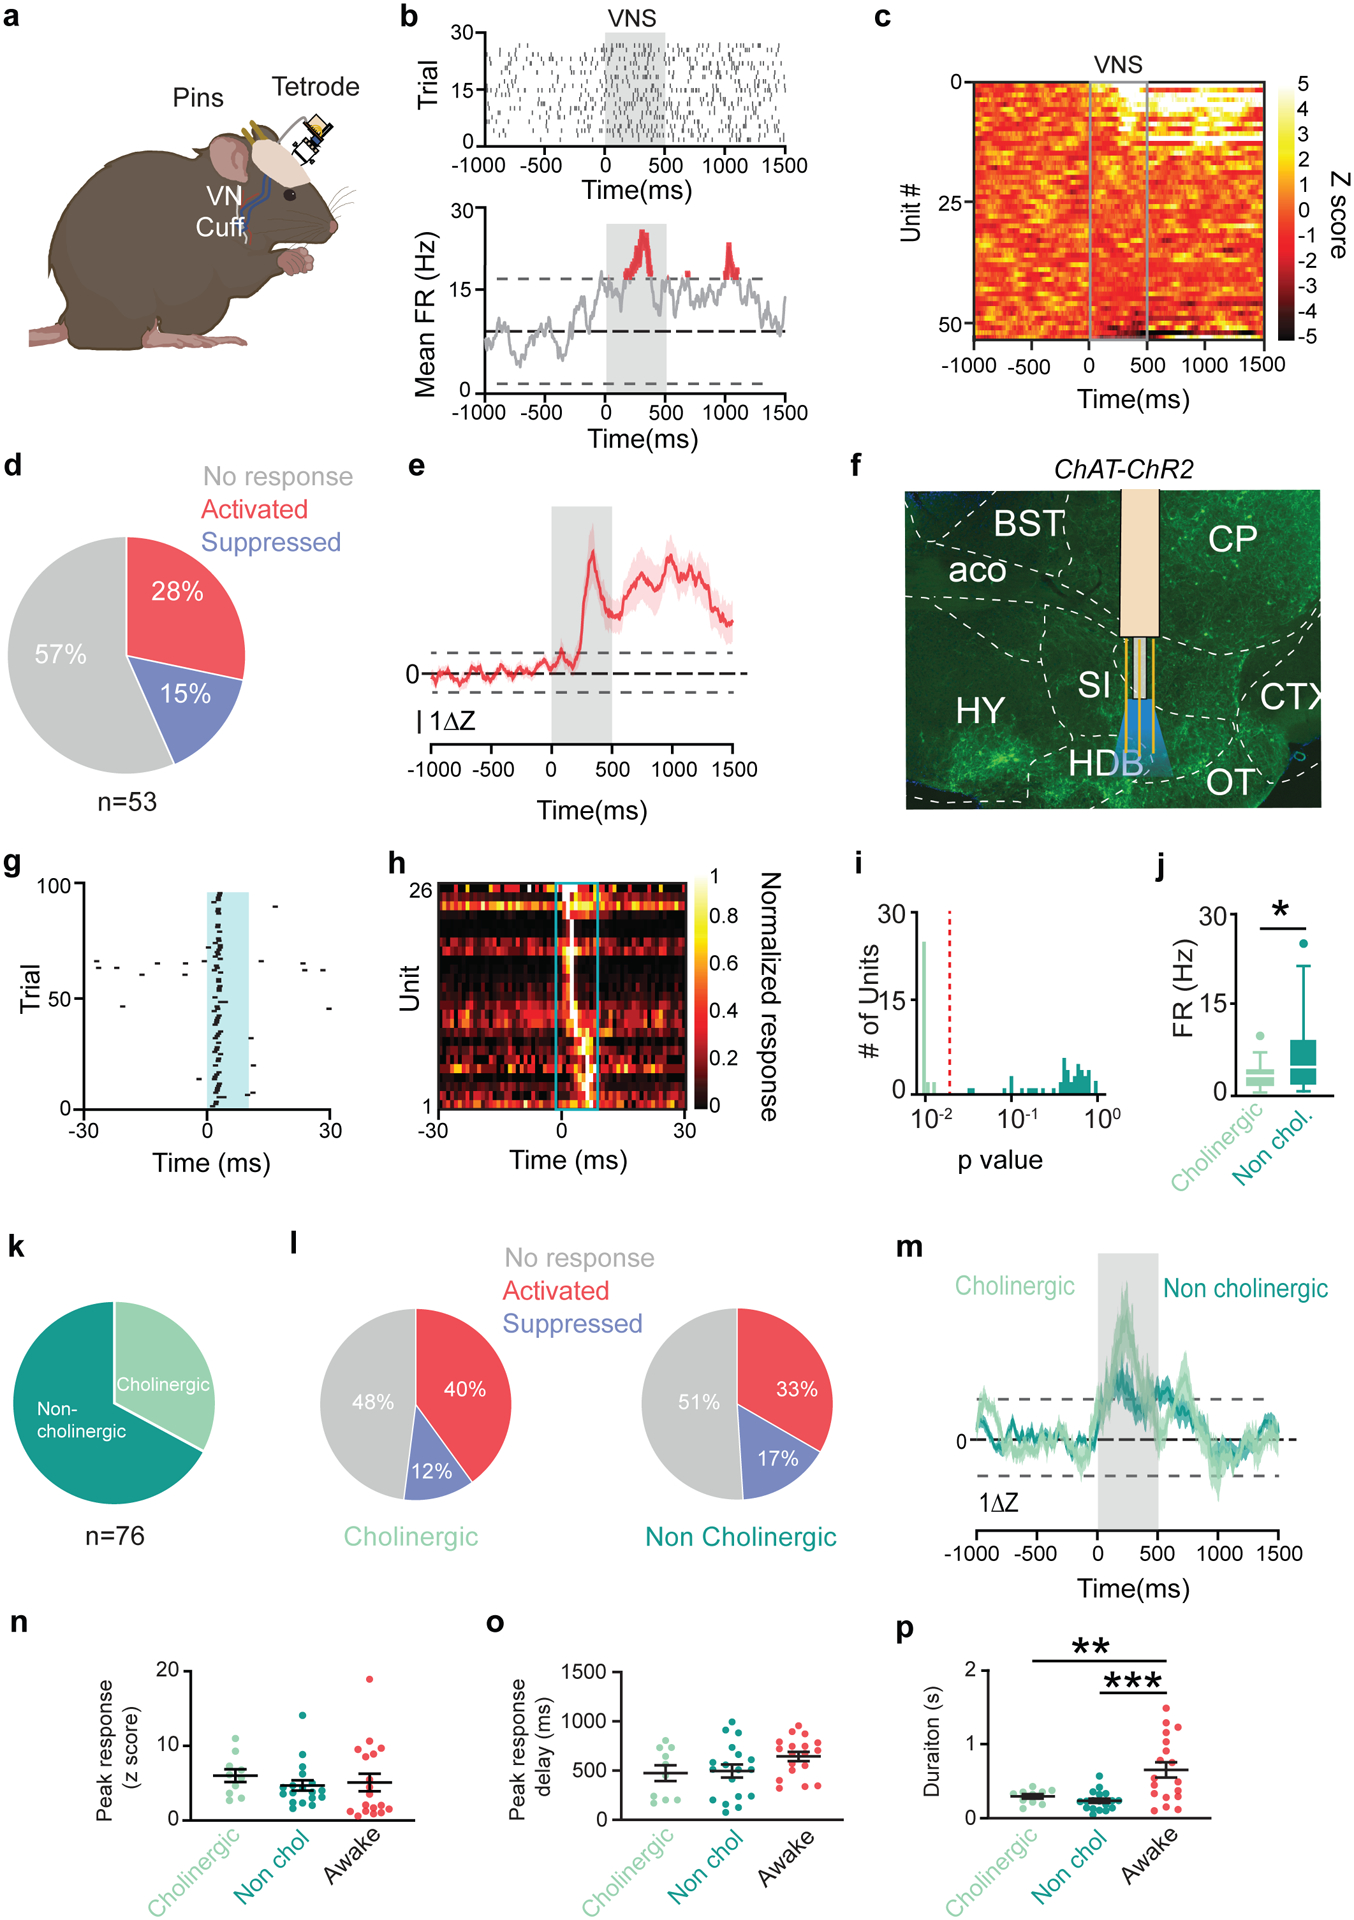
a, Schematic of experimental set up. b, Example raster (top) and average firing rate from a response to VNS. Grey box denotes stimulus delivery. c, Average responses of all recorded neurons to VNS (grey box). d, % of neurons that respond to VNS (N = 5 mice, 53 neurons). e, Average activity of all ‘activated’ neurons in response to VNS. Dashed lines mark significance, shading represents SE. f, Recordings with optrodes were targeted at the HDB in ChAT-ChR2 transgenic mice under light anesthesia. Green fluorescence denotes the presence of ChR2. g, Example cholinergic neuron responding consistently to pulses of 488 nm light. h, Average activity of all cholinergic neurons during opto-tagging. Each row represents a neuron. i, Stimulus-associated latency tests (SALT) separate light responsive neurons from non-light responsive neurons. j, Mean baseline FR of cholinergic and non-cholinergic neurons (p=0.013, N = 5 mice, 53 neurons). k, Percent of neurons categorized as cholinergic (light green) and non-cholinergic (dark green) (N = 6 mice, 76 neurons). l, Percent of units that are VNS-responsive in cholinergic (left) and noncholinergic (right) populations. m, Average response to VNS for all ‘activated’ neurons. n, Mean peak activation during VNS. o, Average delay of peak activation from VNS onset. p, Mean duration of significantly elevated activity after VNS (cholinergic vs. awake p=0.0087, non-cholinergic vs. awake p=0.0003).
To identify cholinergic neurons from the multiple cells types found within the BF (Do et al., 2016), we used an opto-tagging approach (Lima et al., 2009) combined with tetrode recordings to interrogate their response to VNS. Acute recordings were performed in anesthetized ChAT-ChR2 transgenic mice (B6.Cg-Tg(Chat-COP4*H134R/EYFP,Slc18a3)6Gfng/J; Fig. 3f). Cholinergic neurons were identified by their rapid response to light (Fig. 3g,h) and confirmed using SALT analysis (Hangya et al., 2015) (latency 5.2 ± 1.3 ms; Fig. 3i). Cholinergic neurons exhibited a lower baseline firing rate (3.4 ± 2.1 Hz) than the non-cholinergic population (6.8 ± 6.2 Hz; Fig. 3j). Of 76 units, roughly ⅓ were cholinergic (Fig. 3k) and half of both neuron populations were VNS-responsive (52% of cholinergic, 49% of non-cholinergic; Fig. 3l). Of the VNS-responsive units, most cholinergic units and non-cholinergic units showed increased activity (Fig. 3m), suggesting that VNS increases activity in cholinergic and non-cholinergic BF neurons.
A comparison of VNS-driven activation in anesthetized and awake recordings suggests that VNS response depends on arousal state (Fig. 3e,m), consistent with prior findings (Collins et al., 2021). While the peak response magnitude and timing to VNS do not change between awake and anesthetized animals (Fig. 3n,o), awake animals have a longer response than anesthetized animals (awake: 652.7 ± 439 ms; cholinergic: 293.7 ± 94 ms; non-cholinergic: 235.8 ± 127 ms; Fig. 3p).
Optogenetic cholinergic inhibition prevents VNS-enhanced motor learning
Having established that VNS can drive BF cholinergic neurons, we next wanted to determine if these neurons mediate the effects of VNS on enhanced motor learning. To do so, we used optogenetic control to silence cholinergic neurons during VNS. An inhibitory opsin (AAV-EF1a-DIO-eArch3.0-EYFP) was injected into the BF of ChAT-Cre transgenic mice, followed by implanted optical fibers and VNS cuffs (see Methods; Fig. 4a). Mice then learned to perform the skilled reach task (Fig. 4b) and either received Success VNS, Success VNS with simultaneous optical inhibition cholinergic neurons (Arch+VNS), or no stimulation (Fig. 4c). VNS animals (40.55 ± 7.1%) performed significantly better than controls (31.23 ± 10.4%), while Arch+VNS animals performed at control levels (25.59 ± 9. 3%; Fig. 4d,e). While all cohorts learned the task (Fig. 4f), cholinergic inhibition prevented VNS-driven performance increases in both learning phases (Early: 19.02 ± 9.5%; Late: 28.66 ± 4.1%) compared to VNS mice (Early: 32.81 ± 17.1%; Late: 48.28 ± 11.6%; Fig. 4g), demonstrating that phasic cholinergic signaling is necessary for VNS-enhanced motor learning.
Figure 4 |. Success-paired VNS motor learning enhancement requires cholinergic neuromodulation.
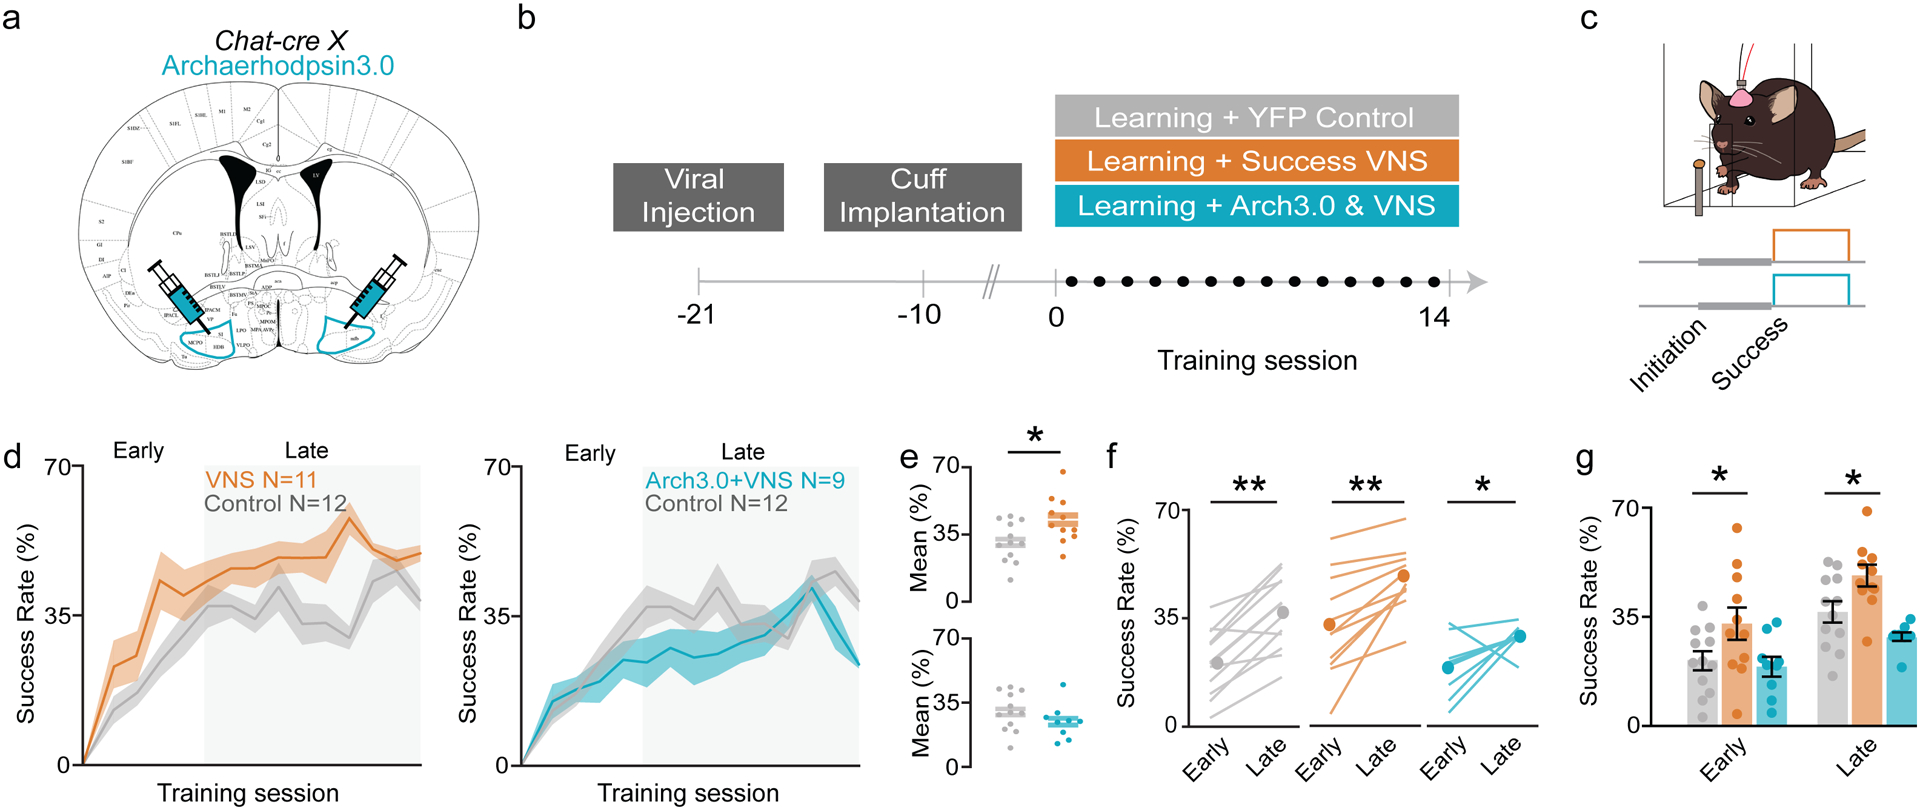
a, A subset of VNS-implanted ChAT-Cre transgenic mice received injections of viral constructs containing Archaerhodpsin3.0 in the BF. b, Timeline of experimental set up and training. Each training session lasts for 20 minutes. c, Depending on cohort, mice receive VNS, or continuous 532 nm light and VNS simultaneously, after successful reach attempts. d, Average success rate for all mice over the course of learning (VNS N=11, Arch+VNS N=9, Control N=12). e, Mean performance across all days between VNS and control (p=0.0409 ,top), and Arch+VNS and control (p>0.05 ,bottom). f, Mean success rate of all groups between early and late phases (Control p=0.0001, VNS p=0.0009, Arch VNS p=0.0379). g, Mean success rate for control and VNS mice during early (p=0.0458) and late (p=0.0001) learning phases and control and Arch+VNS mice (p>0.05).
VNS reduces off-target failures through increased reach consistency
To further explore how VNS influences skilled reach, we measured the kinematic features of the reach across learning and conditions. To obtain accurate kinematic measures, we designed a custom closed-loop automated reaching apparatus (CLARA) (Bowles et al., 2021) (Fig. 5a–c). Individual reach trial outcomes were categorized into one of four categories: success; reach failures; grasp failures; and retrieval failures (Fig. 5d). Out of all errors, Success-VNS mice made fewer reach failure errors than control and Arch+VNS mice (VNS: 54.14 ± 10.4%; Control: 72.16 ± 7.0%; Arch+VNS: 71.66 ± 4.5%), and more on-target grasp errors (VNS: 38.19 ± 9.2%, Arch+VNS: 24.00 ± 4.8%, control: 22.14 ± 6.0%; Fig. 5e,f), implying an improved accuracy in reach trajectory. Therefore, we explored if VNS drives a speed/accuracy trade-off (Shmuelof et al., 2012). We measured reach endpoint accuracy and outward reach velocity (see Methods; Supp. Fig. 3a,b) but found that Success VNS does not alter endpoint accuracy or speed of reach attempts (Supp. Fig. 3c).
Figure 5 |. VNS improves performance through improved consolidation of reach trajectory.
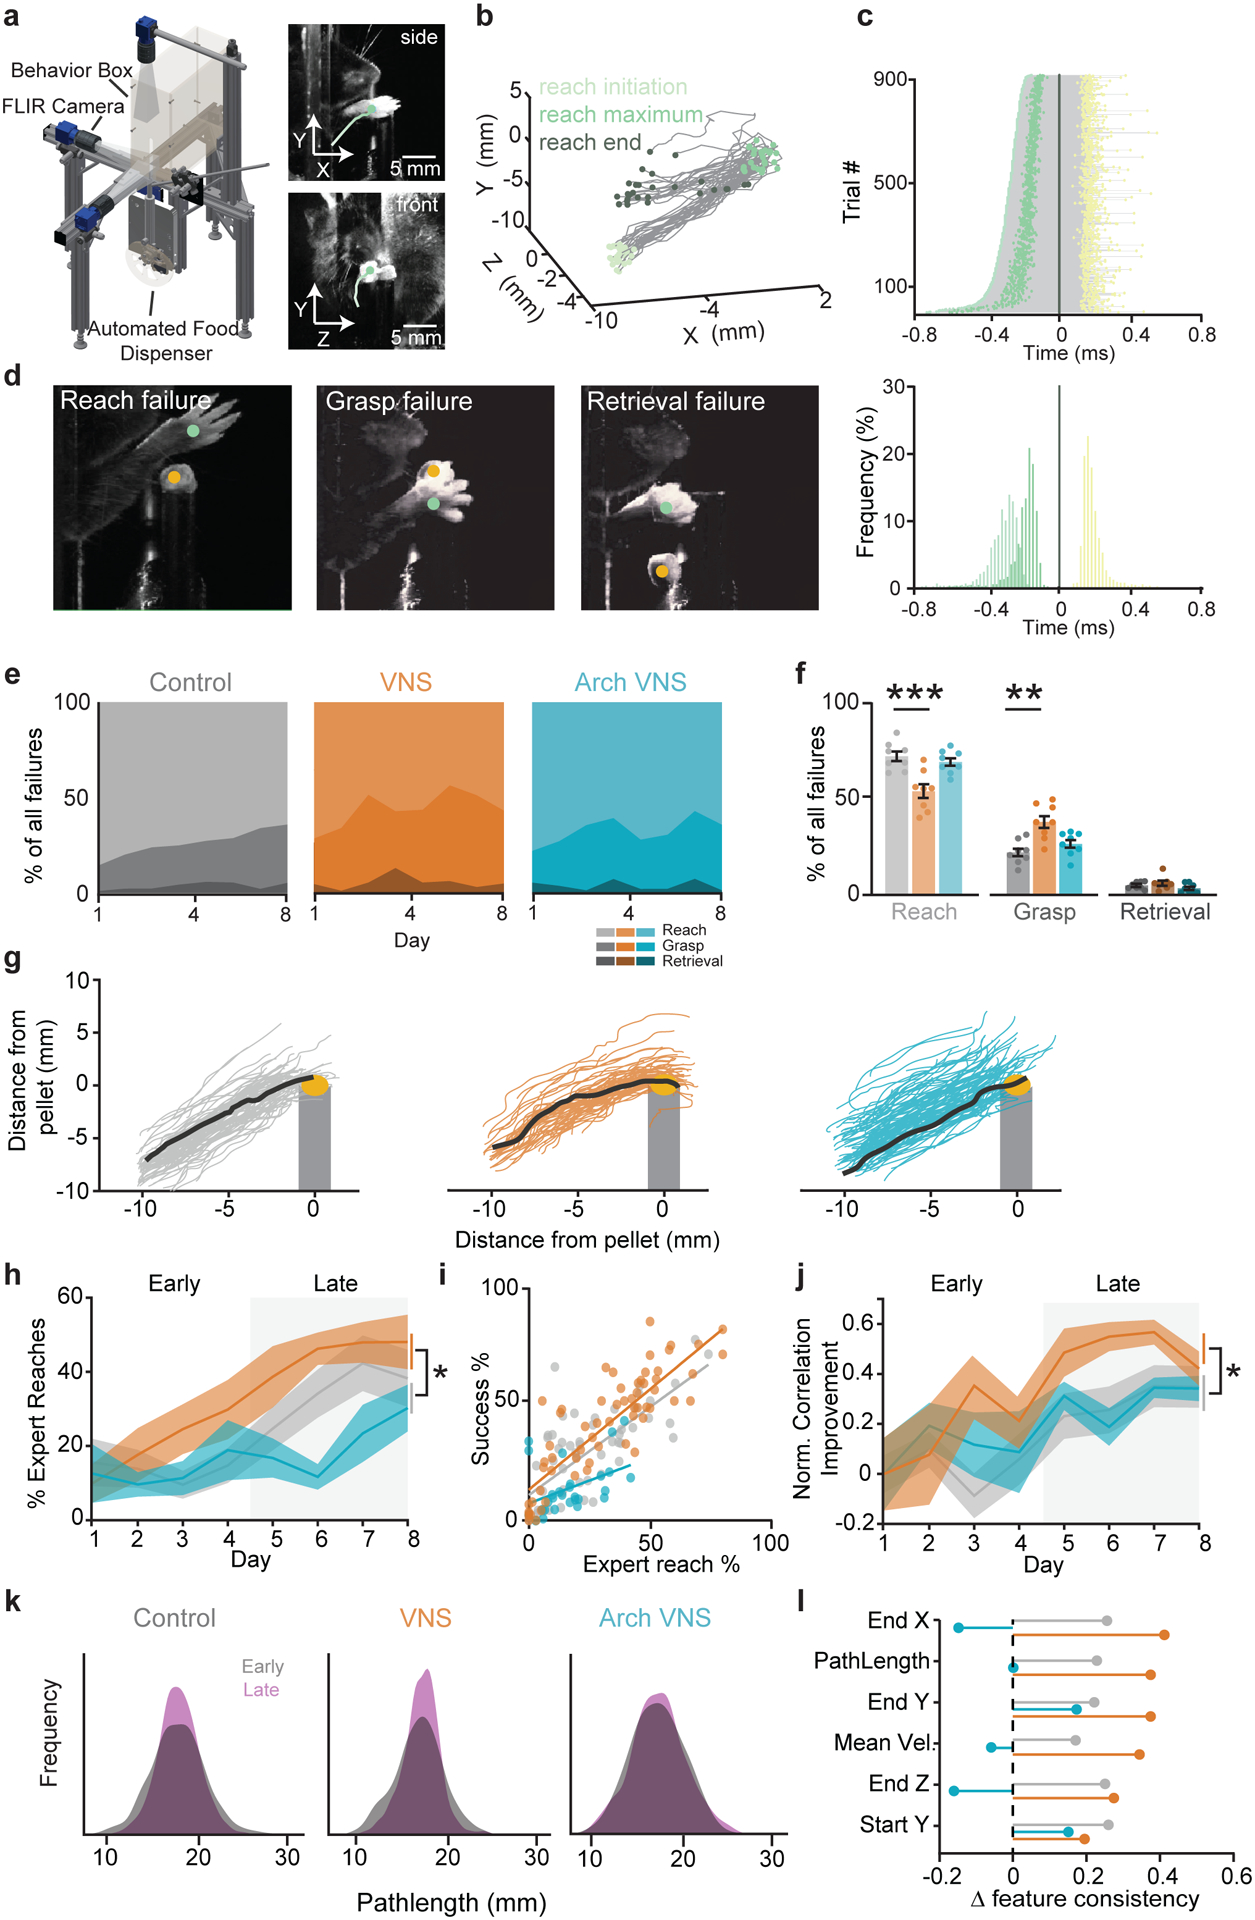
a, The Closed-loop automated reaching apparatus (CLARA) provides 3D tracking of the paw and pellet. b, Example trajectories and automatically generated reach events (one control session). c, Top: duration of all stimulated control trials, yellow dot denotes stimulus delivery (180±5ms). Bottom: a histogram of reach timepoints normalized to reach end. d, Example images of the subcategories of failed reaches (see Methods). e, Breakdown of failure outcomes for each group over 8 days of learning. Light colors: reach failures; intermediate: grasp failures; dark: retrieval failures. f, A comparison of types of failed attempts between control and VNS (reach errors: p=0.0005; grasp errors: p=0.0035) and between control and Arch+VNS mice (p>0.05, VNS N=8, Arch+VNS N=8, Control N=8). g, Examples outward trajectories during a session on day 8. Black lines represent each mouse’s ‘expert reach’. h, % of expert reaches. Comparisons were made for the mean ‘expert’ reaches in the late learning phase (grey box) between control and VNS mice (p=0.0142) and control and Arch+VNS mice (p>0.05, VNS N=8, Arch+VNS N=6, Control N=8). i, Correlation of expert reaches and task performance for all mice, R2=0.62. j, Improvement in reach failures toward an expert trajectory (normalized to day 1). Comparisons were made during late learning between control and VNS mice (p=0.0455) and control and Arch+VNS mice (p>0.05). k, Distribution of trajectory lengths from all failure attempts during early (grey) and late (purple) learning phases. l, Normalized improvement in reach features from early to late learning phases.
As animals learn the skilled reach task, their reach trajectories become more similar to their final expert reach trajectory (Kawai et al., 2015; Peters et al., 2017) as they learn a successful motor plan. To determine if VNS can influence motor plan selection, an expert trajectory was defined for each mouse based on the average successful reach trajectory over the last two days of training (see Methods; Fig. 5g). Expert reaches were identified by having a >0.95 correlation with the expert trajectory. On day 1 of training, all cohorts have similar percentage of expert reaches (Fig 5i; Supp. Fig. 3d), but during late learning, VNS mice made more expert reaches compared to control mice (VNS: 45.22 ± 4.4%; Control: 34.22 ± 6.6%) while cholinergic inhibition prevented this increase in expert reach selection (23.58 ± 6.2%; Fig. 5h). Expert reach attempts correlate strongly with behavioral performance (p=0.0001, R2=0.621; Fig. 5i). VNS also shapes the trajectory of reaches that end in failure. While reach failures rarely qualify as expert reaches (Supp. Fig. 5e), VNS increases the correlation of reach failures to the expert trajectory during late learning to a greater degree than control mice, and cholinergic inhibition prevents this increase (VNS: 50.18 ± 16.6; Control: 29.65 ± 19.9; Arch+VNS: 33.19 ± 11.6; Fig. 5j). Additional kinematic features also show a VNS-driven increase of the consolidation between early and late phases (Fig. 5k,l), indicating increased stereotypy in the VNS cohort reach. This data suggests that VNS drives all reaches closer to the expert reach trajectory, enhancing the selection of a successful motor plan, and this is mediated by cholinergic signaling.
VNS drives acute neural suppression and activation in motor cortex
VNS paired with forelimb movement alters motor cortical map plasticity (Porter et al., 2012), but the effect of VNS on neuronal function in motor cortex is unknown. Given that neural activity in M1 is required for both motor skill learning and execution (Guo et al., 2015; Kawai et al., 2015) (Supp. Fig. 4a), we hypothesize that VNS will modulate the neural activity and movement representation in M1. To investigate the effects of VNS on M1 neural activity, we imaged activity in neurons expressing the calcium indicator GCaMP6m using a head-mounted miniature microscope (UCLA miniscope V3, http://miniscope.org; Fig. 6a).
Figure 6 |. VNS drives acute neural suppression and activation in forelimb motor cortex.
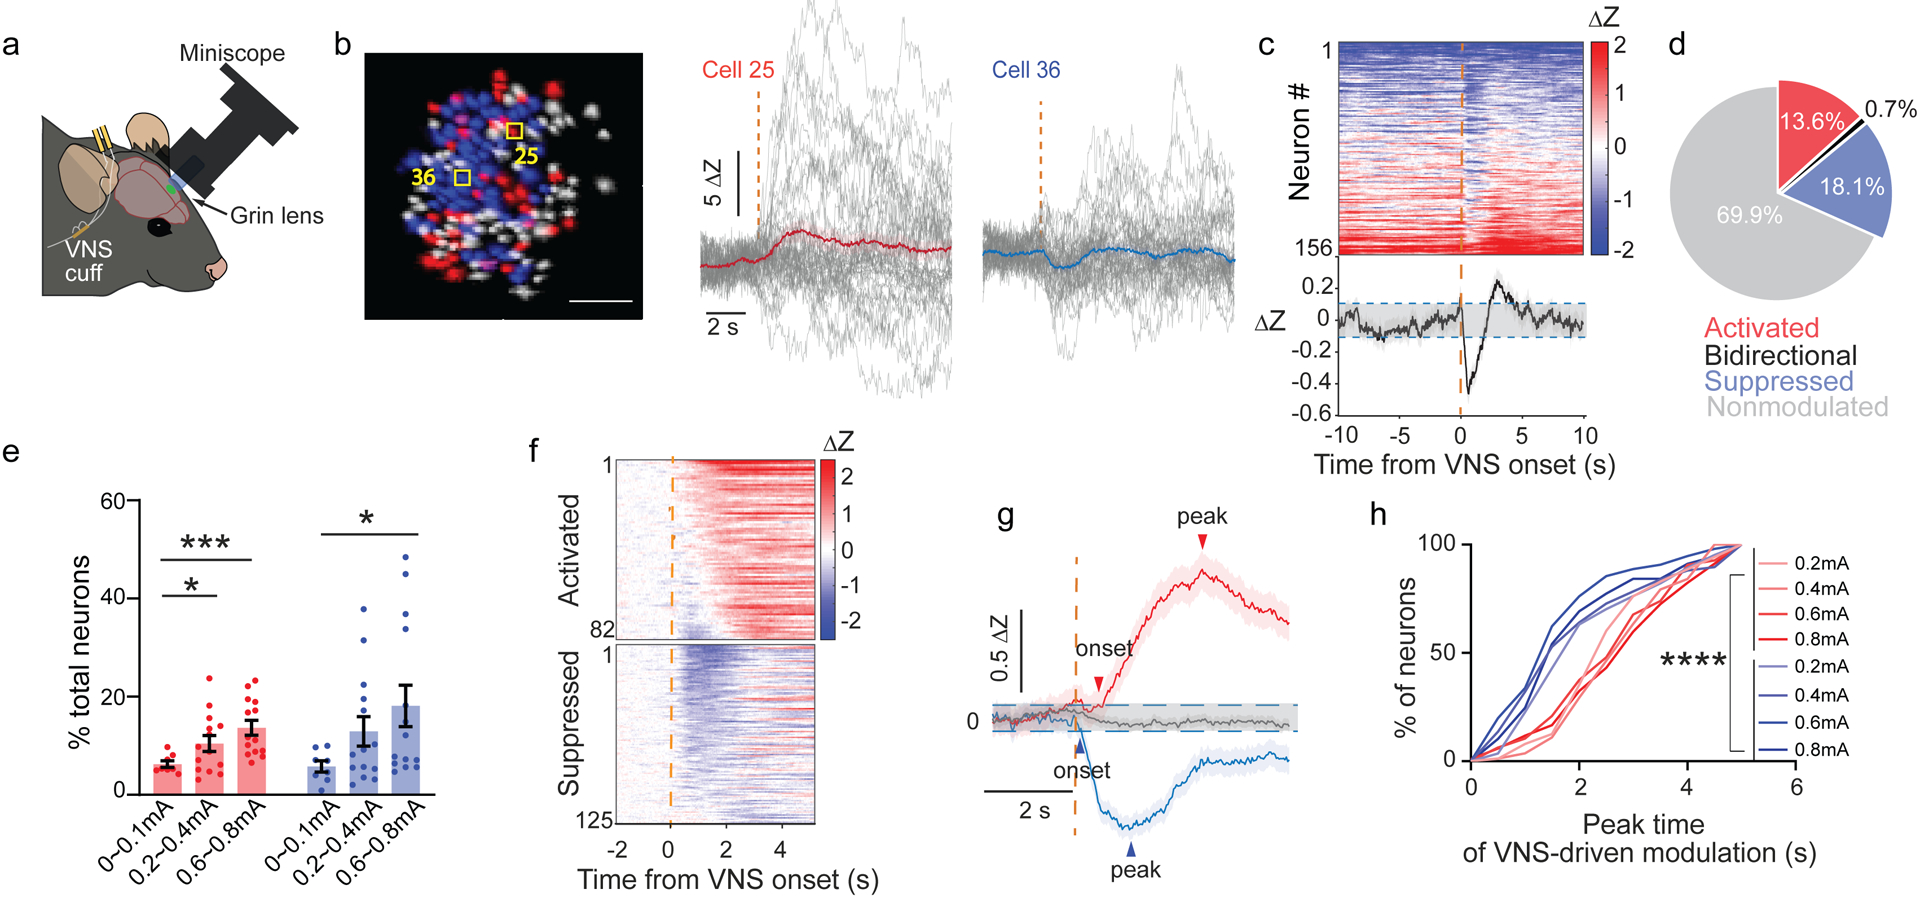
a, Schematic of experiment design. b, Left: representative neural ROIs from the field of view of one mouse M1 (n = 156 neurons): VNS-activated (red) and suppressed (blue), scale bar = 100 μm. Middle and right: representative neurons’ Ca2+ responses aligned by VNS onset (gray: individual trials; red: VNS-activated; blue: VNS-suppressed). c, Top: individual neurons’ average response z-scored to inactive phases of all neurons from the representative mouse in b; bottom: average neural responses of all neurons from the same mouse. d, Average % of total neurons activated, suppressed, bidirectionally modulated after 0.6~0.8mA VNS delivery (N = 7 mice, 767 neurons). e, % of total neurons that are activated or suppressed by VNS across different current amplitudes. (N = 7 mice, n= 747~807 neurons, One-way ANOVA and multiple group comparison to 0~0.1 mA group). f, Neural response heatmap of all activated neurons and all suppressed neurons aligned at VNS onset. g, Average neural activity of all activated neurons and all suppressed neurons aligned at VNS onset (N=7 mice, 82 activated, 125 suppressed, 0.6mA VNS). h, Cumulative distribution of neural response peak time of activated and suppressed neurons (See Methods, 82 to 151 neurons from each group, Kruskal-Wallis test followed by Dunn’s multiple comparisons test, p < 0.0001).
In response to VNS applied in the homecage, some neurons demonstrated either activation (red, cell 25; Fig. 6b) or suppression (blue, cell 36; Fig. 6b), without a change in the overall firing rate of the neuron population (Supp. Fig. 5a,b). Approximately 30% of all neurons showed acute response to a VNS delivery, with similar percentages of neurons showing activation and suppression (activation: 13.8 ± 5.8%; suppression: 18.1 ± 15.8%; Fig. 6d), and only a small fraction (0.7 ± 1.4%) showing bidirectional modulation (Fig. 6d). The percentage of neurons modulated depended on stimulation intensity (Fig. 6e).
Across the population of VNS-responsive neurons, we observed a temporal relationship between activation and suppression (Fig. 6c,f). The mean peak timing of the suppression precedes the activation by 1.2 s (Suppression: 1.6 s from VNS onset; Activation: 2.8 s; Fig. 6g), a relationship consistent across a range of stimulation intensities (Fig. 6h). Similarly, the onset of suppression preceding activation by 0.6 s (Supp. Fig. 5c). These together suggest that in primary motor cortex, VNS first drives acute neural suppression, followed by activation in two separate subpopulation of neurons, without altering the mean population firing rate.
Success VNS modifies the neural representation of reach outcome
We next examined the influence of Success VNS on movement representation during early learning. The neural activity in M1 was measured by miniscope imaging in mice as they learned the skilled reach task. Each reach was subdivided into a reach and an outcome phase using post hoc analysis (Fig. 7a). The reach phase includes the outward paw movement (~100 ms) and the return movement (~200 ms). Reach outcome was typically detected 200 ms after reach end. As anticipated (Donoghue and Sanes, 1994; Levy et al., 2020; Peters et al., 2014; Sanes and Donoghue, 2000), the average population activity was significantly modulated during movement (Fig. 7b). Nearly half of all neurons were movement modulated, with 13.3% of neurons modulated during reach and 31.7% modulated during success outcome. For success outcome-modulated neurons, roughly half were activated, and half were suppressed (success-activated: 16.3 ± 6.4%; success-suppressed: 15.4 ± 10.2%; Fig. 7c). The outcome representation of success differs from failure, both at the level of the population average response (Supp. Fig. 6 a,b) and individual neural responses (Supp. Fig. 6 c,d).
Figure 7 |. Success VNS selectively modulates activities of a subpopulation of task-activated M1 neurons in the reach task.
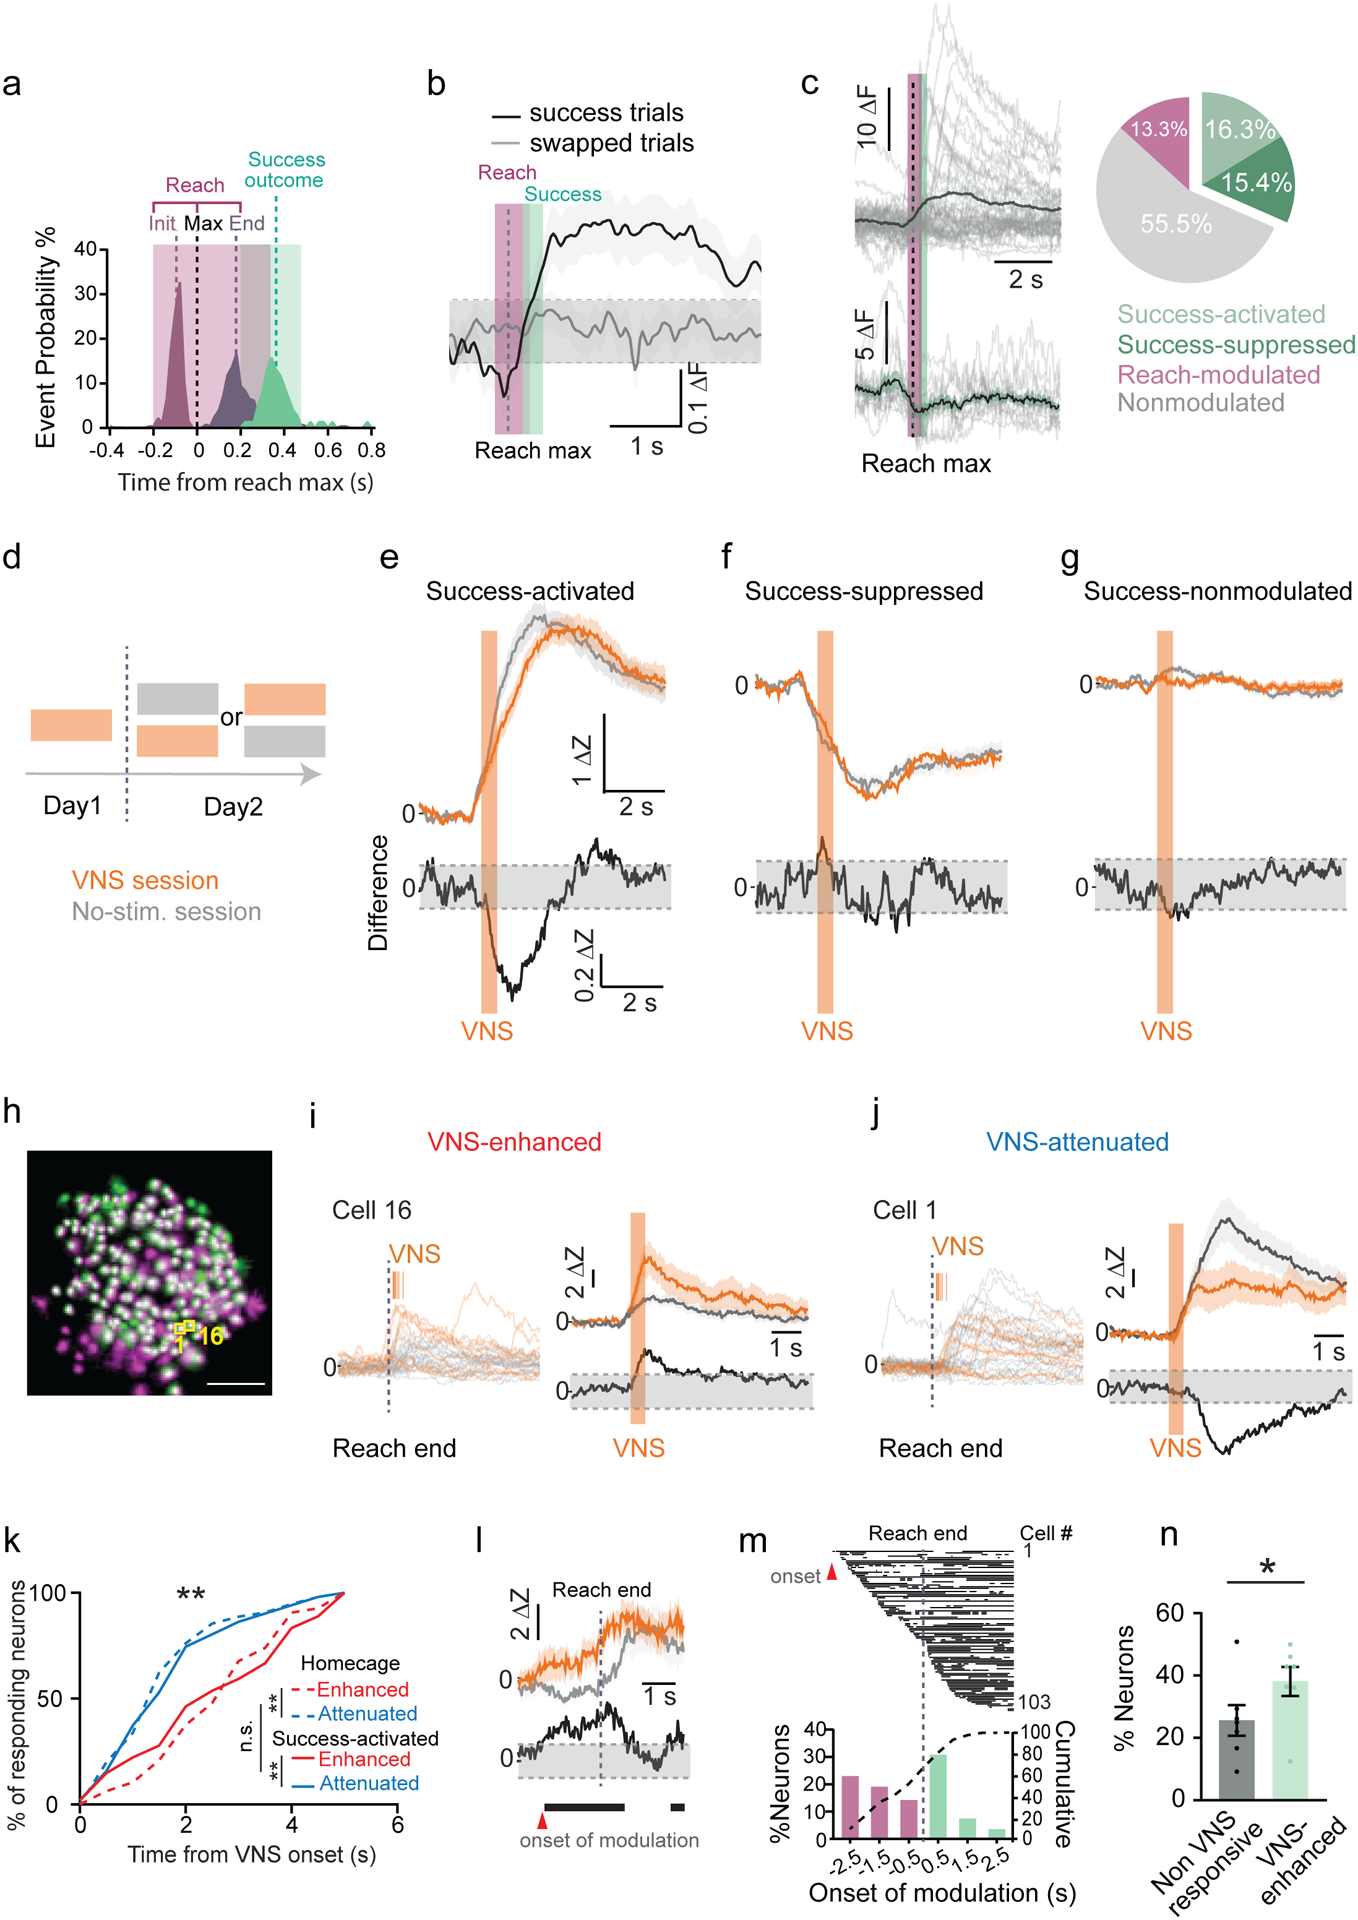
a, Peri-event histogram of the task related events aligned at reach max (N = 6 control mice, day 4, n = 278success trials). Magenta indicates full reaches, green success recognition. b, Average neural activity of success trials (black) and random control trials (grey, n = 488 neurons). Gray dashed line indicates 2 s.d. from the baseline mean. c, Left: representative neural responses: top success-activated, bottom success-suppressed, gray individual trials. Right: % neurons modulated in the task (903 neurons; 16.3 ± 6.4% success-activated, 15.4 ± 10.2% success-suppressed, 13.3 ± 5.5% preparation/reach modulated). d, Assignment of VNS or no-stimulation sessions. e-g, Top: Average responses of success-activated (d, n=115 & 101), success-suppressed (e, n=122 & 92) and success-nonmodulated neurons (f, n=383 & 394) in VNS (orange) and in no-stimulation session (gray). Bottom: the difference trace. h, Registered neurons (white) in VNS (green) and no-stimulation session (Magenta). i&j, Left: trial responses of success-activated neurons in no-stimulation and VNS session (orange ticks: VNS onset). Right: the average and difference responses aligned by VNS onset. k, Cumulative distribution of neural response onset (See Methods) of VNS-enhanced or attenuated neurons in homecage and success-activated populations (Homecage p=0.0001, Success-activated p=0.033, Kruskal-Wallis test). l, Example success-activated neuron modulated by VNS (supp. Fig. 6h) also have higher neural activity before reach end in VNS session. Arrowhead: onset of increased activity. m, Onset timing histogram of VNS-driven modulation of success-activated neurons. n, % neurons modulated in reach in VNS-nonmodulated versus VNS-enhanced neurons.
During Success VNS, stimulation is delivered at reach outcome, and so the acute neural response to VNS is likely to overlap with the intrinsic response to success outcome. To accurately detect VNS-related neural activity, mice participated in two daily sessions of training, one with VNS and one without. These sessions were administered on a pseudo-randomized schedule (Fig. 7d), and the average neural response was compared between the same day VNS and no-stimulation sessions. During VNS sessions, the success-activated neurons’ average response was first attenuated, then slightly enhanced (Fig. 7e). In contrast, success-suppressed (Fig. 7f), movement non-modulated (Fig. 7g) and failure-activated neural (Supp. Fig. 6f) responses did not differ between sessions. Moreover, in VNS sessions, the percentage of success activated and suppressed neurons were not different from no-stimulation sessions (Supp. Fig. 6e), suggesting that VNS modulates neurons that already represent success outcomes. These together suggest that Success VNS specifically modulates neurons already activated by success outcome.
To track the response of individual neurons to VNS, we cross-registered neuronal ROIs between the VNS and no-stimulation sessions (Fig. 7h; Methods, cross-registered neurons are a subset of neurons from Fig. 7 c–g). We found that VNS did not change the percentage of neurons in each category of task representation. To determine if VNS alters the temporal structure of suppression and activation during reach outcome, as seen in homecage conditions (Fig. 6g,h), we examined the temporal dynamics of the VNS response. Indeed, VNS produced a similar temporal dynamic as seen during homecage stimulation. VNS peak attenuation occurred with similar post-stimulation latency to VNS suppression in the homecage (1.85 ± 1.20 s vs. 1.78 ± 1.10 s after VNS onset; Fig. 7k), followed by peak enhancement at a similar latency to peak activation in the homecage (2.65 ± 1.50 s vs. 2.74 ± 1.20 s after VNS onset; Fig. 7k). During outcome and homecage VNS, neural suppression precedes activation (Homecage: p=0.001, Success-activated: p=0.033, Kruskal-Wallis Test, Fig. 7k, Supp. Fig. 6h). This difference was not present in success-activated neurons in trials without VNS (p=0.99, Kruskal-Wallis Test, Supp. Fig. 6i), or in any other neural population (success-suppressed, reach-activated, reach-suppressed, and non-task; p=0.99, Kruskal-Wallis Test, data not shown). This suggests that VNS alters the temporal structure of neural suppression and activation selectively for success-activated neurons in a manner unique from other neural populations.
Having established that the majority of success-activated neurons are acutely modulated by VNS during success outcome, we explored if the activity of these neurons is altered beyond the acute response to VNS. Neural activity was normalized to a pre-reach baseline epoch, and movement related activity was compared between the Success VNS and no-stimulation sessions. Neural activity during the VNS session often differed across the reach phase (Fig. 7l), with an onset of modulation occurring prior to VNS in nearly 60% of success-activated, VNS-modulated neurons (Fig. 7m). During the VNS session, all VNS-enhanced neurons are more likely to be active during the reach phase than VNS-nonmodulated neurons (38.1 ± 4.7% vs. 25.6 ± 4.9%; Fig. 7n). This suggests that VNS effects on neural activity persist beyond those seen during acute modulation.
VNS-driven acute neural modulation is mediated through acetylcholine receptors (AChRs)
Because the effects of VNS on motor learning are mediated by cholinergic signaling, we next set out to determine if the effects of VNS on neural activity in M1 likewise depend on acetylcholine. To test this, we injected awake, freely moving animals with a systemic acetylcholine receptor antagonist cocktail and measured the acute neural response to VNS in M1. The baseline acute VNS response in M1 was first measured in the homecage, then 15 minutes following administration of AChR antagonist cocktail, and finally in a washout session ~24 hours later (Fig. 8a). The percentage of VNS-modulated neurons was not changed by AChR antagonism (Supp. Fig. 7a). However, the average response amplitude of VNS modulated neurons, both activated and suppressed, were reduced by administration of cholinergic antagonists (Fig. 8b–e), but not saline control (Supp. Fig. 7b&c). This demonstrates that AChR mediated signaling is required for VNS-driven acute neural activation and suppression.
Figure 8 |. VNS driven acute neural modulation is mediated through AChRs.
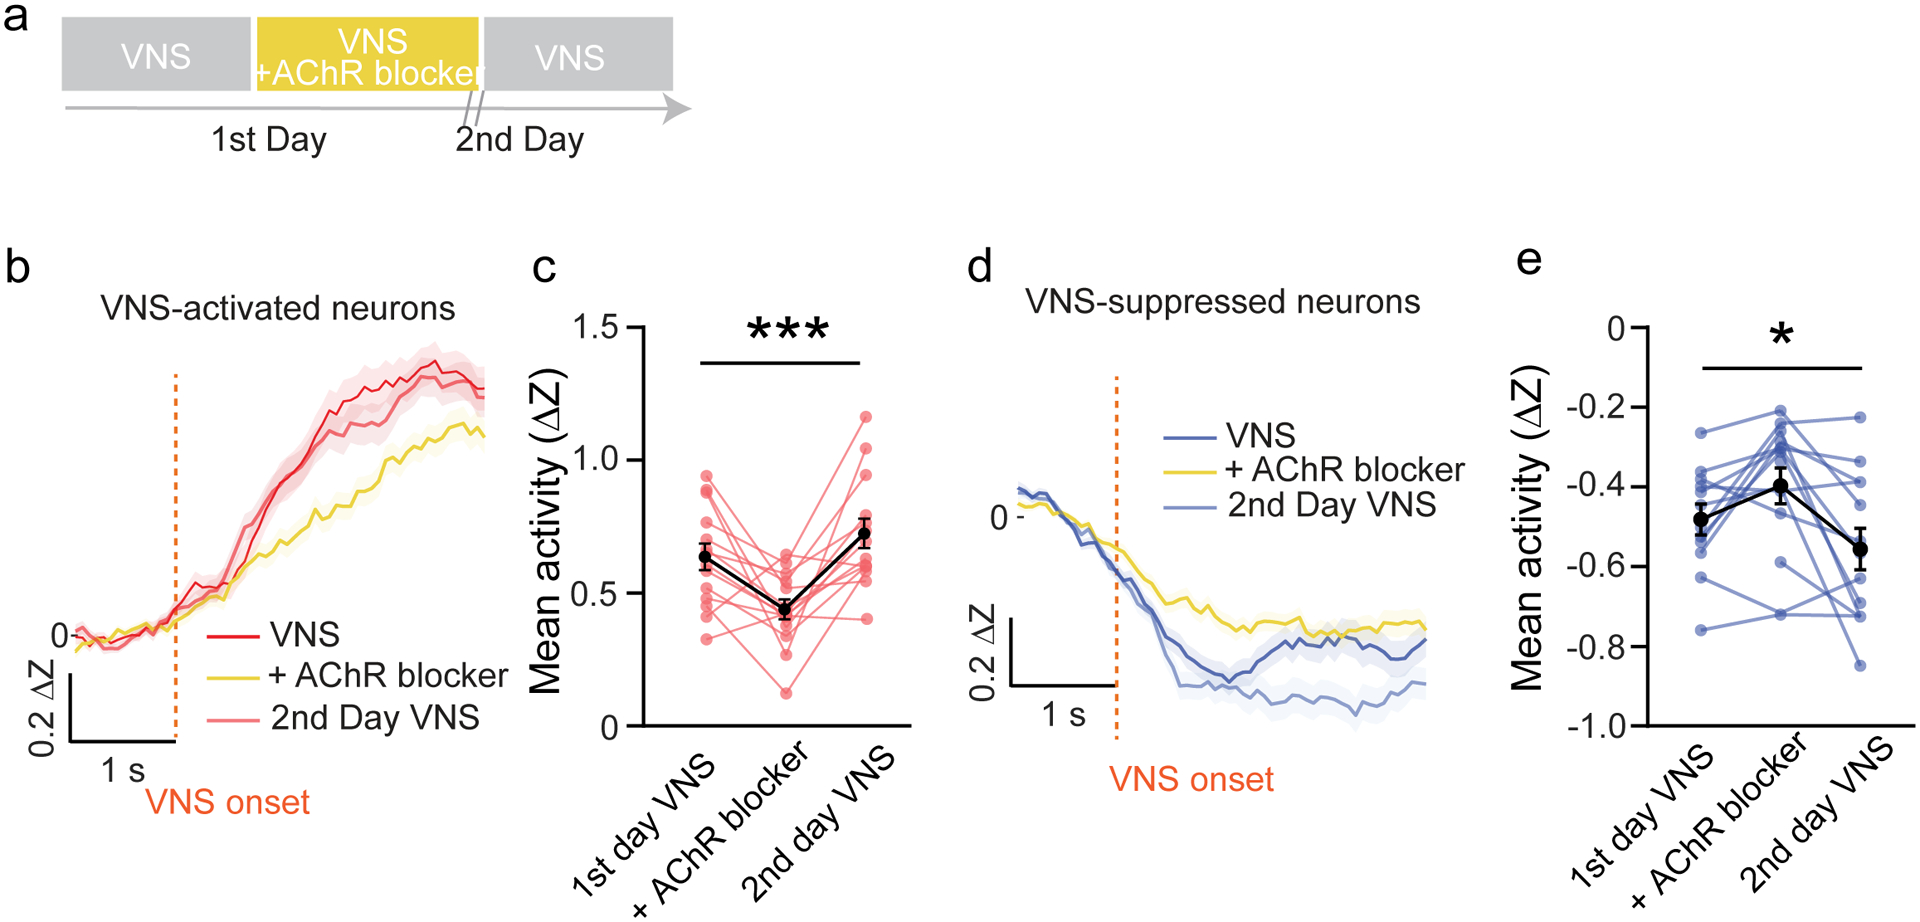
a, Diagram of experimental design. b&d, Average neural activity of VNS-activated neurons (b, n = 104 ~116 neurons) or VNS-suppressed neurons (d, n = 124~143 neurons) in control VNS session, VNS session with AChR blocker and the 2nd day recovery VNS session. c, Average neural activity comparison of VNS-activated neurons quantified from 0.8 to 2.8 s after VNS onset (See Methods, N = 7 mice × two repeats each mouse, Repeated measures ANOVA, p < 0.001). e, Average neural activities comparison of VNS suppressed-neurons quantified from 0.2 to 1.6 s from VNS onset (N = 7 mice × two repeats each mouse, Repeated measures ANOVA, p = 0.02).
Discussion
Vagus nerve stimulation paired with rehabilitation is proposed as a therapeutic treatment for a wide range of neurologic conditions, yet the mechanism by which VNS may alter neuronal activity to influence behavior remains relatively unexplored. In this study, we establish that VNS enhances motor learning when paired with successful reach attempts, suggesting a reinforcement learning mechanism. Optogenetic inhibition of cholinergic neurons in the basal forebrain is sufficient to eliminate both the enhanced motor learning and the reach trajectory consolidation, consistent with a role for cholinergic signaling in VNS-driven learning. Calcium imaging of neurons in M1 shows that VNS selectively modulates neurons that represent reach outcome, and the effects of VNS on M1 neural activity depend on cholinergic signaling. Together, these results demonstrate that VNS accelerates motor learning through cholinergic reinforcement, mediated by selective modulation of motor cortical outcome representation.
VNS paired with reach success optimally enhances motor learning
To our knowledge, we are the first to demonstrate the importance of pairing VNS to movement outcome to enhance motor learning. We find that VNS paired with a successful reach, but not reach initiation, enhances motor learning, indicating a role for VNS in reinforcement signaling. Endogenous activity of the vagal nerve has been linked to reward and motivation (Han et al., 2018), and VNS in human subjects drives motivation towards reward (Neuser et al., 2020) and improves reinforcement learning (Weber et al., 2021). However, VNS does not seem to activate the classical dopaminergic reward pathway (Wickens et al., 2003), as conditioned place preference test results indicate that VNS is not inherently rewarding or aversive. Instead, VNS may augment reinforcement cues, leading to improved selection of the expert trajectory (Pekny et al., 2015; Uehara et al., 2019) and the neural ensembles that underlie those movements (Athalye et al., 2018; Oby et al., 2019; Wolpert et al., 2011). By augmenting reinforcement cues, VNS may help to select the appropriate neural circuits, strengthening those connections for lasting improvements in functional outcome.
The importance of VNS timing appears to differ among learning phases, such that VNS must be paired with reach outcome during early learning, but there is more flexibility in the timing of VNS pairing during the rehearsal of a known task. How might success-paired VNS contribute to early skilled motor learning? Motor learning travels along an exploration-exploitation axis, with early exploration, expressed as motor variability, reducing as the motor behavior consolidates onto an expert solution (Aronov et al., 2008; Dhawale et al., 2017; Garst-Orozco et al., 2014), and predicting improved later performance of the expert motor solution (Athalye et al., 2017; Uehara et al., 2019; Wu et al., 2014). This is generally thought to reflect error-driven learning, in which increased exploration allows for faster identification of the expert solution. Reinforcement processes also shape motor learning, where increased reward frequency increases consolidation of movement trajectory onto an optimal motor solution (Dhawale et al., 2019, 2017; Pekny et al., 2015). Our results show that paired VNS does not increase variability in early learning, but instead improves kinematic consolidation onto an expert reach. This leads us to believe that in this context, VNS acts via reinforcement-driven learning to increase the exploitation of the expert solution, without increasing early motor variability. Future experiments are needed to explore if VNS can reinforce movements without association to a food reward.
Improved kinematic consistency has been shown to correlate with consistency of neural activity in motor cortex (Cao et al., 2015; Churchland et al., 2012; Peters et al., 2014). Selection of neuronal activity patterns can result from sensory-error learning (Scott, 2016), neural reinforcement (Athalye et al., 2020) or from unsupervised learning processes (Doya, 1999; Makino et al., 2016). We hypothesize that VNS-modified outcome signals lead to more consistent patterns of neural activity in motor cortex, producing more consistent reach behavior (Athalye et al., 2017; Chen et al., 2015; Mawase et al., 2017). Alternatively, VNS could influence subcortical motor structures, such as basal ganglia or cerebellum, leading to altered thalamocortical input to cortex. To explore this further, future work will examine the possible role of VNS on thalamic motor activity.
Success VNS could bias neural activity to set an appropriate initial state for re-entrance into the neural patterns that lead to a successful reach (Athalye et al., 2020; Levy et al., 2020). More consistent re-entry into these patterns can drive long-term plasticity toward reactivation of these patterns, resulting in improved learning. In this scenario, we predict that reaches following Success VNS would be more likely to be successful. However, this is not consistent with Fig. 2b, where we find the same success rate for reaches before or after Success VNS. Further analysis of the dynamics of neural populations in motor cortex could determine if VNS does modify the initial conditions prior to a reach.
Another option is that VNS may act to enhance sensory-error motor learning, where incoming sensory cues are compared to an internal model of expected sensory information (Scott, 2016) and used to refine neural encoding of the reach. In this case, Reach VNS should be as effective as Success VNS to enhance learning. In our data, Reach VNS does not enhance overall learning rates (Fig. 1i). However, trial-by-trial analysis of the data shows that Reach VNS improves the success of reaches that follow VNS compared to those reaches without VNS (Fig. 2f–i). This effect strengthens over learning and is present during the rehearsal of a known task (Fig. 2k). This suggests that VNS may play a role in sensory-error learning, particularly during late learning refinement or rehearsal.
VNS-driven motor learning is mediated by cholinergic signaling
VNS activates multiple neuromodulatory systems in the central nervous system (Farrand et al., 2017; Hulsey et al., 2019; Perez et al., 2014) including the locus coeruleus, raphe nucleus and the cholinergic BF (Hulsey et al., 2019, 2016). While each of these neuromodulators play a role in learning, cholinergic neuromodulatory systems are critical for use-dependent plasticity (Jiang et al., 2016; Kang et al., 2014; Ramanathan et al., 2009; Sawaki et al., 2002; Shinoe et al., 2005). They are closely associated with reinforcement signaling (Guo et al., 2019; Hangya et al., 2015), encode task outcome (Lin and Nicolelis, 2008; Zhang et al., 2019) and link learned neural activity to temporally-delayed outcomes (Tu et al., 2022). Lesion (Conner et al., 2010, 2003) or pharmacological inhibition (Puzerey et al., 2018) of cholinergic neurons is detrimental to motor learning and VNS-enhanced motor rehabilitation (Meyers et al., 2019). Early motor learning depends on elevated cholinergic signaling (Ren et al., 2022), consistent with the unique role for cholinergic-mediated VNS enhancement during early learning. We find that a brief cholinergic inhibition is sufficient to prevent VNS-driven enhancement in motor learning. This suggests that the effects of Success VNS are mediated through phasic cholinergic signaling in the BF.
Only limited evidence exists demonstrating an anatomical or functional connection between the vagus nerve and the cholinergic BF (Détári et al., 1983). We were able to demonstrate robust functional connectivity between the BF and the vagus nerve. Stimulation of the vagus nerve elicited robust responses in nearly half of the cholinergic and non-cholinergic units recorded under anesthesia and more than 40% of the units recorded in awake animals. The variable timing of BF neuronal responses to VNS suggests the involvement of a multi-synaptic pathway, possibly through the locus coeruleus (LC), which is known to send direct projections to the BF (Schwarz and Luo, 2015; Smiley et al., 1999; Zaborszky et al., 2004) and is activated by VNS(Groves et al., 2005; Hulsey et al., 2017).
Motor cortical neurons are modulated by VNS via cholinergic activity
Neurons in the primary motor cortex represent movement preparation and execution for dexterous movements (Guo et al., 2015; Lemon, 2008; Whishaw et al., 1986). During motor learning, these neural representations are updated to improve motor output (Adler et al., 2019; Biane et al., 2019; Peters et al., 2014) by incorporating feedback from error and reinforcement signals generated throughout multiple regions of the central nervous system (Heffley et al., 2018; Hosp et al., 2011; Luft and Schwarz, 2009; Wolpert et al., 2011). Recent work demonstrated that, in addition to movement preparation and execution, M1 pyramidal neurons also report movement outcome (Levy et al., 2020). Our data demonstrate that Success VNS attenuates the population representation of a success outcome by selectively modulating the temporal dynamics of success-outcome responsive neurons. This neural population is more likely to have altered representation of movement preparation and reach execution, suggesting that VNS modulates neural activity beyond the acute response to stimulation. The specificity of the population of neurons that are modulated by Success VNS may indicate that VNS adds selectivity to outcome representation, which optimizes outcome signals for enhanced learning.
The selectivity of the effects of Success VNS on movement representation are somewhat in contrast to recent observations of widespread, long-lasting excitatory responses to VNS (Collins et al., 2021). However, in the previous study, VNS elicited locomotion and whisking, both of which correlate to increased general arousal and widespread cortical activation (Eggermann et al., 2014; Musall et al., 2019; Reimer et al., 2016). This makes it difficult to disentangle direct VNS effects from changes in arousal. In contrast, another recent work demonstrated a VNS-driven suppression of neural response to an auditory tone that persisted even after arousal state was regressed from the neural response (Lai and David, 2021). Our trial design controls for movement state, and VNS did not produce any noticeable acute motor response. By eliminating the confound of behavioral states such as locomotion or quiet resting, we can detect that VNS produces an initial suppression of the outcome response followed by excitation. This acute effect is seen only in neurons that respond to outcome, indicating that when applied during a reach, VNS quickly acts on a specific population of neurons that are already engaged in the representation of reach outcome. Further analysis of neural activity patterns over the course of learning may help to understand if altered temporal dynamics of outcome-related neurons influence patterns of neural activity during reach learning.
Optimizing VNS to treat neurological conditions
An improved understanding of the mechanisms of VNS is important to best utilize the therapy to treat a range of neurological conditions. For example, pairing VNS with success criterion in rehabilitative tasks may improve outcomes. In addition, our results point to a concern that improperly paired VNS could lead to maladaptive plasticity, suggesting a potential for harm. Understanding how VNS interacts with neural circuits, may identify new targets for stimulation. For instance, models that can predict how stimulation protocols will engage specific vagal fiber types (Chang et al., 2020; Pelot et al., 2017; Settell et al., 2020), could be used to test differential target engagement in the brain. Alternatively, direct brain stimulation of targets, such as the basal forebrain, could be used to provide more specific neuromodulation to achieve key therapeutic results. Lastly, less invasive techniques, such as auricular VNS might still be able to convey therapeutic benefits if their stimulation protocols and target activation within the central nervous system is optimized (Redgrave et al., 2018; Wu et al., 2020). The data presented here provide a framework for dissecting the role of VNS within specific therapeutic indications, with the ultimate goal of improving therapeutic delivery and patient outcomes.
Conclusion
In conclusion, we demonstrated that VNS augments reinforcement cues to enhance skilled motor learning and accelerate kinematic consolidation on an optimal motor plan in healthy animals. VNS alters neural coding of outcome in a select neural population in motor cortex and modulates neuronal activity of this population across the entire reach. The behavioral, kinematic, and motor representation effects of VNS are mediated by phasic cholinergic activity. Understanding the behavioral and circuit mechanisms of VNS allows for future optimization of rehabilitation protocols and new avenues for the use of cholinergic manipulation to treat neurologic conditions.
STAR Methods
Lead Contact:
Further information and requests for resources and reagents should be directed to and will be fulfilled by the lead contact, Cristin G Welle, cristin.welle@cuanschutz.edu
Materials Availability:
This study did not generate new unique reagents or mouse lines.
Data and Code Availability:
All original code has been deposited at GitHub and is publicly available as of the date of publication. Links are listed in the key resources table. Any additional information required to reanalyze the data reported in this paper is available from the lead contact upon request.
Animal care
All animal procedures and experiments were performed in accordance with protocols approved by the Institutional Animal Care and Use Committee at the University of Colorado Anschutz Medical Campus. Male and female adult C57BL/6 wild-type mice between the age of 2 and 10 months old were used for all experiments unless otherwise noted. Mice were group-housed before surgery and single-housed following surgery and throughout behavior training. Mice were kept on 14 hr light/10 hr dark schedule with ad libitum access to food and water with exception from behavior-related food restriction (Forelimb Reach training).
Surgery
Vagus nerve stimulating cuff implantations
Commercial cuffs from Micro-leads (150um cuffs) and Cortec (100 um microsling cuffs), soldered to gold pins or Plastics1 connectors, were implanted on the cervical vagus nerve(Mughrabi et al., 2021). Mice were anesthetized with 4.5% isoflurane anesthesia for induction and maintained with 1.5%. 1% injectable lidocaine was used locally at incision sites. Eye ointment was applied to the eye to prevent corneal drying. Temperature was regulated at 37°C with a thermostat-controlled heating pad. The vagus nerve was accessed with an incision in the ventral cervical region, and the nerve was bluntly dissected from the carotid sheath. The cuff was tunneled subcutaneously to the ventral cervical incision from an incision at the base of the dorsal skull. The vagus nerve was placed in the cuff. The ventral cervical incision was sutured using 6–0 absorbable sutures. The dorsal skull was cleaned using saline and ethanol, and electrical connectors were fixed to the skull using dental cement (C&B Metabond). GLUture (WPI) was used to seal the skin around the dental cemented headcap. Stimulation efficacy was measured using peripheral biomarkers such as breathing rate changes and heart rate reduction(Mughrabi et al., 2021) on the day of surgery and weekly until the end of experiments with a paw sensor (Mouse Stat Jr., Kent Scientific). Mice received sub-cutaneous lactated ringers (~100 μL as necessary), intramuscular gentamicin (3 mg/kg), and intraperitoneal meloxicam (5 mg/kg) following surgery and as needed in cases of dehydration, infection, or pain. Mice were monitored for 7days to ensure proper recovery from surgery before any subsequent experiments were conducted.
Viral injections and optical fiber implantation
All surgeries were performed on mice expressing Cre recombinase driven by the ChAT promoter (ChAT-IRES-Cre, Jackson Labs stock #0064100(Rossi et al., 2011)). Animals were prepared for surgery as described above, and the hair was removed prior to an incision over the dorsal skull. 200 μm diameter fiber optics with 1 cm ceramic cannulas were fabricated in-house using ONECore facilities. The skull at the dorsal incision was cleaned using sterile saline and ethanol. Two craniotomies were opened above the basal forebrain in each hemisphere (0.35 mm posterior, ±1.6 mm lateral of bregma) using a dental drill. Glass pipettes containing a floxed inhibitory archaerhodopsin (AAV-EF1a-DIO-eArch3.0-EYFP, UNC) or yellow fluorescent protein (YFP) control (AAV-EF1a-DIO-EYFP-WPRE-pA, UNC) were then inserted bilaterally into the basal forebrain using a stereotaxic device (−4.75 mm from dorsal surface of the brain). Approx. 210 nL of viral construct was injected over 5 minutes. The pipettes were removed and 200 μm fiber optic cannulas were inserted above each injection site (−4.65 mm from the dorsal surface of the brain). The craniotomies were then sealed using a surgical silicone (Kwik-Sil). The cannulas were fixed to the skull using dental cement (C&B Metabond). GLUture was used to seal the skin around the headcap. Mice received intramuscular gentamicin (3 mg/kg), and intraperitoneal meloxicam (5 mg/kg) following surgery and as needed in cases of infection, or pain. Mice were monitored for 7 days to ensure proper recovery. After 14 days, mice underwent VNS implantation described above (see vagus nerve stimulating cuff implantations).
Electrode implantation
Chronic tetrodes:
Custom twisted wire tetrodes, built in-house, were implanted into the left basal forebrain of mice. Surgical preparation was as described above. Two craniotomies were opened using a dental drill: one above the left basal forebrain (0.35 mm posterior, 1.6 mm lateral of bregma) and one above the cerebellum (~1 mm posterior of lambda, midline). A tetrode was then inserted into the basal forebrain craniotomy using a stereotaxic device (−4.75 mm from the dorsal surface of the brain). A gold ground pin was inserted into the second craniotomy. Both craniotomies were sealed with surgical silicone (Kwik-Sil) and the tetrode was fixed to the skull using dental cement (C&B Metabond). GLUture was used to seal the skin around the dental cemented headcap. Mice received intramuscular gentamicin (3 mg/kg), and intra-peritoneal meloxicam (5 mg/kg) following surgery and as needed in cases of infection, or pain. Mice were monitored for 7 days to ensure proper recovery after which they underwent VNS implantation described above (see vagus nerve stimulating cuff implantations).
Acute Optrodes:
Vagus nerve cuffs were implanted in transgenic mice expressing channelrhodopsin2 in cholinergic neurons (ChAT-ChR2(Zhao et al., 2011)) using the protocol described above (see vagus nerve stimulating cuff implantations). After cuff implantation, while mice were still under anesthesia (1.5% isoflurane), mice were moved to a stereotaxic apparatus and a cranial window (2.5×2.5 mm) was opened above the left BF (0.35 mm posterior, 1.6 mm lateral of bregma). The stereotaxic apparatus was placed in a Faraday cage and single shank Optrodes from Neuronexus (A1×32-Edge-10mm-20–177-OA32LP) were inserted into the BF (−4.75 mm from the dorsal surface of the brain). Extracellular recordings were then performed while mice then underwent VNS (see BF response to VNS) and opto-tagging (see opto-tagging) protocols. Mice were sacrificed at the end of the experiment and the cuff and optrode were recovered.
Cranial window surgery for miniscope objective lens and baseplate installation
Mice were anesthetized with isoflurane and maintained similarly as described above until skull was exposed. A round cranial window (~1.8 mm diameter, ML 1.5 mm, AP 0.3 mm for center) was made above M1 contralateral to the reaching paw using a dental drill. A viral vector (AAV1.Syn.GCaMP6m.WPRE.SV40) was infused at 2×10¹² titer to 200 ~300 μm beneath brain surface at 3~4 sites in the cranial window around the center, with ~200 nL at each site. Objective grin lenses (Edmund Optics, #64520, 1.8 mm, 0.23 mm WD) were lowered through the cranial window and pressed against the brain surface. The lens’ side was sealed by surgical silicone (Kwik-Sil) and secured by dental cement. The exposed part of the lens above the skull was further coated with black nail polish. 3~4 weeks later, a metal baseplate was mounted to the skull over the lens with Loctite glue (Loctite 454 prism), guided by a miniscope for optimal field of view while the mice were anesthetized with isoflurane (1.5%). After the baseplate was securely mounted, the miniscope was taken off, a cap was attached to the baseplate and the mouse was returned to the home cage.
Muscimol cannula surgery and infusion
Using the same craniotomy surgery procedure described above, a round cranial window (~1.8 mm diameter, ML 1.5 mm, AP 0.3 mm for center) was made above the contralateral M1 and a plastic cannula (2~3 mm long pipet tip) was inserted into the window right above the brain surface. Then the pipet tip was secured by Kwik-Sil and dental cement. The top of the cannula was sealed with Kwik-Sil if the mouse was not undergoing behavior tests within a couple of hours. Before behavior tests, the mice were briefly anesthetized with isofluorane, the seal was removed and 1~2 μL of muscimol at a concentration of 1 mg/mL was infused into the pipet tip.
Behavior
Manual training of skilled forelimb reach task
Mice were trained and scored on a skilled reach task(Whishaw et al., 2008). Mice were food restricted and maintained at 85–90% of their free feeding weight throughout training. Following food restriction, mice were habituated to the training box for 20 minutes where mice were given 20 mg food pellets (BIO-serv) near the window of the box where reaching occurs. The training box is a custom-built plexiglass box with a 1 cm wide opening that provides access to a post with a divot to hold a pellet located approximately 1 cm away, with a left offset from the center of the opening to force right forepaw reaching. Learning sessions then occurred for 14 consecutive days where mice perform a reach to grasp task with the right forepaw for food pellets. Rehearsal sessions occurred 7–10 days after training and featured stimulated and unstimulated trials. For both training and rehearsal sessions, mice were scored on a per trial basis until 20 successful attempts or 20 minutes passed. A trial terminates in a success, or the pellet being knocked off the pellet holder by the mouse. Trial outcomes were recorded by the trainer in real time. A success was defined by when the mouse grabbed the pellet and returned it into the cage. Errors were subcategorized into: “reach error” (failure to correctly target), “grasp error” (failure to grasp the pellet), and “retrieval error” (successful grasp of pellet, but failure to return it into the box).
VNS experiment groups
Experiment groups for training were based on stimulation protocols. Mice were assigned into experiment groups in cohorts of 4–8 mice at a time interleaved to achieve a similar number of mice per group. Investigators were not blinded to mice designations. To ensure that each VNS group received a similar number of stimulation pulses, we first ran a cohort of Success VNS animals, and calculated the average number of stimulation pulses for each day of training (equivalent to the number of successful reaches per day). We used this calibration value to titrate the stimulation number for the Reach VNS and Random VNS groups. Average stimulation pulses are similar between groups, with some variability due to small subset of initial measurements (Supp. Fig 1a–c). Sham VNS cohort were implanted with a cuff but were not stimulated at any point during learning. Success VNS were manually stimulated following every successful trial -- days 7 and 14 featured designated blocks without stimulation to track baseline learning levels versus trial-to-trial performance. Random VNS received stimulation at random intervals as generated by an Arduino board to achieve between 15–20 stimulations per day, matching stimulation rates to other groups. Reach VNS received manual stimulation prior to movement onset on a pseudo-random 50% subset of trials to normalize VNS trains delivered. Reach VNS occurred rapidly (0.003±0.263s) after Reach Initiation, defined as when the paw exits the behavior box (Supp. Fig. 1d). All groups were trained on the forelimb reach task for 14 days. For performance measurements in animals trained without VNS (Fig. 2 k–n), Reach VNS and Success VNS were applied during daily behavioral sessions. All animals received both Reach and Success VNS sessions on different days, with randomized order of session assignments across animals.
CLARA skilled reach training and behavior data acquisition
Mice were food restricted and habituated identically to manually trained animals. Dimensions of the behavior box were also identical in manual and CLARA cohorts. Behavior box used for miniscope recording was modified so that the front panel had an alcove above the height of the mouse head to accommodate the miniscope when the mouse was close to the slit to reach. On day 1, the mice were primed to have one success before CLARA training session started. Learning sessions then occurred for 14 consecutive days (or specified otherwise in results), where mice perform a reach to grasp task with the right forepaw for food pellets. Each trial started as the automated dispenser placing a food pellet on the post, as the mouse reached to successfully retrieve it or knocked it off, the CLARA would mark success or failure as the trial outcome as the end of this trial. Each session lasted for 20 minutes, and mice were scored on a per attempt basis. Using the CLARA behavior system, high speed (150 Hz) video data was recorded from three FLIR Blackfly® S (model BFS-U3–16S2M-CS, Edmund Optics) cameras placed in front of the box, lateral to the box, and at a 45° angle above the box from the opposite side from the lateral camera (Fig. 6a). A neural network was trained prior to experiment sessions using manually annotated frames of the skilled reach behavior labeling the hand center and the pellet. Video frames from all cameras were sent through this network in real time to identify the location and state of the hand and pellet. This information was used to initiate trials via pellet placement, and to categorize attempt outcomes as either success or failure so that stimulation could be delivered in a closed-loop manner (for additional details, see(Bowles et al., 2021)). The timing of pellet placement, success or failure outcome, VNS delivery, and optogenetic light delivery was recorded through CLARA. In the miniscope cohort, the timing of miniscope neural recording was cross registered with behavior video frames through a CLARA-controlled Arduino board.
Optogenetic+VNS experiment groups
Experiment groups for training were based on stimulation type. The control cohort was injected with a floxed YFP construct that did not contain an opsin and received light stimulation (see light stimulation parameters), the Success VNS cohort was electrically stimulated (see VNS stimulation parameters), and the Arch+VNS cohort received both light and electrical stimulation. All groups received stimulation following every successful trial automatically through the CLARA system.
Miniscope groups
Mice wore miniscopes for 5~10 minutes a few times in their home cages or the CLARA training box to habituate the weight. When recording VNS response in home cage, mice wearing miniscopes and VNS wires were put in home cage. About 4 minutes spontaneous neural activity were recorded as mice freely moved in the home cage, then 30~40 VNS were delivered every 20~30 s. Afterward, another ~4 minutes spontaneous activity was recorded. In sessions with AChR antagonists, scopolamine (1 mg/kg body weight) and mecamylamine (10 mg/kg body weight) were dissolved in saline and delivered to mice through intraperitoneal (IP) injection. The concentration of scopolamine and mecamylamine cocktail was chosen to have effects in brain circuits related to memory and learning without debilitating effects, according to previous studies(Riekkinen et al., 1993, 1990). 15 minutes after cocktail administration, the neural response was recorded during a home cage session.
For reach training recordings, food restricted mice were mounted with a miniscope and VNS wires and put in the training box to start a CLARA training session. The minisope acquisition was turned on immediately as the CLARA training session started and each frame of the video was cross registered with the CLARA video frames. All mice were primed without VNS to have one success reach before the first session started. On the first day, VNS mice participated in one 20-minute Success VNS session. From day 2 to day 4, each VNS mouse participated in two sessions of training, with one of them being a Success VNS session and the other a no-stimulation session in which VNS was not delivered, which was given on a pseudorandomized schedule (Fig. 7d). Control mice also received two training sessions without VNS each day. On days when mice receive two sessions of training, the two sessions are 1~3 hours apart.
Place preference test
We used a standard conditioned place preference test to examine if VNS is rewarding or aversive. The behavior apparatus contained two compartments separated by a gate. Mice were tested for baseline preference in an initial 20-minute session where mice can freely navigate between compartments. Mice then were trained for three days with two 20-minute sessions each day where they received stimulation in only one compartment. Stimulation was delivered pseudo-randomly approximately once per minute. On the day of testing, no stimulation was given, and mice were allowed to freely navigate between compartments to see which compartment they spent more time in(Prus et al., 2009). The amount of time spent in each compartment was compared between the baseline and testing day. Experiments were conducted with assistance from CU Anschutz Behavior Core.
Stimulation parameters
VNS stimulation parameters
For all VNS experiment groups, VNS was delivered as a 500 ms train of 15 pulses, with 100 μs phase duration at 30 Hz. Current amplitudes were 0.4–0.6 mA. Stimulation parameters were controlled and delivered using Master8, PulsePal, or a CLARA+Arduino system, which were connected to a stimulation isolation unit (A-M Systems, Model 2200 Analog Stimulus Isolator) to control amperage.
Light inhibition parameters
For all light stimulated groups, 561 nm light was delivered continuously for 500 ms. Light was delivered through a 200 nm fiber-optic cable from a Class IIIb diode pumped solid-state laser (Cobalt) at 0.5 mW (calculated based on output efficiency from the bottom of the optical fiber). Stimulation parameters were controlled and delivered using a PulsePal, or a CLARA+Arduino system connected directly to the laser.
Behavior and kinematic analysis
Manual behavior analysis
A success percentage was generated for each session of each animal by determining the number of trials that resulted in a successful retrieval out of all trials initiated. Success percentages were compared between stimulation groups across all days of training, as well as by early and late learning phases. Early learning phase refers to days 1–4 of training, while the late phase refers to days 5–14, which were defined using a Weibull growth curve (See quantification and statistical analysis). On days where animals received blocks of stimulation, such as rehearsal groups, stimulated and unstimulated trials were compared on a per mouse basis within days. To determine a trial-level effect for the Success VNS group, we divided all trials to three categories, pre-success trials that occur immediately before each success trial, success trials and post-success trials that occur immediately after each success trial. We then compared the success rate between pre-success and post-success trials.
Behavior curator analysis
Videos acquired during CLARA training sessions were processed by custom Python scripts overnight to extract key reach timepoints: reach initiation (ReachInit), when the hand leaves the box; reach max (ReachMax), the outward point of maximum distance from reach initiation; reach end (ReachEnd), when the hand returns to the cage; and stimulation onset (stim), when a trial received a trigger pulse for VNS or light stimulation. The stamps of reachInit, reachMax and reachEnd were further manually screened for consistency. The accuracy of CLARA trial outcome classifications were verified, and failures were subcategorized post-hoc into reach, grasp and retrieval failures (see Manual training of skilled forelimb reach task for failure definitions).
Kinematic analysis
3D location of the center of the paw and pellet were tracked during reach attempts (between reach initiation and reach end). Tracking data was extracted using custom MATLAB scripts (MATLAB Simulink) and documented as 3D data arrays for kinematic analysis. Positional data for gross targeting analysis was determined by selecting the 3D location of the hand and pellet at the reach max timepoint. Points were normalized such that the pellet center was 0,0,0. Euclidean distance between the hand center and pellet center was then calculated using the norm function from MATLAB. The mean distance from the pellet was compared in early and late phases and between stimulation groups. Reach velocity was obtained by measuring the absolute velocity between reach initiation and reach end, and then averaging the velocity over that period. The mean velocity was compared in early and late phases of training and between stimulation groups.
Reach consistency and expert reach
Positional data between reachInit and reachEnd were normalized such that the pellet center was 0,0,0. Reach trajectory was defined as the time between reach initiation and reach end. Each trajectory was then temporally warped to be the same arbitrary ‘length’ of time using dynamic time warping(Li et al., 2017). An expert trajectory was constructed for each mouse by averaging the trajectories of all successful reach attempts made on each mouse’s last two days of training. Reach consistency was determined through comparison of reach trajectories to each mouse’s expert trajectory. Reach trajectories were compared to the expert trajectory through a correlation coefficient to obtain the mean correlation coefficient for each mouse in each training session. Additionally, any individual reach that had a correlation of 0.95 or higher with the expert trajectory was defined as an ‘expert reach’, and the percent of expert reaches were also recorded for each day. The number of expert reaches and mean correlation coefficients were then compared between VNS, Arch+VNS and control groups in early and late phases.
Feature consistency
Several reach features were extracted from each reach attempt: start location (X, Y, Z), end location (X, Y, Z), mean absolute velocity, max absolute velocity, pathlength (length of full trajectory), and reach consistency (defined above in reach consistency and expert reach). The distribution of each feature was calculated for the early and late learning phases based on the stimulation group. The distribution of each early-late pair was normalized using the interquartile range of the early phase distribution. The normalized late interquartile range was subtracted from the normalized early range and the difference was defined as ‘delta feature consistency’. A positive delta means that the distribution was more constrained during the late phase compared to the early phase.
Electrophysiology recording and analysis
VNS electrophysiological recording in BF
While mice were either under maintained anesthesia (1.5% isoflurane), or awake in a home cage, VNS was repeatedly delivered while recording from the left basal forebrain (see optrode implantation). No behavioral task was performed during recording. Mice received several (10–20) trains of VNS (0.5 s, 30 Hz, 100 μs pulse-width, 0.6 mA), delivered approximately 90 s apart. Data was recorded with Cheetah acquisition software at 30 kHz using a Digital Lynx SX (Neuralynx). TTL pulses were sent from the Master-8 (A.M.P.I.) to the Digital Lynx SX for each pulse of a light or electric stimulation train. In acute experiments, mice were opto-tagged after all VNS trains were delivered to identify cholinergic units.
Opto-tagging protocol
While mice were under maintained anesthesia (1.5% isoflurane), recordings were performed in the left BF (see optrode implantation). Light was delivered using a class IIIb diode pumped solid state laser (Cobalt) attached to the optrode through a ceramic ferule. Opto-tagging stimulus consisted of several (10–20) trains of 5 mW, 488 nm light delivered just above the BF through a 105 μm diameter fiber optic spaced ~30 s apart. Trains consisted of 10 pulses of light at 20 Hz with a 10 ms pulse duration.
Neural classification of BF response
After recording, units were clustered manually using clustering software SpikeSort 3D (Neuralynx) and imported into MATLAB. Isolation distance and L-ratio were used to quantify cluster quality and noise contamination(Schmitzer-Torbert et al., 2005). The start of each stimulation train was identified post-hoc using custom scripts (Mathworks) and defined as a trial. The trial window, referred to as the ‘VNS stimulation window,’ was defined as: 1 s baseline before stimulation (−1 to 0 s), VNS delivery (0 to 0.5 s), and 1 s after the end of VNS (0.5 to 1.5 s). Firing rate during the trial window was calculated using a 100 ms moving average, shifted by 1 ms from the start of the trial window to 100 ms after the end of the trial window. Baseline firing rate was defined as the mean firing rate during the baseline period (−1 to 0 s). Units were screened, and any unit with a mean firing rate below 0.5 Hz in anesthetized recordings or below 1 Hz in awake recordings were removed from the pool. ±1 ms around each stimulation pulse was removed to account for electrical noise. Firing rate was converted into a Z-score normalized to the mean firing rate and standard deviation of baseline activity. If a unit’s normalized firing rate was ±2.56 s.d. from the baseline firing rate for >100 ms during VNS delivery (0 to 0.5 s), the unit was defined as VNS responsive. If the change in firing rate was 2.56 s.d. above baseline it was further subclassified as Activated, and if it was 2.56 s.d. below baseline, it was subclassified as Suppressed. A unit that met both criteria was classified based on which occurred first. Peak response, peak delay and response duration were compared between cholinergic and non-cholinergic units in anesthetized mice, and units recorded in awake mice. Peak response refers to the maximum normalized firing rate of VNS activated units after stimulation onset (0 to 1.5 s). Peak response delay refers to the amount of time, in ms, from train onset (0 s) to peak response. Duration refers to the total amount of time that a VNS activated unit had normalized activity <2.56 s.d. above baseline after stimulation onset (0 to 1.5s).
Neural classification of opto-tagging in BF
After recording, units were clustered manually using clustering software SpikeSort 3D (Neuralynx). Each pulse was identified post-hoc using custom MATLAB scripts (Mathworks) and defined as a trial. Tagged units were identified using a stimulus-associated latency test (SALT(Hangya et al., 2015)). This test compares the distribution of onset time of the first spike recorded during light delivery trials (10 ms) to the onset time of spikes during control windows of similar length (10 ms). Units whose p-value from the SALT test was <0.05 were defined as cholinergic, all other units were defined as non-cholinergic. Firing rates of cholinergic and non-cholinergic units were calculated using the baseline firing rate of the unit from the VNS session.
Calcium imaging and analysis
Data acquisition
Miniscope components and DAQ board were purchased and assembled by Optogenetics and Neural Engineering (ONE) Core according to UCLA miniscope (http://miniscope.org/) V3 guidelines. The objective GRIN lens used were Edmund optics #64–520 and achromatic lens were #45–407. Images were acquired at 30 Hz with Miniscope Control data acquisition package (affiliated with UCLA miniscope). Each imaging session was 15~20 minutes. The calcium signal images were saved as TIFF stacks through USB3.0 port to an SSD hard drive to reduce frame drops. For some home cage sessions, the mice behavior was recorded simultaneously by a LG webcam controlled by MiniscopeControl. For CLARA reach training sessions, behaviors were recorded by the CLARA system and the timing of miniscope frames and behavior camera frames were coordinated.
Imaging analysis
Neural signal preprocessing
Image stacks that were acquired through the miniscope were motion corrected using MATLAB-based NoRMCorre packages(Pnevmatikakis and Giovannucci, 2017) (https://github.com/flatironinstitute/NoRMCorre). For most sessions, the rigid motion correction module was sufficient to yield good results; in sessions with non-even shifting of the field of view, the non-rigid motion correction module was used. After motion correction, the field of view was cropped and spatially down sampled 4x to reduce the file size for subsequent neural signal extraction. Neural signals were extracted from the images using the MATLAB-based CNMF-E package(Zhou et al., 2018) (https://github.com/zhoupc/CNMF_E). The results were manually curated to discard non-neuronal ROIs. The resulting C-raw matrix, which was a scaled dF × ROIs, was used for further analysis. For individual ROIs, the time series dF of the whole session was further organized as a 2D matrix dF per trial × trials.
Neural classification
To identify VNS responsive neurons, each trial epoch (± 10s around VNS) was mean z-scored to the 3 seconds prior to VNS. Noise response was estimated by calculating average Z-scored dF for individual neurons using a randomly shuffled VNS onset times in the same session (excluding the 3 s window after each VNS onset in the whole session), and bootstrapping across 1000 repeats. For an individual neuron, if the real maximum averaged Z-scored dF in the 3 s window after VNS is higher than the 95% value of the bootstrapped histogram, the neuron was defined as activated by VNS; if the real minimum averaged Z-scored dF in the 3 s window after VNS is lower than the 95% value of randomized z-scored dF, the neuron was defined as suppressed by VNS.
To measure the onset or peak timing for the VNS response, VNS responsive neurons’ dF were Z-scaled with the whole session baseline mean calculated from time points lacking Ca2+ activity(Jimenez et al., 2018) (defined as time points with fluorescence values less than the 0.50 quantile of all fluorescence values). This general-based Z-score process allows dF level above or below 0 before VNS onset each trial and keeps the average dynamics of VNS response more accurately. For individual VNS-activated neurons, the onset of VNS activation was defined as the first time point when the Z-scored dF value reached above 2 s.d. of the mean baseline (the 3 seconds before VNS onset) in the 5 s after VNS onset. For individual VNS suppressed neurons, the onset of VNS suppression was the first time point when the Z-scored dF value reached below 2 s.d. of the mean baseline (the 3 seconds before VNS onset) in the 5 s after VNS onset.
To identify reach-task responsive neurons, a similar trial-based Z-score processes where employed. Trial dFs were aligned by reach max. The baseline was taken as −6 to −3 s before the time of reach max. The response of individual neurons to the task was measured as the maximum and minimum values of the average Z-scored dF in the −800 to −300 ms (reach preparation), −300 to 200 ms (reach), 200 to 1700 ms (outcome), in reference to reach max as time 0. The cut off value for maximum or minimum dF for these time windows were estimated through a similar randomization procedure as above, in which that the same number of reach trials were randomized across the whole session 1000 times. Success trials and failure trials were analyzed separately unless noted otherwise. Several sub-groups of neurons were categorized as: preparation-activated, preparation-suppressed, reach-activated, reach-suppressed, success-activated, success-suppressed, failure-activated and failure-suppressed. Preparation and reach modulated neurons were grouped together as reach modulated neurons in Fig. 7. After neural classification, Z-score procedures were used to obtain the average success modulated neurons response to VNS and no-stimulation sessions.
Cross-registration of multiple sessions and cross session VNS modulated neurons definition
Due to computational power limits, we chose to process neural activity data from each session and register neurons across sessions. The MATLAB-based CellReg package(Sheintuch et al., 2017) (https://github.com/zivlab/CellReg) was used to identify the same neurons from multiple sessions based on spatial footprints of cellular activity (ROIs). Pairs of neurons with correlation coefficient > 0.65 were regarded as the same neurons. Not all neurons could be tracked from one session to the next due to technical limitations. Only neurons that were cross-registered across the two recording sessions were analyzed in the subsequent VNS modulation analysis.
For individual neurons, if a neuron was categorized as success-activated in one of the two training sessions, the neuron was regarded as a success-activated neuron. To look for significant modulation after VNS onset in VNS sessions of these success-activated neurons, the success outcome response of each neuron was aligned to VNS onset and measured in no-stimulation session and VNS session; the difference in response was obtained by subtracting the no-stimulation response from the VNS session response. A difference in response during the 0~3s after VNS onset that was higher or lower than 2.5 s.d. of the mean of baseline (−3 to 0 s before VNS onset) for at least 0.15 s was regarded as significant enhancement or attenuation in the VNS session. To look for significant modulation before VNS onset, the neural response was aligned to reach end. The baseline window was set from −6 to −3 s before reach end. This reach end alignment allows us to evaluate differences in neural representation of reach preparation, execution, and outcome. Differences between the reach representation were compared between the Success VNS and no-stimulation sessions. A difference in response during the −3 to 3 s around reach end that was higher or lower than 2.5 s.d. of the mean of baseline (−6 to −3 s in reference to reach end) for at least 0.15 s was regarded as significant enhancement or attenuation. The onset time of the modulation was defined as the first time point of this enhancement or attenuation.
The control, AChR antagonists, and recovery sessions were processed similarly as VNS in home cage sessions, as described above. In addition, these sessions were temporally down sampled to a 15 Hz frame rate to reduce the file size so that each mouse’s three sessions imaging data could be motion corrected and concatenated together to save the post-hoc cross registration step. For VNS-modulated neurons, the VNS activation window was empirically measured and defined as rise onset to peak timing in Fig. 6g,h (0.8 to 2.8 s after VNS onset; suppression window as 0.2 to 1.6 s after VNS onset).
Quantitation and Statistical Analysis
Statistical analyses were conducted using Graphpad, JMP (SAS), or MATLAB (MathWorks). No normality tests were performed but individual data points are plotted to visualize distribution. We used parametric statistics including paired and unpaired Student’s T-tests, and one-way ANOVA with Tukey’s HSD post-hoc tests. Two-tailed tests and an alpha cutoff of <0.05were employed unless otherwise stated. We employed a mixed model (Restricted Maximum Likelihood model (REML)) for all learning experiments. REML enables us to test how fixed effects (dependent variables) and known random effects (individual mouse, sex, age) correlate to an outcome variable.
Outcome = fixed effect + known random effect + error
Models were constructed with one or two fixed effects. In cases where there were two fixed effects, we ran full factorial models. To determine early and late phases of learning, a Weibull growth curve was applied to Sham VNS learning data. The formula was:
a = asymptote, b = inflection point, c = growth rate. The AICc = 1295.90 and the R2 = 0.21. We used the asymptote of the control cohort (55.50% ± 6.8%) to represent the plateau in success rate. The late learning phase was selected based on the first training day that exceeded the lower 95th percentile of the asymptote (42.15%), which was day 4. We thus called late learning days 5–14 and early learning days 1–4.
Supplementary Material
Acknowledgments
This work was supported by grant from DARPA Targeted Neuroplasticity Training (TNT): HR0011-17-2-0051. The Optogenetics and Neural Engineering (ONE) Core at the University of Colorado School of Medicine provided engineering support for this research. The IDEA Core provided data pipeline and software support for this research. The Animal Behavior Core provided support for conditioned place preference experiments. These cores are part of the NeuroTechnology Center, funded in part by the School of Medicine and by the National Institute of Neurological Disorders and Stroke of the National Institutes of Health under award number P30NS048154. We thank Sean Hansen for technical assistance in Matlab and manuscript proofreading; Eashan Sahai, Nicole Chen and Melanie Zhou for technical assistance in mice training and behavior video curation and Benjamin Temple for early technical assistance with optogenetic procedures.
Inclusion and Diversity Statement
We worked to ensure sex balance in the selection of non-human subjects. One or more of the authors of this paper self-identifies as an underrepresented ethnic minority in science. While citing references scientifically relevant for this work, we also actively worked to promote gender balance in our reference list.
Footnotes
Declaration of interests
The authors declare no competing interests.
References
- Adler A, Zhao R, Shin ME, Yasuda R, Gan W-B, 2019. Somatostatin-Expressing Interneurons Enable and Maintain Learning-Dependent Sequential Activation of Pyramidal Neurons. Neuron 102, 202–216.e7. 10.1016/j.neuron.2019.01.036 [DOI] [PMC free article] [PubMed] [Google Scholar]
- Aronov D, Andalman AS, Fee MS, 2008. A Specialized Forebrain Circuit for Vocal Babbling in the Juvenile Songbird. Science 320, 630–634. 10.1126/science.1155140 [DOI] [PubMed] [Google Scholar]
- Athalye VR, Carmena JM, Costa RM, 2020. Neural reinforcement: re-entering and refining neural dynamics leading to desirable outcomes. Current Opinion in Neurobiology, Neurobiology of Behavior 60, 145–154. 10.1016/j.conb.2019.11.023 [DOI] [PubMed] [Google Scholar]
- Athalye VR, Ganguly K, Costa RM, Carmena JM, 2017. Emergence of Coordinated Neural Dynamics Underlies Neuroprosthetic Learning and Skillful Control. Neuron 93, 955–970.e5. 10.1016/j.neuron.2017.01.016 [DOI] [PubMed] [Google Scholar]
- Athalye VR, Santos FJ, Carmena JM, Costa RM, 2018. Evidence for a neural law of effect. Science 359, 1024–1029. 10.1126/science.aao6058 [DOI] [PubMed] [Google Scholar]
- Beaumont E, Campbell RP, Andresen MC, Scofield S, Singh K, Libbus I, KenKnight BH, Snyder L, Cantrell N, 2017. Cervical vagus nerve stimulation augments spontaneous discharge in second- and higher-order sensory neurons in the rat nucleus of the solitary tract. Am J Physiol Heart Circ Physiol 313, H354–H367. 10.1152/ajpheart.00070.2017 [DOI] [PMC free article] [PubMed] [Google Scholar]
- Ben-Menachem E, Mañon-Espaillat R, Ristanovic R, Wilder BJ, Stefan H, Mirza W, Tarver WB, Wernicke JF, Group FIVNSS, 1994. Vagus Nerve Stimulation for Treatment of Partial Seizures: 1. A Controlled Study of Effect on Seizures. Epilepsia 35, 616–626. 10.1111/j.1528-1157.1994.tb02482.x [DOI] [PubMed] [Google Scholar]
- Biane JS, Takashima Y, Scanziani M, Conner JM, Tuszynski MH, 2019. Reorganization of Recurrent Layer 5 Corticospinal Networks Following Adult Motor Training. J Neurosci 39, 4684–4693. 10.1523/JNEUROSCI.3442-17.2019 [DOI] [PMC free article] [PubMed] [Google Scholar]
- Borland MS, Vrana WA, Moreno NA, Fogarty EA, Buell EP, Sharma P, Engineer CT, Kilgard MP, 2016. Cortical Map Plasticity as a Function of Vagus Nerve Stimulation Intensity. Brain Stimulation 9, 117–123. 10.1016/j.brs.2015.08.018 [DOI] [PMC free article] [PubMed] [Google Scholar]
- Bowles S, Williamson WR, Nettles D, Hickman J, Welle CG, 2021. Closed-loop automated reaching apparatus (CLARA) for interrogating complex motor behaviors. J. Neural Eng 10.1088/1741-2552/ac1ed1 [DOI] [PMC free article] [PubMed] [Google Scholar]
- Cao VY, Ye Y, Mastwal S, Ren M, Coon M, Liu Q, Costa RM, Wang KH, 2015. Motor Learning Consolidates Arc-expressing Neuronal Ensembles in Secondary Motor Cortex. Neuron 86, 1385–1392. 10.1016/j.neuron.2015.05.022 [DOI] [PMC free article] [PubMed] [Google Scholar]
- Censor N, Sagi D, Cohen LG, 2012. Common mechanisms of human perceptual and motor learning. Nat Rev Neurosci 13, 658–664. 10.1038/nrn3315 [DOI] [PMC free article] [PubMed] [Google Scholar]
- Chang Y-C, Cracchiolo M, Ahmed U, Mughrabi I, Gabalski A, Daytz A, Rieth L, Becker L, Datta-Chaudhuri T, Al-Abed Y, Zanos TP, Zanos S, 2020. Quantitative estimation of nerve fiber engagement by vagus nerve stimulation using physiological markers. Brain Stimulation 13, 1617–1630. 10.1016/j.brs.2020.09.002 [DOI] [PubMed] [Google Scholar]
- Chase MH, Sterman MB, Clemente CD, 1966. Cortical and subcortical patterns of response to afferent vagal stimulation. Exp. Neurol 16, 36–49. [DOI] [PubMed] [Google Scholar]
- Chen SX, Kim AN, Peters AJ, Komiyama T, 2015. Subtype-specific plasticity of inhibitory circuits in motor cortex during motor learning. Nat. Neurosci 18, 1109–1115. 10.1038/nn.4049 [DOI] [PMC free article] [PubMed] [Google Scholar]
- Churchland MM, Cunningham JP, Kaufman MT, Foster JD, Nuyujukian P, Ryu SI, Shenoy KV, 2012. Neural population dynamics during reaching. Nature 487, 51–56. 10.1038/nature11129 [DOI] [PMC free article] [PubMed] [Google Scholar]
- Collins L, Boddington L, Steffan PJ, McCormick D, 2021. Vagus nerve stimulation induces widespread cortical and behavioral activation. Current Biology 31, 2088–2098.e3. 10.1016/j.cub.2021.02.049 [DOI] [PubMed] [Google Scholar]
- Conner JM, Culberson A, Packowski C, Chiba AA, Tuszynski MH, 2003. Lesions of the Basal Forebrain Cholinergic System Impair Task Acquisition and Abolish Cortical Plasticity Associated with Motor Skill Learning. Neuron 38, 819–829. 10.1016/S0896-6273(03)00288-5 [DOI] [PubMed] [Google Scholar]
- Conner JM, Kulczycki M, Tuszynski MH, 2010. Unique Contributions of Distinct Cholinergic Projections to Motor Cortical Plasticity and Learning. Cereb Cortex 20, 2739–2748. 10.1093/cercor/bhq022 [DOI] [PMC free article] [PubMed] [Google Scholar]
- Dawson J, Liu CY, Francisco GE, Cramer SC, Wolf SL, Dixit A, Alexander J, Ali R, Brown BL, Feng W, DeMark L, Hochberg LR, Kautz SA, Majid A, O’Dell MW, Pierce D, Prudente CN, Redgrave J, Turner DL, Engineer ND, Kimberley TJ, 2021. Vagus nerve stimulation paired with rehabilitation for upper limb motor function after ischaemic stroke (VNS-REHAB): a randomised, blinded, pivotal, device trial. The Lancet 397, 1545–1553. 10.1016/S0140-6736(21)00475-X [DOI] [PMC free article] [PubMed] [Google Scholar]
- Dayan P, Balleine BW, 2002. Reward, Motivation, and Reinforcement Learning. Neuron 36, 285–298. 10.1016/S0896-6273(02)00963-7 [DOI] [PubMed] [Google Scholar]
- Détári L, Juhász G, Kukorelli T, 1983. Effect of stimulation of vagal and radial nerves on neuronal activity in the basal forebrain area of anaesthetized cats. Acta Physiol Hung 61, 147–154. [PubMed] [Google Scholar]
- Dhawale AK, Miyamoto YR, Smith MA, Ölveczky BP, 2019. Adaptive Regulation of Motor Variability. Current Biology 29, 3551–3562.e7. 10.1016/j.cub.2019.08.052 [DOI] [PMC free article] [PubMed] [Google Scholar]
- Dhawale AK, Smith MA, Ölveczky BP, 2017. The Role of Variability in Motor Learning. Annu Rev Neurosci 40, 479–498. 10.1146/annurev-neuro-072116-031548 [DOI] [PMC free article] [PubMed] [Google Scholar]
- Do JP, Xu M, Lee S-H, Chang W-C, Zhang S, Chung S, Yung TJ, Fan JL, Miyamichi K, Luo L, Dan Y, 2016. Cell type-specific long-range connections of basal forebrain circuit. eLife 5, e13214. 10.7554/eLife.13214 [DOI] [PMC free article] [PubMed] [Google Scholar]
- Donoghue JP, Sanes JN, 1994. Motor areas of the cerebral cortex. J Clin Neurophysiol 11, 382–396. [PubMed] [Google Scholar]
- Doya K, 1999. What are the computations of the cerebellum, the basal ganglia and the cerebral cortex? Neural Networks 12, 961–974. 10.1016/S0893-6080(99)00046-5 [DOI] [PubMed] [Google Scholar]
- Eggermann E, Kremer Y, Crochet S, Petersen CCH, 2014. Cholinergic signals in mouse barrel cortex during active whisker sensing. Cell Rep 9, 1654–1660. 10.1016/j.celrep.2014.11.005 [DOI] [PubMed] [Google Scholar]
- Engineer ND, Riley JR, Seale JD, Vrana WA, Shetake JA, Sudanagunta SP, Borland MS, Kilgard MP, 2011. Reversing pathological neural activity using targeted plasticity. Nature 470, 101–104. 10.1038/nature09656 [DOI] [PMC free article] [PubMed] [Google Scholar]
- Farrand AQ, Helke KL, Gregory RA, Gooz M, Hinson VK, Boger HA, 2017. Vagus nerve stimulation improves locomotion and neuronal populations in a model of Parkinson’s disease. Brain Stimul 10, 1045–1054. 10.1016/j.brs.2017.08.008 [DOI] [PMC free article] [PubMed] [Google Scholar]
- Feldman DE, 2012. The spike timing dependence of plasticity. Neuron 75, 556–571. 10.1016/j.neuron.2012.08.001 [DOI] [PMC free article] [PubMed] [Google Scholar]
- Fraschini M, Puligheddu M, Demuru M, Polizzi L, Maleci A, Tamburini G, Congia S, Bortolato M, Marrosu F, 2013. VNS induced desynchronization in gamma bands correlates with positive clinical outcome in temporal lobe pharmacoresistant epilepsy. Neurosci. Lett 536, 14–18. 10.1016/j.neulet.2012.12.044 [DOI] [PubMed] [Google Scholar]
- Ganzer PD, Darrow MJ, Meyers EC, Solorzano BR, Ruiz AD, Robertson NM, Adcock KS, James JT, Jeong HS, Becker AM, Goldberg MP, Pruitt DT, Hays SA, Kilgard MP, Rennaker RL, 2018. Closed-loop neuromodulation restores network connectivity and motor control after spinal cord injury. Elife 7. 10.7554/eLife.32058 [DOI] [PMC free article] [PubMed] [Google Scholar]
- Garst-Orozco J, Babadi B, Ölveczky BP, 2014. A neural circuit mechanism for regulating vocal variability during song learning in zebra finches. eLife 3, e03697. 10.7554/eLife.03697 [DOI] [PMC free article] [PubMed] [Google Scholar]
- Gielow MR, Zaborszky L, 2017. The Input-Output Relationship of the Cholinergic Basal Forebrain. Cell Reports 18, 1817–1830. 10.1016/j.celrep.2017.01.060 [DOI] [PMC free article] [PubMed] [Google Scholar]
- Groves DA, Bowman EM, Brown VJ, 2005. Recordings from the rat locus coeruleus during acute vagal nerve stimulation in the anaesthetised rat. Neuroscience Letters 379, 174–179. 10.1016/j.neulet.2004.12.055 [DOI] [PubMed] [Google Scholar]
- Groves DA, Brown VJ, 2005. Vagal nerve stimulation: a review of its applications and potential mechanisms that mediate its clinical effects. Neurosci Biobehav Rev 29, 493–500. 10.1016/j.neubiorev.2005.01.004 [DOI] [PubMed] [Google Scholar]
- Guo J-Z, Graves AR, Guo WW, Zheng J, Lee A, Rodríguez-González J, Li N, Macklin JJ, Phillips JW, Mensh BD, Branson K, Hantman AW, 2015. Cortex commands the performance of skilled movement. eLife 4, e10774. 10.7554/eLife.10774 [DOI] [PMC free article] [PubMed] [Google Scholar]
- Guo W, Robert B, Polley DB, 2019. The Cholinergic Basal Forebrain Links Auditory Stimuli with Delayed Reinforcement to Support Learning. Neuron 103, 1164–1177.e6. 10.1016/j.neuron.2019.06.024 [DOI] [PMC free article] [PubMed] [Google Scholar]
- Han W, Tellez LA, Perkins MH, Perez IO, Qu T, Ferreira J, Ferreira TL, Quinn D, Liu Z-W, Gao X-B, Kaelberer MM, Bohórquez DV, Shammah-Lagnado SJ, de Lartigue G, de Araujo IE, 2018. A Neural Circuit for Gut-Induced Reward. Cell 175, 887–888. 10.1016/j.cell.2018.10.018 [DOI] [PubMed] [Google Scholar]
- Hangya B, Ranade SP, Lorenc M, Kepecs A, 2015. Central Cholinergic Neurons Are Rapidly Recruited by Reinforcement Feedback. Cell 162, 1155–1168. 10.1016/j.cell.2015.07.057 [DOI] [PMC free article] [PubMed] [Google Scholar]
- Heffley W, Song EY, Xu Z, Taylor BN, Hughes MA, McKinney A, Joshua M, Hull C, 2018. Coordinated cerebellar climbing fiber activity signals learned sensorimotor predictions. Nat Neurosci 21, 1431–1441. 10.1038/s41593-018-0228-8 [DOI] [PMC free article] [PubMed] [Google Scholar]
- Hosp JA, Pekanovic A, Rioult-Pedotti MS, Luft AR, 2011. Dopaminergic Projections from Midbrain to Primary Motor Cortex Mediate Motor Skill Learning. J. Neurosci 31, 2481–2487. 10.1523/JNEUROSCI.5411-10.2011 [DOI] [PMC free article] [PubMed] [Google Scholar]
- Hulsey DR, Hays SA, Khodaparast N, Ruiz A, Das P, Rennaker RL, Kilgard MP, 2016. Reorganization of Motor Cortex by Vagus Nerve Stimulation Requires Cholinergic Innervation. Brain Stimul 9, 174–181. 10.1016/j.brs.2015.12.007 [DOI] [PMC free article] [PubMed] [Google Scholar]
- Hulsey DR, Riley JR, Loerwald KW, Rennaker RL, Kilgard MP, Hays SA, 2017. Parametric characterization of neural activity in the locus coeruleus in response to vagus nerve stimulation. Exp. Neurol 289, 21–30. 10.1016/j.expneurol.2016.12.005 [DOI] [PMC free article] [PubMed] [Google Scholar]
- Hulsey DR, Shedd CM, Sarker SF, Kilgard MP, Hays SA, 2019. Norepinephrine and serotonin are required for vagus nerve stimulation directed cortical plasticity. Exp. Neurol 320, 112975. 10.1016/j.expneurol.2019.112975 [DOI] [PMC free article] [PubMed] [Google Scholar]
- Jiang L, Kundu S, Lederman JD, López-Hernández GY, Ballinger EC, Wang S, Talmage DA, Role LW, 2016. Cholinergic signaling controls conditioned-fear behaviors and enhances plasticity of cortical-amygdala circuits. Neuron 90, 1057–1070. 10.1016/j.neuron.2016.04.028 [DOI] [PMC free article] [PubMed] [Google Scholar]
- Jimenez JC, Su K, Goldberg AR, Luna VM, Biane JS, Ordek G, Zhou P, Ong SK, Wright MA, Zweifel L, Paninski L, Hen R, Kheirbek MA, 2018. Anxiety Cells in a Hippocampal-Hypothalamic Circuit. Neuron 97, 670–683.e6. 10.1016/j.neuron.2018.01.016 [DOI] [PMC free article] [PubMed] [Google Scholar]
- Kang JI, Huppé-Gourgues F, Vaucher E, 2014. Boosting visual cortex function and plasticity with acetylcholine to enhance visual perception. Front. Syst. Neurosci 8. 10.3389/fnsys.2014.00172 [DOI] [PMC free article] [PubMed] [Google Scholar]
- Kawai R, Markman T, Poddar R, Ko R, Fantana A, Dhawale A, Kampff AR, Ölveczky BP, 2015. Motor cortex is required for learning but not executing a motor skill. Neuron 86, 800–812. 10.1016/j.neuron.2015.03.024 [DOI] [PMC free article] [PubMed] [Google Scholar]
- Kimberley TJ, Pierce D, Prudente CN, Francisco GE, Yozbatiran N, Smith P, Tarver B, Engineer ND, Alexander Dickie D, Kline DK, Wigginton JG, Cramer SC, Dawson J, 2018. Vagus Nerve Stimulation Paired With Upper Limb Rehabilitation After Chronic Stroke. Stroke 49, 2789–2792. 10.1161/STROKEAHA.118.022279 [DOI] [PubMed] [Google Scholar]
- Krahl SE, Clark KB, Smith DC, Browning RA, 1998. Locus coeruleus lesions suppress the seizure-attenuating effects of vagus nerve stimulation. Epilepsia 39, 709–714. [DOI] [PubMed] [Google Scholar]
- Kucinski A, Kim Y, Sarter M, 2019. Basal forebrain chemogenetic inhibition disrupts the superior complex movement control of goal-tracking rats. Behav. Neurosci 133, 121–134. 10.1037/bne0000290 [DOI] [PMC free article] [PubMed] [Google Scholar]
- Lai J, David SV, 2021. Short-Term Effects of Vagus Nerve Stimulation on Learning and Evoked Activity in Auditory Cortex. eNeuro 8. 10.1523/ENEURO.0522-20.2021 [DOI] [PMC free article] [PubMed] [Google Scholar]
- Lemon RN, 2008. Descending Pathways in Motor Control. Annual Review of Neuroscience 31, 195–218. 10.1146/annurev.neuro.31.060407.125547 [DOI] [PubMed] [Google Scholar]
- Leong YC, Radulescu A, Daniel R, DeWoskin V, Niv Y, 2017. Dynamic Interaction between Reinforcement Learning and Attention in Multidimensional Environments. Neuron 93, 451–463. 10.1016/j.neuron.2016.12.040 [DOI] [PMC free article] [PubMed] [Google Scholar]
- Levy S, Lavzin M, Benisty H, Ghanayim A, Dubin U, Achvat S, Brosh Z, Aeed F, Mensh BD, Schiller Y, Meir R, Barak O, Talmon R, Hantman AW, Schiller J, 2020. Cell-Type-Specific Outcome Representation in the Primary Motor Cortex. Neuron 107, 954–971.e9. 10.1016/j.neuron.2020.06.006 [DOI] [PubMed] [Google Scholar]
- Li Q, Ko H, Qian Z-M, Yan LYC, Chan DCW, Arbuthnott G, Ke Y, Yung W-H, 2017. Refinement of learned skilled movement representation in motor cortex deep output layer. Nature Communications 8, 15834. 10.1038/ncomms15834 [DOI] [PMC free article] [PubMed] [Google Scholar]
- Lima SQ, Hromádka T, Znamenskiy P, Zador AM, 2009. PINP: A New Method of Tagging Neuronal Populations for Identification during In Vivo Electrophysiological Recording. PLoS One 4, e6099. 10.1371/journal.pone.0006099 [DOI] [PMC free article] [PubMed] [Google Scholar]
- Lin S-C, Nicolelis MAL, 2008. Neuronal ensemble bursting in the basal forebrain encodes salience irrespective of valence. Neuron 59, 138–149. 10.1016/j.neuron.2008.04.031 [DOI] [PMC free article] [PubMed] [Google Scholar]
- Luft AR, Schwarz S, 2009. Dopaminergic signals in primary motor cortex. International Journal of Developmental Neuroscience 27, 415–421. 10.1016/j.ijdevneu.2009.05.004 [DOI] [PubMed] [Google Scholar]
- Makino H, Hwang EJ, Hedrick NG, Komiyama T, 2016. Circuit mechanisms of sensorimotor learning. Neuron 92, 705–721. 10.1016/j.neuron.2016.10.029 [DOI] [PMC free article] [PubMed] [Google Scholar]
- Mawase F, Uehara S, Bastian AJ, Celnik P, 2017. Motor Learning Enhances Use-Dependent Plasticity. J Neurosci 37, 2673–2685. 10.1523/JNEUROSCI.3303-16.2017 [DOI] [PMC free article] [PubMed] [Google Scholar]
- Meyers EC, Kasliwal N, Solorzano BR, Lai E, Bendale G, Berry A, Ganzer PD, Romero-Ortega M, Rennaker RL, Kilgard MP, Hays SA, 2019. Enhancing plasticity in central networks improves motor and sensory recovery after nerve damage. Nat Commun 10, 5782. 10.1038/s41467-019-13695-0 [DOI] [PMC free article] [PubMed] [Google Scholar]
- Mughrabi IT, Hickman J, Jayaprakash N, Thompson D, Ahmed U, Papadoyannis ES, Chang Y-C, Abbas A, Datta-Chaudhuri T, Chang EH, Zanos TP, Lee SC, Froemke RC, Tracey KJ, Welle C, Al-Abed Y, Zanos S, 2021. Development and characterization of a chronic implant mouse model for vagus nerve stimulation. eLife 10, e61270. 10.7554/eLife.61270 [DOI] [PMC free article] [PubMed] [Google Scholar]
- Musall S, Urai AE, Sussillo D, Churchland AK, 2019. Harnessing behavioral diversity to understand neural computations for cognition. Current Opinion in Neurobiology, Computational Neuroscience 58, 229–238. 10.1016/j.conb.2019.09.011 [DOI] [PMC free article] [PubMed] [Google Scholar]
- Narayanan JT, Watts R, Haddad N, Labar DR, Li PM, Filippi CG, 2002. Cerebral activation during vagus nerve stimulation: a functional MR study. Epilepsia 43, 1509–1514. 10.1046/j.1528-1157.2002.16102.x [DOI] [PubMed] [Google Scholar]
- Neuser MP, Teckentrup V, Kühnel A, Hallschmid M, Walter M, Kroemer NB, 2020. Vagus nerve stimulation boosts the drive to work for rewards. Nat Commun 11, 3555. 10.1038/s41467-020-17344-9 [DOI] [PMC free article] [PubMed] [Google Scholar]
- Oby ER, Golub MD, Hennig JA, Degenhart AD, Tyler-Kabara EC, Yu BM, Chase SM, Batista AP, 2019. New neural activity patterns emerge with long-term learning. Proc Natl Acad Sci U S A 116, 15210–15215. 10.1073/pnas.1820296116 [DOI] [PMC free article] [PubMed] [Google Scholar]
- Padmashri R, Dunaevsky A, 2019. Modulation of excitatory but not inhibitory synaptic inputs in the mouse primary motor cortex in the late phase of motor learning. Neurosci Lett 709, 134371. 10.1016/j.neulet.2019.134371 [DOI] [PMC free article] [PubMed] [Google Scholar]
- Pekny SE, Izawa J, Shadmehr R, 2015. Reward-Dependent Modulation of Movement Variability. J. Neurosci 35, 4015–4024. 10.1523/JNEUROSCI.3244-14.2015 [DOI] [PMC free article] [PubMed] [Google Scholar]
- Pelot NA, Behrend CE, Grill WM, 2017. Modeling the response of small myelinated axons in a compound nerve to kilohertz frequency signals. J Neural Eng 14, 046022. 10.1088/1741-2552/aa6a5f [DOI] [PMC free article] [PubMed] [Google Scholar]
- Perez SM, Carreno FR, Frazer A, Lodge DJ, 2014. Vagal Nerve Stimulation Reverses Aberrant Dopamine System Function in the Methylazoxymethanol Acetate Rodent Model of Schizophrenia. J Neurosci 34, 9261–9267. 10.1523/JNEUROSCI.0588-14.2014 [DOI] [PMC free article] [PubMed] [Google Scholar]
- Peters AJ, Chen SX, Komiyama T, 2014. Emergence of reproducible spatiotemporal activity during motor learning. Nature 510, 263–267. 10.1038/nature13235 [DOI] [PubMed] [Google Scholar]
- Peters AJ, Lee J, Hedrick NG, O’Neil K, Komiyama T, 2017. Reorganization of corticospinal output during motor learning. Nat. Neurosci 20, 1133–1141. 10.1038/nn.4596 [DOI] [PMC free article] [PubMed] [Google Scholar]
- Pnevmatikakis EA, Giovannucci A, 2017. NoRMCorre: An online algorithm for piecewise rigid motion correction of calcium imaging data. J Neurosci Methods 291, 83–94. 10.1016/j.jneumeth.2017.07.031 [DOI] [PubMed] [Google Scholar]
- Porter BA, Khodaparast N, Fayyaz T, Cheung RJ, Ahmed SS, Vrana WA, Rennaker RL, Kilgard MP, 2012. Repeatedly pairing vagus nerve stimulation with a movement reorganizes primary motor cortex. Cereb. Cortex 22, 2365–2374. 10.1093/cercor/bhr316 [DOI] [PubMed] [Google Scholar]
- Pruitt DT, Schmid AN, Kim LJ, Abe CM, Trieu JL, Choua C, Hays SA, Kilgard MP, Rennaker RL, 2016. Vagus Nerve Stimulation Delivered with Motor Training Enhances Recovery of Function after Traumatic Brain Injury. J. Neurotrauma 33, 871–879. 10.1089/neu.2015.3972 [DOI] [PMC free article] [PubMed] [Google Scholar]
- Prus AJ, James JR, Rosecrans JA, 2009. Conditioned Place Preference, in: Buccafusco JJ (Ed.), Methods of Behavior Analysis in Neuroscience, Frontiers in Neuroscience. CRC Press/Taylor & Francis, Boca Raton (FL). [Google Scholar]
- Puzerey PA, Maher K, Prasad N, Goldberg JH, 2018. Vocal learning in songbirds requires cholinergic signaling in a motor cortex-like nucleus. Journal of Neurophysiology 120, 1796–1806. 10.1152/jn.00078.2018 [DOI] [PMC free article] [PubMed] [Google Scholar]
- Ramanathan D, Tuszynski MH, Conner JM, 2009. The Basal Forebrain Cholinergic System Is Required Specifically for Behaviorally Mediated Cortical Map Plasticity. J. Neurosci 29, 5992–6000. 10.1523/JNEUROSCI.0230-09.2009 [DOI] [PMC free article] [PubMed] [Google Scholar]
- Ramanathan DS, Conner JM, Anilkumar AA, Tuszynski MH, 2015. Cholinergic systems are essential for late-stage maturation and refinement of motor cortical circuits. J Neurophysiol 113, 1585–1597. 10.1152/jn.00408.2014 [DOI] [PMC free article] [PubMed] [Google Scholar]
- Redgrave JN, Moore L, Oyekunle T, Ebrahim M, Falidas K, Snowdon N, Ali A, Majid A, 2018. Transcutaneous Auricular Vagus Nerve Stimulation with Concurrent Upper Limb Repetitive Task Practice for Poststroke Motor Recovery: A Pilot Study. J Stroke Cerebrovasc Dis 27, 1998–2005. 10.1016/j.jstrokecerebrovasdis.2018.02.056 [DOI] [PubMed] [Google Scholar]
- Reed A, Riley J, Carraway R, Carrasco A, Perez C, Jakkamsetti V, Kilgard MP, 2011. Cortical map plasticity improves learning but is not necessary for improved performance. Neuron 70, 121–131. 10.1016/j.neuron.2011.02.038 [DOI] [PubMed] [Google Scholar]
- Reimer J, McGinley MJ, Liu Y, Rodenkirch C, Wang Q, McCormick DA, Tolias AS, 2016. Pupil fluctuations track rapid changes in adrenergic and cholinergic activity in cortex. Nat Commun 7, 13289. 10.1038/ncomms13289 [DOI] [PMC free article] [PubMed] [Google Scholar]
- Ren C, Peng K, Yang R, Liu W, Liu C, Komiyama T, 2022. Global and subtype-specific modulation of cortical inhibitory neurons regulated by acetylcholine during motor learning. Neuron. 10.1016/j.neuron.2022.04.031 [DOI] [PMC free article] [PubMed] [Google Scholar]
- Riekkinen P, Riekkinen M, Sirviö J, 1993. Cholinergic drugs regulate passive avoidance performance via the amygdala. J Pharmacol Exp Ther 267, 1484–1492. [PubMed] [Google Scholar]
- Riekkinen P, Sirviö J, Aaltonen M, Riekkinen P, 1990. Effects of concurrent manipulations of nicotinic and muscarinic receptors on spatial and passive avoidance learning. Pharmacol Biochem Behav 37, 405–410. 10.1016/0091-3057(90)90004-2 [DOI] [PubMed] [Google Scholar]
- Rossi J, Balthasar N, Olson D, Scott M, Berglund E, Lee CE, Choi MJ, Lauzon D, Lowell BB, Elmquist JK, 2011. Melanocortin-4-receptors Expressed by Cholinergic Neurons Regulate Energy Balance and Glucose Homeostasis. Cell Metab 13, 195–204. 10.1016/j.cmet.2011.01.010 [DOI] [PMC free article] [PubMed] [Google Scholar]
- Rush AJ, Marangell LB, Sackeim HA, George MS, Brannan SK, Davis SM, Howland R, Kling MA, Rittberg BR, Burke WJ, Rapaport MH, Zajecka J, Nierenberg AA, Husain MM, Ginsberg D, Cooke RG, 2005. Vagus Nerve Stimulation for Treatment-Resistant Depression: A Randomized, Controlled Acute Phase Trial. Biological Psychiatry 58, 347–354. 10.1016/j.biopsych.2005.05.025 [DOI] [PubMed] [Google Scholar]
- Sanes JN, Donoghue JP, 2000. Plasticity and primary motor cortex. Annu Rev Neurosci 23, 393–415. 10.1146/annurev.neuro.23.1.393 [DOI] [PubMed] [Google Scholar]
- Sawaki L, Boroojerdi B, Kaelin-Lang A, Burstein AH, Bütefisch CM, Kopylev L, Davis B, Cohen LG, 2002. Cholinergic Influences on Use-Dependent Plasticity. Journal of Neurophysiology 87, 166–171. 10.1152/jn.00279.2001 [DOI] [PubMed] [Google Scholar]
- Schmitzer-Torbert N, Jackson J, Henze D, Harris K, Redish AD, 2005. Quantitative measures of cluster quality for use in extracellular recordings. Neuroscience 131, 1–11. 10.1016/j.neuroscience.2004.09.066 [DOI] [PubMed] [Google Scholar]
- Schwarz LA, Luo L, 2015. Organization of the Locus Coeruleus-Norepinephrine System. Current Biology 25, R1051–R1056. 10.1016/j.cub.2015.09.039 [DOI] [PubMed] [Google Scholar]
- Scott SH, 2016. A Functional Taxonomy of Bottom-Up Sensory Feedback Processing for Motor Actions. Trends in Neurosciences 39, 512–526. 10.1016/j.tins.2016.06.001 [DOI] [PubMed] [Google Scholar]
- Settell ML, Pelot NA, Knudsen BE, Dingle AM, McConico AL, Nicolai EN, Trevathan JK, Ezzell JA, Ross EK, Gustafson KJ, Shoffstall AJ, Williams JC, Zeng W, Poore SO, Populin LC, Suminski AJ, Grill WM, Ludwig KA, 2020. Functional vagotopy in the cervical vagus nerve of the domestic pig: implications for the study of vagus nerve stimulation. J Neural Eng 17, 026022. 10.1088/1741-2552/ab7ad4 [DOI] [PMC free article] [PubMed] [Google Scholar]
- Sheintuch L, Rubin A, Brande-Eilat N, Geva N, Sadeh N, Pinchasof O, Ziv Y, 2017. Tracking the Same Neurons across Multiple Days in Ca2+ Imaging Data. Cell Rep 21, 1102–1115. 10.1016/j.celrep.2017.10.013 [DOI] [PMC free article] [PubMed] [Google Scholar]
- Shi C, Flanagan SR, Samadani U, 2013. Vagus Nerve Stimulation to Augment Recovery from Severe Traumatic Brain Injury Impeding Consciousness: A Prospective Pilot Clinical Trial. Neurol Res 35, 263–276. 10.1179/1743132813Y.0000000167 [DOI] [PMC free article] [PubMed] [Google Scholar]
- Shinoe T, Matsui M, Taketo MM, Manabe T, 2005. Modulation of Synaptic Plasticity by Physiological Activation of M1 Muscarinic Acetylcholine Receptors in the Mouse Hippocampus. J Neurosci 25, 11194–11200. 10.1523/JNEUROSCI.2338-05.2005 [DOI] [PMC free article] [PubMed] [Google Scholar]
- Shmuelof L, Krakauer JW, Mazzoni P, 2012. How is a motor skill learned? Change and invariance at the levels of task success and trajectory control. Journal of Neurophysiology 108, 578–594. 10.1152/jn.00856.2011 [DOI] [PMC free article] [PubMed] [Google Scholar]
- Smiley JF, Subramanian M, Mesulam M-M, 1999. Monoaminergic–cholinergic interactions in the primate basal forebrain. Neuroscience 93, 817–829. 10.1016/S0306-4522(99)00116-5 [DOI] [PubMed] [Google Scholar]
- The Vagus Nerve Stimulation Study Group, 1995. A randomized controlled trial of chronic vagus nerve stimulation for treatment of medically intractable seizures. The Vagus Nerve Stimulation Study Group. Neurology 45, 224–230. 10.1212/wnl.45.2.224 [DOI] [PubMed] [Google Scholar]
- Tu G, Halawa A, Yu X, Gillman S, Takehara-Nishiuchi K, 2022. Outcome-Locked Cholinergic Signaling Suppresses Prefrontal Encoding of Stimulus Associations. J. Neurosci 42, 4202–4214. 10.1523/JNEUROSCI.1969-21.2022 [DOI] [PMC free article] [PubMed] [Google Scholar]
- Tyler R, Cacace A, Stocking C, Tarver B, Engineer N, Martin J, Deshpande A, Stecker N, Pereira M, Kilgard M, Burress C, Pierce D, Rennaker R, Vanneste S, 2017. Vagus Nerve Stimulation Paired with Tones for the Treatment of Tinnitus: A Prospective Randomized Double-blind Controlled Pilot Study in Humans. Sci Rep 7, 11960. 10.1038/s41598-017-12178-w [DOI] [PMC free article] [PubMed] [Google Scholar]
- Uehara S, Mawase F, Therrien AS, Cherry-Allen KM, Celnik P, 2019. Interactions between motor exploration and reinforcement learning. Journal of Neurophysiology 122, 797–808. 10.1152/jn.00390.2018 [DOI] [PMC free article] [PubMed] [Google Scholar]
- Usami K, Kano R, Kawai K, Noda T, Shiramatsu TI, Saito N, Takahashi H, 2013. Modulation of cortical synchrony by vagus nerve stimulation in adult rats. Conf Proc IEEE Eng Med Biol Soc 2013, 5348–5351. 10.1109/EMBC.2013.6610757 [DOI] [PubMed] [Google Scholar]
- Weber I, Niehaus H, Krause K, Molitor L, Peper M, Schmidt L, Hakel L, Timmermann L, Menzler K, Knake S, Oehrn CR, 2021. Trust your gut: vagal nerve stimulation in humans improves reinforcement learning. Brain Communications 3. 10.1093/braincomms/fcab039 [DOI] [PMC free article] [PubMed] [Google Scholar]
- Whishaw IQ, O’Connor WT, Dunnett SB, 1986. THE CONTRIBUTIONS OF MOTOR CORTEX, NIGROSTRIATAL DOPAMINE AND CAUDATE-PUTAMEN TO SKILLED FORELIMB USE IN THE RAT. Brain 109, 805–843. 10.1093/brain/109.5.805 [DOI] [PubMed] [Google Scholar]
- Whishaw IQ, Whishaw P, Gorny B, 2008. The Structure of Skilled Forelimb Reaching in the Rat: A Movement Rating Scale. J Vis Exp 816. 10.3791/816 [DOI] [PMC free article] [PubMed] [Google Scholar]
- Wickens JR, Reynolds JN, Hyland BI, 2003. Neural mechanisms of reward-related motor learning. Current Opinion in Neurobiology 13, 685–690. 10.1016/j.conb.2003.10.013 [DOI] [PubMed] [Google Scholar]
- Wolpert DM, Diedrichsen J, Flanagan JR, 2011. Principles of sensorimotor learning. Nat Rev Neurosci 12, 739–751. 10.1038/nrn3112 [DOI] [PubMed] [Google Scholar]
- Wu D, Ma J, Zhang L, Wang S, Tan B, Jia G, 2020. Effect and Safety of Transcutaneous Auricular Vagus Nerve Stimulation on Recovery of Upper Limb Motor Function in Subacute Ischemic Stroke Patients: A Randomized Pilot Study. Neural Plasticity 2020, e8841752. 10.1155/2020/8841752 [DOI] [PMC free article] [PubMed] [Google Scholar]
- Wu HG, Miyamoto YR, Castro LNG, Ölveczky BP, Smith MA, 2014. Temporal structure of motor variability is dynamically regulated and predicts motor learning ability. Nat Neurosci 17, 312–321. 10.1038/nn.3616 [DOI] [PMC free article] [PubMed] [Google Scholar]
- Zaborszky L, Rosin DL, Kiss J, 2004. Alpha-adrenergic receptor (alpha(2 A )) is colocalized in basal forebrain cholinergic neurons: a light and electron microscopic double immunolabeling study. J Neurocytol 33, 265–276. 10.1023/B:NEUR.0000044188.67442.9d [DOI] [PubMed] [Google Scholar]
- Zhang K, Chen CD, Monosov IE, 2019. Novelty, salience, and surprise-timing are signaled by neurons in the basal forebrain. Curr Biol 29, 134–142.e3. 10.1016/j.cub.2018.11.012 [DOI] [PMC free article] [PubMed] [Google Scholar]
- Zhao S, Ting JT, Atallah HE, Qiu L, Tan J, Gloss B, Augustine GJ, Deisseroth K, Luo M, Graybiel AM, Feng G, 2011. Cell-type Specific Optogenetic Mice for Dissecting Neural Circuitry Function. Nat Methods 8, 745–752. [DOI] [PMC free article] [PubMed] [Google Scholar]
- Zhou P, Resendez SL, Rodriguez-Romaguera J, Jimenez JC, Neufeld SQ, Giovannucci A, Friedrich J, Pnevmatikakis EA, Stuber GD, Hen R, Kheirbek MA, Sabatini BL, Kass RE, Paninski L, 2018. Efficient and accurate extraction of in vivo calcium signals from microendoscopic video data. eLife 7, e28728. 10.7554/eLife.28728 [DOI] [PMC free article] [PubMed] [Google Scholar]
Associated Data
This section collects any data citations, data availability statements, or supplementary materials included in this article.
Supplementary Materials
Data Availability Statement
All original code has been deposited at GitHub and is publicly available as of the date of publication. Links are listed in the key resources table. Any additional information required to reanalyze the data reported in this paper is available from the lead contact upon request.