

Abstract
Background:
Current literature on the association between mobility in socioeconomic position (SEP) and depression demonstrates mixed findings, with variation in the benefits of upward socioeconomic position by racial group and ethnic background. No study has examined life-course SEP mobility and depressive symptoms among Black women in the U.S.
Methods:
Our cohort included 1,612 Black women enrolled in the Study of Environment, Lifestyle and Fibroids (SELF) between 2010 and 2012 and followed for 5 years. We utilized data on socioeconomic indicators at childhood and adulthood and used latent class analysis to create a life-course SEP mobility measure (persistently low, downward, upward, and persistently high). Using the 11-item Center for Epidemiologic Studies Depression Scale (CES-D), we assessed high (CES-D≥9) vs. low depressive symptoms. Multivariable log risk models were used to produce risk ratios (RRs) and 95% confidence intervals (CIs).
Results:
37% of participants had high depressive symptoms. Persistently low (RR: 1.56; 95% CI: 1.31, 1.86) and downward (RR: 1.36; 95% CI: 1.14, 1.63) SEP mobility was associated with high depressive symptoms after adjustment for age, adult social support, and marital status. There was evidence of effect measure modification by adult social support, with a stronger association among those who reported high adult social support compared to low adult social support.
Conclusions:
These findings suggest directing mental health resources to people experiencing low SEP at any stage in life, especially those with low SEP in adulthood, to aid in management of depressive symptoms.
Keywords: depressive symptoms, socioeconomic position, mobility, mental health, life course
Introduction
Nearly 17 million adults had at least one major depressive episode in the United States (U.S.) in 2017, with women disproportionately affected (National Institute of Mental Health, 2019; World Health Organization, 2020). According to the National Health and Nutrition Examination Survey (2013–2016), women had double the prevalence of depression (10.4%) compared with men (5.5%) between 2013 and 2016 (Brody et al., 2018). Among Black women, the prevalence of depressive symptoms is 10% to 14% (Brody et al., 2018; McKnight-Eily et al., 2009). Depressive symptoms are characterized by loneliness, loss of interest in activities, suicidal ideation, and various somatic dysfunctions such as loss of appetite and sleep disturbances (National Institute of Mental Health, 2019). Research examining depression-related outcomes by racial group is mixed, with some studies reporting lower levels of depression among Black Americans compared to White Americans (Anglin et al., 2014; Brody et al., 2018; Budhwani et al., 2015; Christie-Mizell et al., 2019; Ghafoori et al., 2012; Hudson et al., 2012). However, there is evidence that depression among Black Americans may be underreported and underdiagnosed, with depression likely being more severe and longer in duration compared to White Americans due to limited health care access, stigma, and reduced quality of screening and treatment (Assari, 2019; Bailey et al., 2019).
The association between socioeconomic status (SES) and health is presumed to have a positive linear relationship, but a growing literature indicates that benefits of upward SES on health may not be as substantial for Black Americans compared to White Americans (Colen, Krueger, et al., 2018; Colen, Ramey, et al., 2018; Curry Owens & Jackson, 2015). Middle-class Black Americans with above average education, occupational status, and family income tend to live in lower SES neighborhoods compared with White Americans with similar SES (Colen, Krueger, et al., 2018). The Minorities Diminished Return theory supports these findings, whereby Black, Indigenous, and people of color (BIPOC) populations do not experience the same benefits from increases in SES as White Americans. Potential reasons for this diminished return include racism manifested through actions such as discrimination and residential segregation that can limit access to resources and opportunities (Assari, 2018; Hudson et al., 2016).
Some research has evaluated how socioeconomic position (SEP) over the life-course is associated with depressive symptoms, with the terms SEP and SES used interchangeably (Budhwani et al., 2015; Hudson et al., 2012, 2013; Joinson et al., 2017; Ruiz et al., 2019). The direction of the association between indicators of adult SEP and depression varied in studies in the U.S., with mixed results on the association between income and depression-related outcomes for Black men and women (Anglin et al., 2014; Hudson et al., 2012). Few studies have examined socioeconomic mobility, defined as change in SEP from one time point to another, and depression within the U.S. and internationally (Curry Owens & Jackson, 2015; Hudson et al., 2013; Miller et al., 2020; Osler et al., 2015). In a study examining both life-course SEP from childhood to adulthood (low/low, low/high, high/low, and high/high) and life-course mobility (ascended, descended, and stayed the same) as potential moderators of the association between stress and depression (score ≥20 on Beck Depression Inventory-II) among Black American women, there was no evidence of moderation by life-course SEP or life-course mobility (Curry Owens & Jackson, 2015). Miller et al. (2020) reported that downward and upward socioeconomic mobility among participants in the U.S. were associated with significant depression (score ≥16 on Center for Epidemiologic Studies-Depression Scale) (Miller et al., 2020). Another study from Denmark reported low life-course SEP was associated with depressive mood in adulthood, but the association was attenuated when adjusted for adult smoking and body mass index (BMI) (Osler et al., 2015). To our knowledge, the association between life-course SEP mobility and depressive symptoms has not been investigated among Black women in the U.S. Research among Black women on life-course SEP mobility and depressive symptoms is important due to the intersection of race and gender that may predispose them to various forms of discrimination and other stressors that likely increase their risk of depressive symptoms.
The primary objectives of this study are to: 1) describe associations between individual SEP indicators and depressive symptoms, 2) assess the association between life-course SEP mobility from childhood to adulthood and depressive symptoms, and 3) evaluate the modifying effect of social support in adulthood on the relationship between life-course SEP mobility and depressive symptoms. Based on existing literature showing fewer benefits from an increase in SEP for Black Americans versus White Americans, we hypothesize that among Black women a persistently low, downward, or upward life-course SEP mobility would be associated with high depressive symptoms compared with those with persistently high life-course SEP mobility.
Methods
Data for this investigation came from the Study of Environment, Lifestyle and Fibroids (SELF) that enrolled 1,693 volunteer Black women aged 23 to 34 years during baseline from 2010 to 2012 and followed them for 5 years at approximate 20-month intervals. Women enrolled resided in the Detroit, Michigan area and self-reported their race as at least part Black or African American. Details about the eligibility criteria, recruitment process, and data collection for this study have been described elsewhere (Baird et al., 2015). Participants included in this study are those who answered questions using computer-assisted interviews on depressive symptoms at a follow-up visit and provided information about their SEP in childhood and adulthood. All participants provided written consent.
Exposure Assessment – Life-course Socioeconomic Indicators and Latent Classes of Mobility in Socioeconomic Position (SEP)
Latent class analysis was used to create a life-course SEP mobility variable using nine childhood and adult SEP indicators. Initial latent class analyses included all response levels for SEP indicator variables; because these results were similar to when SEP indicator variables were analyzed dichotomously, final analyses used dichotomized versions for ease in interpretation. Indicators were chosen for the life-course SEP mobility variable if they asked participants a question that related to socioeconomic status or financial distress in childhood or adulthood.
Questions on four childhood SEP variables were asked at baseline. Participants were asked whether both parents were at home at age 10 (yes/no) based on whether the participant reported a mother/stepmother and father/stepfather at home. Childhood household income was dichotomized as high (middle income and well-off) and low (low income and poor). Mother’s educational attainment was reported as high school (HS) diploma/general education development (GED) equivalent or less, some college, associate degree or technical training, and bachelor’s degree and/or graduate degree; this was dichotomized as less than HS diploma or equivalent and at least a HS diploma or equivalent. Food insecurity (yes/no) was assessed by asking, “Was there any time while growing up that you did not have enough to eat?”
Information on five adult SEP variables were obtained at the same follow-up visit when depressive symptoms were assessed. Participants reported their own household income using provided categories: <$20,000, $20,000-$50,000, or >$50,000. Given that the median household income in Detroit between 2010–2012 was about $25,000, we dichotomized household income as low (<$20,000) and high (≥$20,000) (Detroit has half the median income, three times the poverty rate of nation, new Census numbers show - mlive.com, 2019). Participants’ educational attainment was categorized as low (less than an associate degree or technical degree) and high (at least an associate degree or technical degree). Number of people supported by household income was dichotomized as 3 or fewer people (yes/no). Employment status was dichotomized as unemployed and employed (worked <30 hours per week and worked ≥30 hours per week). Participants self-reported their difficulty in paying basic expenses as very, moderately, slightly or occasionally, or not at all difficult, which we categorized as no difficulty versus any difficulty.
Outcome Assessment – Depressive Symptoms
The modified short form Iowa version of the Center for Epidemiologic Studies Depression Scale (CES-D) included 11 questions to assess depressive symptoms among participants. Questions included whether in the past week they did not feel like eating; they felt depressed; they felt lonely; they felt sad; they felt people dislike them; they could not get going; they felt everything was an effort; they had restless sleep; they were happy; they enjoyed life; and they felt people were unfriendly to them. Each question included a modified Likert response scale: always (4), often (3), sometimes (2), hardly ever (1), and never (0). For scoring, the numbers on the scale were reverse coded for questions asking about feeling happy and enjoying life in the past week. All responses from the CES-D questions were summed and a score of at least nine (CES-D ≥ 9) was defined as high depressive symptoms. We followed guidance on previous research that validated a CES-D score of at least nine on the 11-item survey was appropriate to identify those with high depressive symptoms among Black women in the US (Torres, 2012). Most participants completed the CES-D scale at follow-up visit 1 (n=1,485, 92%), while the remaining participants completed it at follow-up visits 2 (n=96, 6%) and 3 (n=31, 2%). The present analysis excluded individuals who did not complete the CES-D at any follow-up visit (n=81, 5%).
Statistical Analysis
Descriptive statistics were generated for the childhood and adult SEP indicators. Chi-square tests for categorical variables and t-tests or Wilcoxon tests for continuous variables were conducted to assess associations between childhood SEP indicators, adulthood SEP indicators, and demographic characteristics with depressive symptoms.
Using Mplus version 8.4, the latent class model for the life-course SEP mobility variable was fit by using full information maximum likelihood under the missing at random assumption. By using full-information maximum likelihood, participants with partially missing data were not excluded from the analysis. The appropriate number of classes was determined by using an iterative process in which the model was fit with an increasing number of classes. Selection of the optimally fitting model was based on model fit statistics (such as Akaike information criterion and Bayesian Information Criterion) and selection criteria, parsimony principle, and theoretical interpretability.
Multivariable log-risk models were used to estimate risk ratios (RRs) and 95% confidence intervals (CIs). A direct acyclic graph was created to identify potential confounders. Final models adjusted for age (continuous), adult social support (high/low), and marital status (never/previous/current, with “married” including “living together as married”). Adult social support was derived from two survey questions that asked participants to what extent they were able to count on someone for emotional support and to be taken to the doctor or help with daily chores when sick (i.e., none (1), little (2), some (3), most (4), or all of the time (5)). Adult social support was dichotomized based on the median score of 8 from the sum of responses as high (≥8) and low (<8).
An interaction term between life-course SEP mobility and adult social support was included in the model to assess for potential effect measure modification on the multiplicative scale of life-course SEP mobility and depressive symptoms.
Results
Of the 1,612 women included in the analysis, 37% were categorized as having high depressive symptoms (CES-D ≥ 9) (Table 1). Average participant age at depressive symptoms assessment was 31 years (SD = 3.5); age did not differ by high versus low depressive symptoms. BMI and depressive symptoms were significantly associated, with a higher average BMI for those in the high depressive category (BMI = 34) than participants with low depressive symptoms (BMI = 33). Overall, 45% of the participants were never married and the majority always lived in Detroit (62%). Among those with high depressive symptoms, a smaller proportion of participants had a high childhood supportive environment and high adult social support compared to the proportion among those with low depressive symptoms. At least half of participants reported being raised by both parents (53%), having high childhood household income (60%), having a mother with at least a high school education (86%), and having food security growing up (87%). In adulthood, more than half of participants reported a household income of ≥ $20,000 (56%), ≤3 people supported by their household income (71%), and being employed (73%). Approximately 44% of the participants attained at least an associate degree and 25% did not have any difficulty paying for basic expenses.
Table 1.
Baseline characteristics of SELF study participants overall and by depressive symptoms, 2010 and 2012 (n=1,612)
| Overall | Depressive Symptoms | |||
|---|---|---|---|---|
|
| ||||
| High CES-D | Low CES-D | |||
| n=1,612 (%) | n=589 (37%) | n=1,023 (64%) | p-value1 | |
|
| ||||
| Demographic Variables | ||||
| Age, mean (SD) | 31 (3.5) | 31.07 (3.5) | 30.96 (3.4) | 0.552 |
| BMI, median (IQR) | 33.09 (26.9, 40.0) | 33.98 (27.9, 40.6) | 32.63 (26.5, 39.7) | 0.032 |
| Always live in Detroit | 997 (62) | 360 (62) | 637 (62) | 0.81 |
| Marital status | ||||
| Never married or never lived as married | 725 (45) | 269 (465) | 456 (45) | 0.02 |
| Previously married or previously lived as married | 271 (17) | 116 (20) | 155 (15) | |
| Currently married or currently living as married | 616 (38) | 204 (35) | 412 (40) | |
| High childhood supportive environment | 1298 (81) | 420 (71) | 878 (86) | <0.001 |
| High adult social support | 937 (58) | 247 (42) | 690 (67) | <0.001 |
| Childhood Socioeconomic Indicators | ||||
| Both parents at home at age 10 | 839 (53) | 290 (50) | 549 (54) | 0.13 |
| High childhood household income | 965 (60) | 316 (54) | 649 (63) | <0.001 |
| Mother at least high school education | 1386 (86) | 483 (82) | 903 (88) | 0.001 |
| Food secure | 1406 (87) | 485 (82) | 921 (90) | <0.001 |
| Adult Socioeconomic Indicators | ||||
| Household income ≥$20,000 | 903 (56) | 269 (46) | 634 (62) | <0.001 |
| At least associate degree | 703 (44) | 204 (35) | 499 (49) | <0.001 |
| Household income supporting 3 or fewer people | 1144 (71) | 427 (73) | 717 (70) | 0.33 |
| Employed | 1173 (73) | 386 (66) | 787 (77) | <0.001 |
| No difficulty paying expenses | 404 (25) | 84 (14) | 320 (31) | <0.001 |
CES-D: Center for Epidemiologic Studies Depression Scale (CES-D); standard deviation (SD); interquartile range (IQR)
Pearson chi-squared tests
Kruskal-Wallis test
Based on the latent class analysis, a four-class model had the best fit for life-course SEP mobility (persistently low, downward, upward, persistently high) (Table 2). Twenty percent were in the persistently low class, 24% in the downward class, 21% in the upward class, and 35% in the persistently high class of life-course SEP mobility (Table 3). The mean (SD) depressive symptoms score for those with persistently low, downward, upward, and persistently high life-course SEP mobility was 9.24 (5.26), 7.91 (5.04), 7.07 (4.97), and 6.19 (4.38), respectively (Figure 1). Using persistently high life-course SEP mobility as the referent, an increased risk of high depressive symptoms was observed among those with persistently low (RR: 1.95; 95% CI: 1.65, 2.32), downward (RR: 1.50; 95% CI: 1.25, 1.79), and upward (RR: 1.26; 95% CI: 1.03, 1.54) SEP from childhood to adulthood in the unadjusted analyses (Table 4). Further, we found adult social support to be an effect measure modifier of the relationship between life-course SEP mobility and depressive symptoms, with a greater risk of depressive symptoms among those with high adult social support than low adult social support (LRT=11.08, p-value=0.01) (Table 4). Among those with high adult social support, we observed elevated associations between persistently low (RR: 2.26; 95% CI: 1.71, 2.97) and downward (RR: 1.46; 95% CI: 1.10, 1.93) life-course SEP mobility with high depressive symptoms. The association for those with upward life-course SEP mobility was also elevated but included the null value in the CI (RR: 1.11; 95% CI: 0.80, 1.53). Among those with low adult social support, we observed increased risk of high depressive symptoms for persistently low (RR: 1.33; 95% CI: 1.08, 1.66), downward (RR: 1.27; 95% CI: 1.02, 1.60), and upward (RR: 1.13; 95% CI: 0.89, 1.44) mobility in SEP from childhood to adulthood.
Table 2.
Latent class analysis model fit for life-course mobility in socioeconomic position (SEP), SELF Study (n=1,612)
| No. of classes | # of free par | Log likelihood | AIC | BIC | Adj-BIC | Entropy | LMR P value | Permutation p-value |
|---|---|---|---|---|---|---|---|---|
|
| ||||||||
| 1 | 9 | −8490.51 | 16999.02 | 17047.48 | 17018.89 | - | - | - |
| 2 | 19 | −8090.77 | 16219.54 | 16321.86 | 16261.5 | 0.678 | <0.001 | <0.001 |
| 3 | 29 | −8011.78 | 16081.55 | 16237.72 | 16145.6 | 0.717 | 0.0002 | <0.001 |
| 4 | 39 | −7973.75 | 16025.49 | 16235.51 | 16111.62 | 0.672 | 0.0583 | <0.001 |
| 5 | 49 | −7947.11 | 15992.23 | 16256.11 | 16100.44 | 0.674 | 0.3931 | <0.001 |
| 6 | 59 | −7932.56 | 15983.12 | 16300.85 | 16113.42 | 0.652 | 0.6941 | <0.001 |
Note: AIC, Akaike information criterion; BIC, Bayesian Information Criterion; Adj-BIC, sample-size adjusted BIC; LMR, Lo-Mendell-Rubin likelihood ratio test. Bolding indicates the lowest BIC value for the 4-class model.
Table 3.
Latent class membership for life-course mobility in socioeconomic position (SEP) among SELF Study participants (n=1,612)
| Overall (%) | Persistently low (%) | Downward (%) | Upward (%) | Persistently high (%) | |
|---|---|---|---|---|---|
|
| |||||
| SEP Indicators | 20 | 24 | 21 | 35 | |
| Childhood | |||||
| Both parents in household at age 10 | 52 | 38 | 52 | 44 | 66 |
| High childhood household income | 60 | 13 | 95 | 0.3 | 98 |
| Mother at least high school education | 86 | 64 | 89 | 83 | 98 |
| Food secure | 87 | 61 | 100 | 79 | 98 |
| Adulthood | |||||
| Household income at least ≥$20,000 | 56 | 0 | 9 | 88 | 100 |
| At least associate degree | 44 | 5 | 26 | 57 | 69 |
| Household income supporting 3 or fewer people | 71 | 67 | 72 | 69 | 74 |
| Employed | 73 | 50 | 47 | 89 | 93 |
| No difficulty paying expenses | 25 | 11 | 17 | 22 | 40 |
| High Depressive Symptoms | 37 | 52 | 40 | 34 | 27 |
Figure 1. Mean scores and standard deviations of the Center for Epidemiologic Studies Depression (CES-D) Scale score by life-course mobility in socioeconomic position among SELF Study participants (n=1,612).
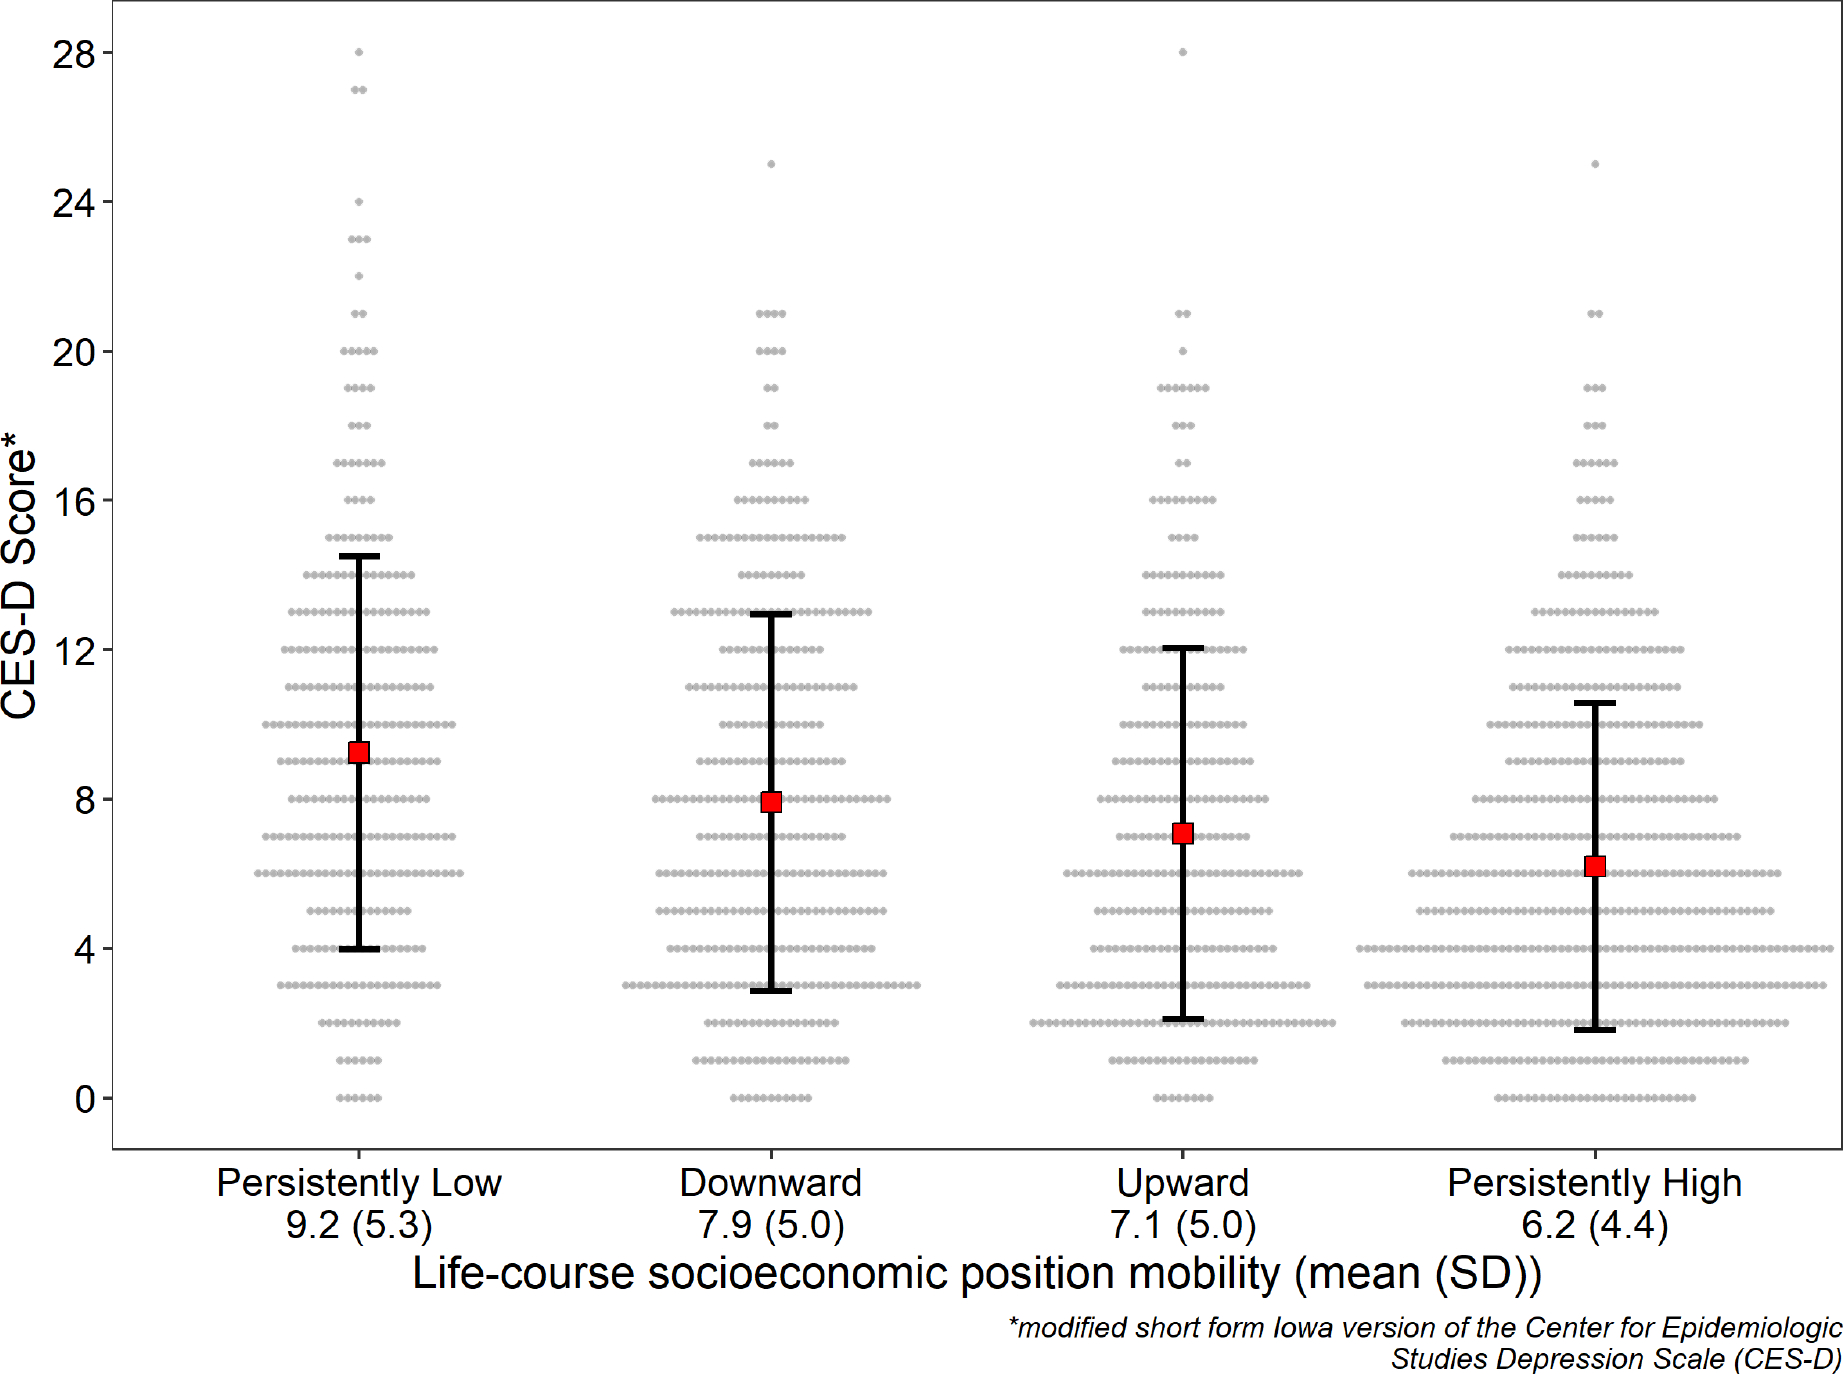
Table 4.
Overall and stratified by adult social support log-risk models for mobility in life-course socioeconomic position (SEP) and depressive symptoms, SELF Study (n=1,612)
| Life-course SEP mobility | Unadjusted | Adjusted1 | Low Adult Social Support2 | High Adult Social Support2 | |||
|---|---|---|---|---|---|---|---|
|
| |||||||
| N (%) | RR (95% CI) | RR (95% CI) | N (%) | RR (95% CI) | N (%) | RR (95% CI) | |
|
| |||||||
| Persistently high (ref) | 569 (35) | 1.00 | 1.00 | 167 (25) | 1.00 | 402 (43) | 1.00 |
| Persistently low | 315(20) | 1.95 (1.65, 2.32) | 1.56 (1.31, 1.86) | 192 (28) | 1.33 (1.08, 1.66) | 123 (13) | 2.26 (1.71, 2.97) |
| Downward | 388 (24) | 1.50 (1.25, 1.79) | 1.36 (1.14, 1.63) | 173 (26) | 1.27 (1.02, 1.60) | 215 (23) | 1.46 (1.10, 1.93) |
| Upward | 340(21) | 1.26 (1.03, 1.54) | 1.15 (0.95, 1.40) | 143 (21) | 1.13 (0.89, 1.44) | 197 (21) | 1.11 (0.80, 1.53) |
RR: risk ratio
Adjusted for age (continuous), adult social support (none of the time, a little of the time, some of the time, most of the time, or all of the time), and marital status (never married/never lived as married, previously married/previously lived as married, or currently married/currently living as married)
Model with interaction term between life-course SEP mobility and adult social support; adjusted for age (continuous) and marital status (never married/never lived as married, previously married/previously lived as married, or currently married/currently living as married); interaction term likelihood ratio test = 11.08 and p-value = 0.01.
Discussion
In this prospective study of young Black women, 37% were classified as having high depressive symptoms (CES-D ≥ 9). Given the negative impact of depression on health and well-being, elucidating how SEP may influence risk of depression is important. All the childhood and adult SEP indicators, except having both parents at home at age 10 and supporting ≤3 people with household income during adulthood, were significantly associated with high depressive symptoms in adulthood. Depressive symptoms were associated with upward life-course SEP mobility, which further supports the Minorities Diminished Return theory. Even Black women who experienced upward SEP mobility exhibited an elevated risk for depressive symptoms compared to Black women with persistently high SEP mobility. This suggests that there may be continued restrictions in access to mental health and financial resources and opportunities for them. Even among the highest educated group (bachelor and/or graduate degree), a larger proportion of participants reported a household income <$50,000 (56.9%) than reported a household income >$50,000 (43%). The strength of the associations between persistently low and downward life-course SEP mobility and high depressive symptoms was stronger among those with high adult social support than among those with low adult social support.
This study is innovative in its use of latent class analysis to evaluate the association between life-course SEP mobility and depression given that previous research has used conventional approaches to derive composite measures of SEP, such as summing across multiple individual indicators of SEP. A Danish study summed SEP scores over three life periods (father’s occupation, participant’s education at age 20, and SEP at age 57) to create a total life-course SEP score (Osler et al., 2015). Similarly, a study in Japan subtracted scores from a five-point Likert scale on childhood and adult SES to measure mobility (Nagamine et al., 2020). A study among participants of the National Longitudinal Study of Adolescent to Adult Health (Add Health Study) in the U.S. utilized dichotomous information on childhood and adult SES to create a four-level social mobility variable (low-low, low-high, high-low, and high-high) (Miller et al., 2020).
Our study yielded similar results as two previous studies in the U.S. that assessed life-course SEP mobility and depression. The Health and Retirement Study (HRS) included White, Black, and Other participants aged 51 and up in the U.S. and created a cumulative disadvantage variable using measures of childhood and adult SES to examine life-course SEP (low-low, high-low, low-high, and high-high) (Kwon et al., 2018). Latent class analysis was implemented to identify depressive symptom (low, declining, increasing, and high and increasing) trajectories from 1998 to 2010 (Kwon et al., 2018). HRS participants with low-low and low-high SEP mobility had significantly increased associations with high and increasing depressive symptoms, with a stronger association in the low-low group (Kwon et al., 2018). The Add Health Study included White and Black participants in the U.S. and assessed socioeconomic conditions and depression among participants, whose average age was 16 and 29 at enrollment and adult health assessment, respectively (Miller et al., 2020). Downward and upward socioeconomic mobility (versus consistently advantaged) were associated with significant depression (CES-D ≥ 16) in the Add Health Study, and downward mobility was more strongly associated.
Adult social support was an effect measure modifier of the association between life-course SEP mobility and depressive symptoms, with a stronger association among those with high versus low adult social support. A previous study among Black Americans in the US similarly reported stronger associations between discrimination and depressive symptoms among those with high social support versus those with low social support (Qin et al., 2020). Some of the potential explanations for this finding included that those who had increased depressive symptoms following discrimination (versus those who did not) may seek social support more often or have greater access to social support. It also was suggested that family and friends who perceive elevated depressive symptoms following discrimination in someone may provide more support than usual (Qin et al., 2020). While these explanations may explain findings in the current study, another potential reason for greater risk of depressive symptoms among those with high adult social support may be due to strain related to social relations that may negatively impact the beneficial aspects of social support. It has been suggested that upward SEP mobility requires also working towards upward social mobility at the individual level, which may also take an emotional toll (Hudson et al., 2016). Findings related to modification of the association by adult social support are limited in that adult social support in this study did not incorporate other forms of support, such as financial and other resources. Future research may assess the extent to which different types of social support are protective against negative outcomes.
Despite the strength of having used latent class analysis to derive a latent class SEP variable, this study had limitations. There is potential for misclassification from self-report of SEP variables, with potential for over- or under-estimation of SEP in childhood and adulthood. However, participants completed the survey using computer-assisted web-based interview technology and were asked income ranges instead of a specific income amount to reduce potential discomfort in disclosing SEP with an interviewer. We were unable to assess the benefit of a supportive childhood environment because over 80% of participants reported being raised in a high childhood supportive environment. Other measures of SEP such as home ownership, debt, and wealth were not assessed. This might have limited our ability to discern nuances related to social support, especially among women and participants assigned female at birth, who tend to have additional support responsibilities. Further, research conducted in other cohorts with wider variation in SEP mobility may provide further insight on the impact of life-course SEP mobility on depressive symptoms. Nevertheless, this study was the first to our knowledge to assess life-course mobility in SEP and depressive symptoms among Black women and effect measure modification by adult social support.
We did not have information on neighborhood level socioeconomic indicators to assess in relation to life-course SEP and depressive symptoms; adjusting for neighborhood level socioeconomic indicators may attenuate or modify the association. It has been previously suggested that economic stressors, such as neighborhood level socioeconomic resources, may be more informative in the association with depression rather than individual SEP for women (Hudson et al., 2012). Future research on this topic could be strengthened with the inclusion of neighborhood level SEP measures. Lastly, this study assessed depressive symptoms instead of diagnosis of depression.
Despite the limitations, there were strengths. The SELF Study has a large sample size, detailed information on covariates, and a validated scale to assess depressive symptoms. We were able to utilize multiple SEP indicators from childhood and adulthood to inform four latent classes of life-course SEP mobility. Additionally, these SEP indicators went beyond traditional SEP measures, such as education and income, and included childhood food insecurity and difficulty paying basic expenses in adulthood.
Implications for Practice and/or Policy
Since elevated associations with high depressive symptoms were observed in all levels of mobility (compared to persistently high life-course SEP mobility) in this study, our results emphasize the potential utility of directing mental health resources to Black women experiencing low SEP at any stage in life, especially those with low SEP in adulthood, to aid in management of these symptoms.
Conclusions
This study among Black women suggests life-course SEP that is persistently low, downward, and upward from childhood to adulthood are associated with high depressive symptoms. There is value in examining childhood SEP in addition to adult SEP as it may identify those who may face the greatest risk of depressive symptoms in adulthood.
Acknowledgements:
This research was funded primarily by an administrative supplement to the parent grant, “Environmental risk factors for uterine fibroids: a prospective ultrasound study (Project# R01ES028235-03S1),” from the extramural program of the National Institute of Environmental Health Sciences and in part by the Uterine Leiomyomas research program (Project# ZIAES049013) in the Intramural Research Program of the National Institute of Health, National Institute of Environmental Health Sciences. The research was also supported by a research grant, “Early reproductive aging: stress and uterine fibroid risk among black women (Project# R21HD105461),” from the extramural program of the Eunice Kennedy Shriver National Institute of Child Health & Human Development. Funding also came from the American Recovery and Reinvestment Act funds designated for National Institute of Health. We also acknowledge the contributions of the Study of Environment, Lifestyle, and Fibroids (SELF) participants and staff. A special thanks to Xiaoxia Han for her early work on the statistical analysis.
Biographies
Opal P. Patel is a doctoral student in the Department of Epidemiology at the University of North Carolina in the Gillings School of Global Public Health with research interests in the area of environmental epidemiology.
Dr. Arbor Quist is an environmental epidemiologist interested in community-driven research that addresses climate and environmental injustice. Arbor recently completed her PhD in epidemiology at the University of North Carolina at Chapel Hill and is now a Postdoctoral Fellow in Environmental Justice & Community-Driven Epidemiology at the University of Southern California.
Dr. Chantel L. Martin is an Assistant Professor in the Department of Epidemiology at the University of North Carolina in the Gillings School of Global Public Health. Her research seeks to uncover social and biological mechanisms of health disparities across the life course.
Dr. Ganesa Wegienka is a Senior Scientist and Epidemiologist in the Department of Public Health Sciences at the Henry Ford Health System in Detroit, MI. Dr. Wegienka’s research interests include causes of pediatric allergic diseases such as allergy and asthma, as well as the racial disparities observed in their occurrence. She also has extensive research in women’s health.
Dr. Donna D. Baird is an Intramural Scientist, Epidemiologist, and head of the Women’s Health Group in the Epidemiology Branch at the National Institute of Environmental Health Sciences. She has extensive experience in studies of reproductive hormones, fertility and early pregnancy, and the natural history of uterine fibroids; methodological expert in longitudinal data analysis, analysis of bias in reproductive outcomes, and research design in reproductive epidemiology.
Dr. Lauren Wise is a Professor in the Department of Epidemiology at Boston University School of Public Health. Her research involves the study of benign gynecologic conditions, delayed conception, and adverse pregnancy outcomes.
Dr. Anissa I. Vines is an Associate Professor in the Department of Epidemiology in the Gillings School of Global Public Health at the University of North Carolina at Chapel Hill. Her research involves the study of the psychosocial determinants of health and their influence on outcomes such as uterine fibroids, cancer disparities, and cardiometabolic conditions. Dr. Vines is particularly interested in stressors across the life course, including racism.
Footnotes
Publisher's Disclaimer: This is a PDF file of an unedited manuscript that has been accepted for publication. As a service to our customers we are providing this early version of the manuscript. The manuscript will undergo copyediting, typesetting, and review of the resulting proof before it is published in its final form. Please note that during the production process errors may be discovered which could affect the content, and all legal disclaimers that apply to the journal pertain.
References
- Anglin DM, Lighty Q, Yang LH, Greenspoon M, Miles RJ, Slonim T, Isaac K, & Brown MJ (2014). Discrimination, arrest history, and major depressive disorder in the U.S. Black population. Psychiatry Research, 219(1), 114–121. 10.1016/j.psychres.2014.05.020 [DOI] [PubMed] [Google Scholar]
- Assari S (2018). Blacks’ diminished return of education attainment on subjective health; mediating effect of income. Brain Sciences, 8(9). 10.3390/brainsci8090176 [DOI] [PMC free article] [PubMed] [Google Scholar]
- Assari S (2019). Race, depression, and financial distress in a nationally representative sample of american adults. Brain Sciences, 9(2). 10.3390/brainsci9020029 [DOI] [PMC free article] [PubMed] [Google Scholar]
- Bailey RK, Mokonogho J, & Kumar A (2019). Racial and ethnic differences in depression: current perspectives. Neuropsychiatric Disease and Treatment, 15, 603–609. 10.2147/NDT.S128584 [DOI] [PMC free article] [PubMed] [Google Scholar]
- Baird DD, Harmon QE, Upson K, Moore KR, Barker-Cummings C, Baker S, Cooper T, & Wegienka G (2015). A Prospective, Ultrasound-Based Study to Evaluate Risk Factors for Uterine Fibroid Incidence and Growth: Methods and Results of Recruitment. Journal of Women’s Health, 24(11), 907–915. 10.1089/jwh.2015.5277 [DOI] [PMC free article] [PubMed] [Google Scholar]
- Brody DJ, Pratt LA, & Hughes JP (2018). Prevalence of Depression Among Adults Aged 20 and Over: United States, 2013–2016. NCHS Data Brief, 303, 1–8. [PubMed] [Google Scholar]
- Budhwani H, Hearld KR, & Chavez-Yenter D (2015). Depression in racial and ethnic minorities: the impact of nativity and discrimination. Journal of Racial and Ethnic Health Disparities, 2(1), 34–42. 10.1007/s40615-014-0045-z [DOI] [PubMed] [Google Scholar]
- Christie-Mizell CA, Talbert RD, Hope AR, Frazier CG, & Hearne BN (2019). Depression and african americans in the first decade of midlife: the consequences of social roles and gender. Journal of the National Medical Association, 111(3), 285–295. 10.1016/j.jnma.2018.10.012 [DOI] [PubMed] [Google Scholar]
- Colen CG, Krueger PM, & Boettner BL (2018). Do rising tides lift all boats? Racial disparities in health across the lifecourse among middle-class African-Americans and Whites. SSM - Population Health, 6, 125–135. 10.1016/j.ssmph.2018.07.004 [DOI] [PMC free article] [PubMed] [Google Scholar]
- Colen CG, Ramey DM, Cooksey EC, & Williams DR (2018). Racial disparities in health among nonpoor African Americans and Hispanics: The role of acute and chronic discrimination. Social Science & Medicine, 199, 167–180. 10.1016/j.socscimed.2017.04.051 [DOI] [PMC free article] [PubMed] [Google Scholar]
- Curry Owens T, & Jackson FM (2015). Examining Life-Course Socioeconomic Position, Contextualized Stress, and Depression among Well-Educated African-American Pregnant Women. Women’s Health Issues, 25(4), 382–389. 10.1016/j.whi.2015.05.001 [DOI] [PubMed] [Google Scholar]
- Detroit has half the median income, three times the poverty rate of nation, new Census numbers show -mlive.com (Aihajal K, Trans.). (2019, January 20). https://www.mlive.com/news/detroit/2012/09/detroit_has_half_the_median_in.html
- Ghafoori B, Barragan B, Tohidian N, & Palinkas L (2012). Racial and ethnic differences in symptom severity of PTSD, GAD, and depression in trauma-exposed, urban, treatment-seeking adults. Journal of Traumatic Stress, 25(1), 106–110. 10.1002/jts.21663 [DOI] [PMC free article] [PubMed] [Google Scholar]
- Hudson DL, Neighbors HW, Geronimus AT, & Jackson JS (2012). The relationship between socioeconomic position and depression among a US nationally representative sample of African Americans. Social Psychiatry and Psychiatric Epidemiology, 47(3), 373–381. 10.1007/s00127-011-0348-x [DOI] [PMC free article] [PubMed] [Google Scholar]
- Hudson DL, Neighbors HW, Geronimus AT, & Jackson JS (2016). Racial discrimination, john henryism, and depression among african americans. The Journal of Black Psychology, 42(3), 221–243. 10.1177/0095798414567757 [DOI] [PMC free article] [PubMed] [Google Scholar]
- Hudson DL, Puterman E, Bibbins-Domingo K, Matthews KA, & Adler NE (2013). Race, life course socioeconomic position, racial discrimination, depressive symptoms and self-rated health. Social Science & Medicine, 97, 7–14. 10.1016/j.socscimed.2013.07.031 [DOI] [PubMed] [Google Scholar]
- Joinson C, Kounali D, & Lewis G (2017). Family socioeconomic position in early life and onset of depressive symptoms and depression: a prospective cohort study. Social Psychiatry and Psychiatric Epidemiology, 52(1), 95–103. 10.1007/s00127-016-1308-2 [DOI] [PMC free article] [PubMed] [Google Scholar]
- Kwon E, Kim B, Lee H, & Park S (2018). Heterogeneous trajectories of depressive symptoms in late middle age: critical period, accumulation, and social mobility life course perspectives. Journal of Aging and Health, 30(7), 1011–1041. 10.1177/0898264317704540 [DOI] [PubMed] [Google Scholar]
- McKnight-Eily LR, Presley-Cantrell L, Elam-Evans LD, Chapman DP, Kaslow NJ, & Perry GS (2009). Prevalence and correlates of current depressive symptomatology and lifetime diagnosis of depression in Black women. Women’s Health Issues, 19(4), 243–252. 10.1016/j.whi.2009.04.003 [DOI] [PubMed] [Google Scholar]
- Miller GE, Chen E, Yu T, & Brody GH (2020). Youth who achieve upward socioeconomic mobility display lower psychological distress but higher metabolic syndrome rates as adults: prospective evidence from add health and MIDUS. Journal of the American Heart Association, 9(9), e015698. 10.1161/JAHA.119.015698 [DOI] [PMC free article] [PubMed] [Google Scholar]
- Nagamine Y, Fujiwara T, Tani Y, Murayama H, Tabuchi T, Kondo K, & Kawachi I (2020). Gender difference in the association between subjective socioeconomic mobility across life course and mortality at older ages: results from the JAGES longitudinal study. Journal of Epidemiology / Japan Epidemiological Association, 30(11), 497–502. 10.2188/jea.JE20190083 [DOI] [PMC free article] [PubMed] [Google Scholar]
- National Institute of Mental Health. (2019). Major Depression. https://www.nimh.nih.gov/health/statistics/major-depression.shtml
- Osler M, Bruunsgaard H, & Lykke Mortensen E (2015). Lifetime socio-economic position and depression: an analysis of the influence of cognitive function, behaviour and inflammatory markers. European Journal of Public Health, 25(6), 1065–1069. 10.1093/eurpub/ckv134 [DOI] [PubMed] [Google Scholar]
- Qin W, Nguyen AW, Mouzon DM, Hamler TC, & Wang F (2020). Social support, everyday discrimination, and depressive symptoms among older african americans: A longitudinal study. Innovation in Aging, 4(5), igaa032. 10.1093/geroni/igaa032 [DOI] [PMC free article] [PubMed] [Google Scholar]
- Ruiz M, Hu Y, Martikainen P, & Bobak M (2019). Life course socioeconomic position and incidence of mid-late life depression in China and England: a comparative analysis of CHARLS and ELSA. Journal of Epidemiology and Community Health, 73(9), 817–824. 10.1136/jech-2019-212216 [DOI] [PubMed] [Google Scholar]
- Torres E (2012). Psychometric properties of the Center for Epidemiologic Studies Depression Scale in African American and Black Caribbean US adults. Issues in Mental Health Nursing, 33(10), 687–696. 10.3109/01612840.2012.697534 [DOI] [PMC free article] [PubMed] [Google Scholar]
- World Health Organization. (2020, January 30). Depression. https://www.who.int/news-room/fact-sheets/detail/depression