Abstract
Wood is a biosourced material with unique aesthetic features due to its anatomy and chemical composition. White oak wood surface color can be modified with the use of iron salts, which react with wood phenolic extractives, present as free molecules in wood porous structure. The impact of modifying wood surface color with iron salts on the final appearance of wood, including its color, grain contrast and surface roughness, was evaluated in this study. Results showed that following the application of iron (III) sulphate aqueous solutions on white oak wood surface, its roughness increased, which is due to grain raising after wetting of wood surface. The color modification of wood surface with iron (III) sulphate aqueous solutions was compared with a non-reactive water based blue stain. The contrast associated to wood grain that was expressed by the standard deviation of luminance values in wood images, also increased after application of the iron (III) sulphate aqueous solution on white oak wood surface. The comparison of contrast changes showed that wood samples stained with iron (III) sulphate on their curved surface had the highest increase in grain contrast compared to iron-stained wood showing the straight grain and to wood surfaces colored by a non-reactive water-based stain for both curved and straight grains.
Keywords: ferric sulphate, grain raising, luminance photo contrast, surface color change, white oak wood
1. Introduction
Wood is a biosourced material with unique aesthetic features that render it attractive for use in both outdoor and indoor settings. For example, it can be used for the fabrication of furniture, tables, flooring, home decor and many more applications. Each wood species possesses a characteristic appearance, which is due to variations of wood cell types and extractives composition, which are non-structural compounds present in wood porous structure (Royer et al. 2012). Wood anatomy vary also among different wood species, which results in different aesthetic traits depending on the species. This natural appearance of wood material makes it aesthetically appealing for consumers. Studies have shown that wood is perceived by consumers as warm, inviting and relaxing (Jonsson 2008; Rice et al. 2007). Ikei et al. (2017) have shown that being exposed to wood by visual, tactile or olfactory stimulations result in a physiological relaxing effect (Ikei et al. 2017).
In order to modify the color of wood surface, stains and pigments are commonly used for application on wood surface. However, the application of pigments on wood surface renders its color more homogenous and hides the natural traits of wood grain depending on the concentration and quantity of the products applied on wood’s surface. Due to environmental concerns, water-based coatings and coloring systems are increasingly preferred in order to decrease the release of volatile organic compounds (COV) (Jiménez-López and Hincapié-Llanos 2022; Landry et al. 2010). However, water-based stains are also known to cause raising of wood fibers, which impacts the roughness and final appearance of wood surface (Landry et al. 2013). Researchers suggested that the occurrence of raised grain after wetting of the surface is due to cell damage caused by surface machining then subsequent swelling (in particular of hydroxyl groups rich polysaccharides, notably of cellulose) and shrinkage deformations of the upper layer of wood, which results in fibre separation and permanent deformation of wood surface (Evans et al. 2017; Magoss et al. 2019; Singh et al. 2010). The occurrence of grain raising phenomenon and its extent depends on different factors including the type of wood species, its density and the grit size used during the sanding process (Evans et al. 2017). One approach matched that used by industries to solve the problem of grain raising, i.e. by adding a ‘denibbing’ step to the processes to remove the raised grain before applying a subsequent layer of coating (Ramananantoandro et al. 2018). Landry et al. (2013) compared the application of water-based and solvent-based stains on yellow birch wood samples and concluded that the final appearance is affected by different factors including the grain raising, the sanding quality and the type of substrate. These authors also observed that the application of solvent-based stains results in a better grain contrast compared to water-based stains. Therefore, there is a need to develop coloring systems for wood surfaces which are water based, that avoid raising of wood fibers and that would preserve the natural grain appearance of wood material.
Aqueous solutions of iron salts can be applied to wood surface to modify its color due to the chelation of iron cations by wood phenolic extractives. After application of iron salts solutions to wood surface, cells containing the phenolic extractives will be intensely colored. Phenolic extractives are not present homogenously in all wood cells (Donaldson et al. 2019; Kuroda et al. 2014; Romagnoli et al. 2013) and therefore, the cells that contain higher quantity of phenolic extractives will be accentuated from the rest of the wood surface by this method of color modification. This technique can potentially increase the grain contrast of colored wood compared to wood colored by non-reactive water-based systems. In a previous study (Dagher et al. 2020), the color development on wood surface by iron (III) sulphate application have been compared for four different hardwood species which are commonly used for interior applications (white oak, red oak, sugar maple and yellow birch). White oak (Quercus alba Linnaeus) showed the highest color development among the studied wood species and the total color change of wood surface was correlated with phenolic OH present in the ethanolic extracts of white oak, as it was determined by phosphorus-31 nuclear magnetic resonance (NMR) analysis and color measurements. In this paper, a method for evaluating the grain contrast of wood surface is reported in order to compare the contrast before and after modification of wood color by application of an aqueous solution of iron (III) sulphate. The impact of applying these water-based systems on wood surface appearance including specifically its color, surface roughness and grain color contrast is evaluated in this study.
2. Materials and methods
2.1. Samples preparation
Iron (III) sulphate pentahydrate (97%) was purchased from Acros Organics (Ottawa, Canada) and aqueous solutions of iron (III) sulphate were prepared at 1% w/v in distilled water. A blue water-based stain and white oak wood (Quercus alba Linnaeus) samples were provided by Boa-Franc S.E.N.C. (Saint-Georges, Canada). Wood boards were previously air dried to reach 20–25% moisture content and then dried around 15 days in a drying chamber to attain 7–8% moisture content. The maximum temperature reached during the drying process was ±74 °C. Wood samples were then stored in a conditioning room at 20 °C and 42% relative humidity (RH). Two batches of wood samples were prepared for this study.
First batch was used for roughness measurements: fifteen wood samples were cut to surface dimensions of 10 cm × 8.5 cm then sanded with aluminum oxide abrasive papers of different grit sizes in the following sequence: P60, P80, P120, P150 and P180. The samples were randomly chosen and included samples cut in different grain directions. Two coats of stain solutions were applied on wood surface manually by using a foam roller applicator and then dried at room temperature.
Second batch was used for color and contrast measurements: in this batch, two groups of thirteen wood samples each were chosen according to the direction of the longitudinal cut of wood samples. Samples that were cut tangentially to the annual rings and perpendicular to the rays show a curved grain pattern which we refer to as CG in this manuscript. Samples that show a straight grain will be referred to as SG. All wood samples in this batch were cut to surface dimensions of 8.7 cm × 12 cm then sanded with aluminum oxide abrasive papers of different grit sizes in the following sequence: P120, P150 and P180. One coat of stain solutions was applied successively on wood surface manually by using a foam roller applicator and then dried at room temperature. The samples were then kept in a conditioning room (20 °C and 42% RH) before further analysis.
2.2. Wood surface roughness: profile measurements
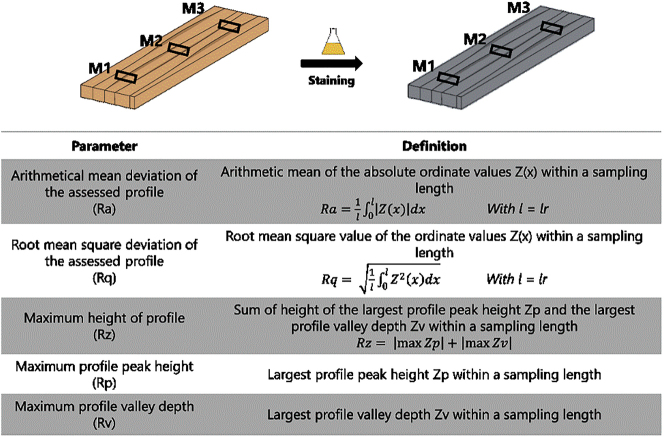
Surface roughness measurements were carried out using a Contour GT-I model optical profilometer from Bruker Optics Inc. (Billerica, United States). Three measurements were performed on each wood sample before and after stain application (Figure 1). Vertical scanning interferometry (VSI) mode, green laser and 5x magnification lens were used for the measurements. The surface was measured perpendicular to the grain on a 12.5 mm width × 1 mm height surface (stitching mode with 20% overlap) and profile roughness parameters were extracted. The profile roughness parameters Ra, Rq, Rz, Rp and Rv were chosen as the combination of the parameters to provide a comprehensive assessment of the profile change including the maximum height, the deepest valley and the mean deviation of the wood profile due to grain raising. The choice of parameters was also based on their use in the literature in order to allow us to compare the results with previous studies (Cool 2011; Fernando de Moura and Hernández 2006, 2005; Gurau et al. 2006). The data treatment and calculation of roughness parameters were performed on Vision 64 software (version 5.70). Before calculating the roughness parameters, a filter was applied to remove the form errors and the waviness from the profile. The Robust Gaussian Regression Filter (RGRF) has been chosen since it causes less distortion than the standard Gaussian filter (Gurau et al. 2006). Recommendations of the sampling lengths and cut off wavelengths are provided in the ISO 4288:1996 according to the Ra and Rz amplitudes (Technical Committee : ISO/TC 213 1996). Different cut-off lengths have been used in the literature for the evaluation of sanded wood surfaces (Gurau and Irle 2017; Kilic et al. 2006). Gurau et al. (2006) suggested the 2.5 mm cut-off length to be used with the robust Gaussian regression filter for the analysis of wood surfaces sanded with the common P120 and P180 grit sizes. In this study, zero-order robust Gaussian regression filter was applied with a cut-off length λ c of 2.5 mm.
Figure 1:
Definitions of profile parameters from ISO 4287:1997. With lr, sampling length of the roughness profile, Z(x), ordinate value, Zp, profile peak height, Zv, profile valley depth. M, measurement.
2.3. Wood surface color: color measurements and microscopic observations
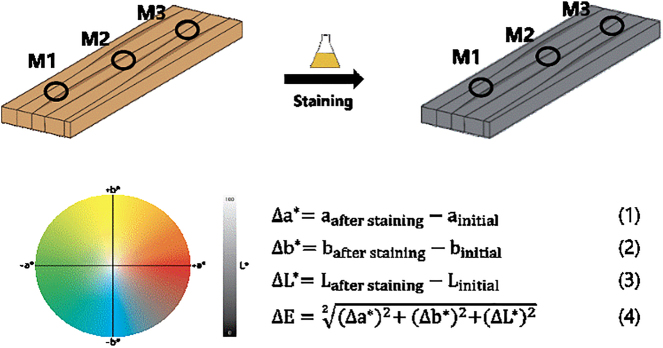
The colored wood surface was evaluated by two methods. Quantitative evaluation was performed by color measurements on each sample using a Ci6x model X-rite spectrophotometer (Grand Rapids, United States). Three measurements were performed on each sample with a standard illuminant D65, an angle observation of 10° in SPIN mode. Measurements before and after staining were performed on the same location on the sample (Figure 2). L*, a* and b* coordinates from the CIEL*a*b* color system (Robertson 1977) were used respectively to follow the color changes on the lightness, red/green and yellow/blue axis. Equations (1)–(4) (Figure 2) were used to calculate the color change on each axis and the total color change. In order to evaluate visually the colored wood cells, microscopic observations were performed by using a digital microscope Keyence VHX-7000 model. Observations were performed on wood samples directly and on thin wood sections. To prepare thin wood sections, unstained wood was immerged in a mixture of 60 mL water and 10 mL of ethanol (95%) solution and stained wood was immerged directly in the aqueous solution of iron (III) sulphate at 1% w/v. Thin cross sections of 20–30 μm were cut using a manual microtome with a razor blade then deposed between glass slides for observation under the microscope.
Figure 2:
Color measurements method with CIEL*a*b* color space. L*, a* and b* represent the lightness, green/red and blue/yellow axis, respectively. M, measurement.
2.4. Wood grain contrast: image acquisition and analysis
In order to evaluate if the grain contrast on wood surface decreased or increased by the two studied color modification methods, color contrast evaluations were also performed. When describing visual contrasts, two different contrasts should be distinguished: achromatic and chromatic contrast. Achromatic contrast refers to differences occurring in luminance values or gray level and chromatic contrast refers to differences in chromaticity (Witzel and Gegenfurtner 2015). Luminance is a quantity that is characteristic to human vision and is computed as a weighted sum of red (R), green (G), and blue (B) components. The ratios of R, G and B components in a pixel determine the color of the pixel (Liu and Yan 1994). In order to evaluate the contrast intensity, greyscale images can be used since they do not produce subjective response of the eye compared to the chromatic contrast (Demers and Arch 2007). Therefore, in this study, for objective comparison of the contrast intensity on wood surfaces, images are compared by measuring the luminance contrast of the scanned images of wood.
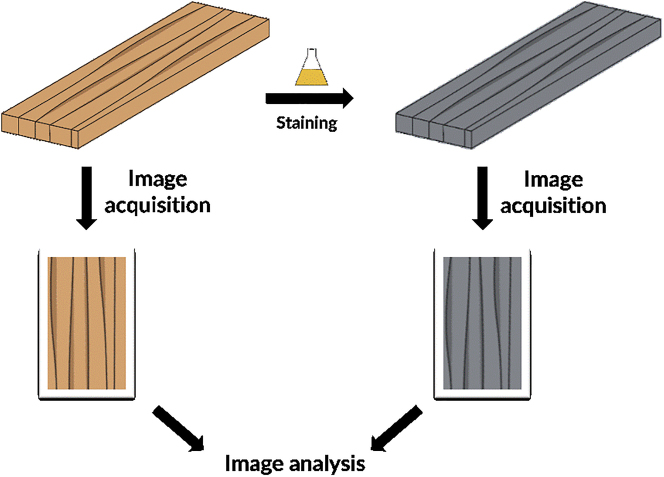
Wood samples were scanned using a La1600+ scanner from Regent Instruments Inc. (Québec, Canada) with 1200 dpi resolution. Adobe Photoshop CS6 (version 13.0 x64) was used to obtain the statistical information of the images: mean, median, pixels and standard deviation of luminance values. Wood surface was selected by applying a mask on the image and the luminosity histogram was obtained for the selected region of interest (Figure 3). Image statistical values of mean, median, standard deviation and pixels number were obtained for each image. Pixel’s value represents the total number of pixels used to calculate the histogram. Mean represents the average intensity value of luminance of the region of interest. Median value is the middle value in the range of intensity values of the region of interest. Standard deviation (STDEV) value represents how widely intensity values of luminance vary in the region of interest of the image (Photoshop).
Figure 3:
Method for calculating grain contrast for wood samples before and after staining.
3. Results and discussion
3.1. Wood surface roughness
Wood surface profile measurements were performed across the grain to evaluate the roughness changes on wood surface after staining. The variations of the maximum peak height (Rp) and the maximum valley depth (Rv) within the sampling length are represented in Figure 4. The results show that only the maximum peak height increased significantly (p value = 0.002) but not the peak valley depth (p value = 0.48). The increase of the peak height is therefore the result of rising of grain fibers after wetting of wood surface. Evans et al. (2017) showed that the slivers of cell wall material that rose after wetting of the surface with distilled water were mainly aligned along the fibers direction, even though some of them were bent tangentially to the fibers. Therefore, the rising of fibers would increase the peak height by profile measurements across the grain, as demonstrated by the results of Rp parameter.
Figure 4:
Variations of Rp (left) and Rv (right) parameters before and after staining wood samples with iron (III) sulphate aqueous solution. Results of the statistical Student’s t-test are included on the left top of each graph.
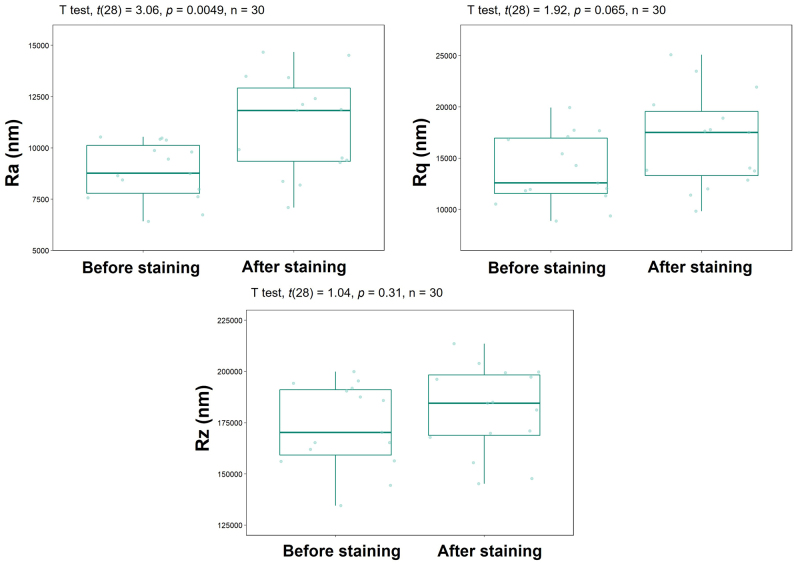
Figure 5 shows the results of Ra, Rq and Rz roughness parameters obtained for samples measured before and after staining. Ra parameter increased significantly after staining according to the Student’s t-test (p value = 0.0049). Rq and Rz parameters also increased after staining, however the increase is not significant according to statistical analysis (p value = 0.065 for Rq and p value = 0.31 for Rz). The significant increase of Ra confirms the increase of peak height of the profile, which would influence the arithmetic mean of the absolute ordinate values within a sampling length. Rz parameter, which is the sum of the height of the largest profile peak height and the largest valley depth within a sampling length, was less affected by grain raising than Ra. The Rq parameter, which is the mean square root of the ordinate values within the sampling length, also increased insignificantly which could indicate that the majority of the fibers rose on the surface of wood in a uniform way.
Figure 5:
Variations of Ra, Rq and Rz roughness parameters before and after staining wood samples with iron (III) sulphate aqueous solutions. Results of the statistical Student’s t-test are included on the left top of each graph.
Several surface roughness parameters, which could be used to quantify the roughness increase of wood surface due to grain raising phenomenon, have been reported in the literature. In the study of Ramananantoandro et al. (2018), the roughness parameters Sa, Sq, Spk and Vmp were found to be best correlated with tactile evaluation although all the correlations were weak. The authors suggested that the raised grain perception is related to material volume of the peak section and not only to the peak height. Evans et al. (2017) used the areal (3D) Sa parameter, which is the arithmetic mean of the absolute of the ordinate values within a definition area, to quantify the grain raising. In this study, the arithmetic mean average profile (2D) roughness (Ra) was most affected by grain raising after wetting of wood surface. It was also shown in the literature that the grain raising occurs more often in plainsawn wood samples compared to quartersawn wood (Williams et al. 2000). The results in this study show that grain raising occurred on white oak wood surfaces after staining with the iron (III) sulphate aqueous solutions, which could impact the appearance of wood and the acceptability by the consumers.
3.2. Wood surface color
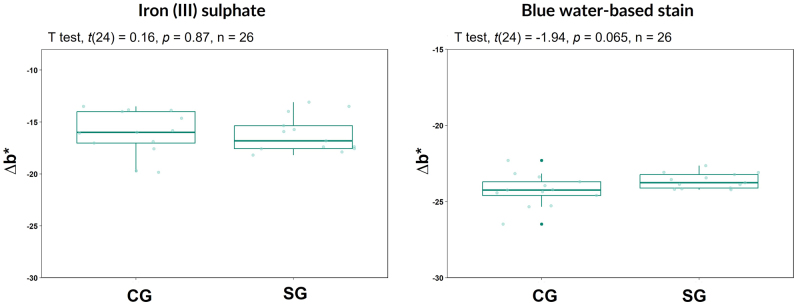
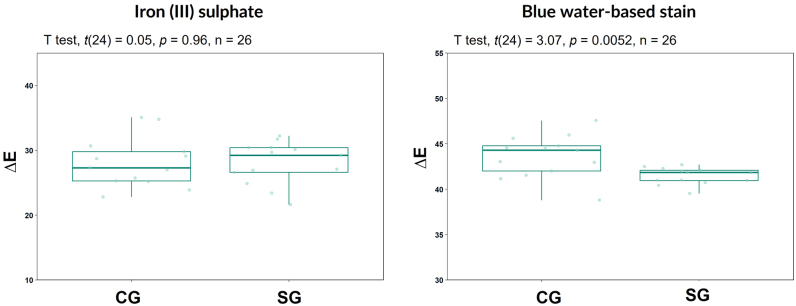
The color change on wood surface is expressed by the change in the coordinates L*, a* and b* from the CIEL*a*b* color space. Results show negative values of Δb* (Figure 6), which are lower for the water-based stain for both CG and RG samples, indicating that the color of wood surface became bluer on the yellow/blue axis following the application of both color modification methods. Total color change of wood surface is expressed by ΔE values (Figure 7), which was higher for water-based blue stain compared to wood samples colored by iron (III) sulphate. The high value of the average total color change (ΔE) of stained wood surfaces shows that the surface color of wood was modified, and the color difference is highly perceptible. The color measurement results also showed a higher variation between the measurements of the iron-stained surfaces compared to the surfaces that were stained with a blue water-based stain. This higher variation on iron-stained surfaces is due to the inhomogeneous presence of phenolic extractives in wood cells and therefore to the inhomogeneous color modification of wood surface.
Figure 6:
Comparison of the color change on the yellow/blue axis of the CIEL*a*b* color space (Δb*) for wood samples stained with iron (III) sulphate aqueous solutions and a blue water-based stain for two types of wood cut showing the curved grain (CG) and the straight grain (SG). Results of the statistical Student’s t-test are included on the left top of each graph.
Figure 7:
Comparison of the total color change on the CIEL*a*b* color space (ΔE) for wood samples stained with iron (III) sulphate aqueous solutions and a blue water-based stain for two types of wood cut showing the curved grain (CG) and the straight grain (SG). Results of the statistical Student’s t-test are included on the left top of each graph.
3.2.1. Microscopic observations on colored wood boards and thin sections
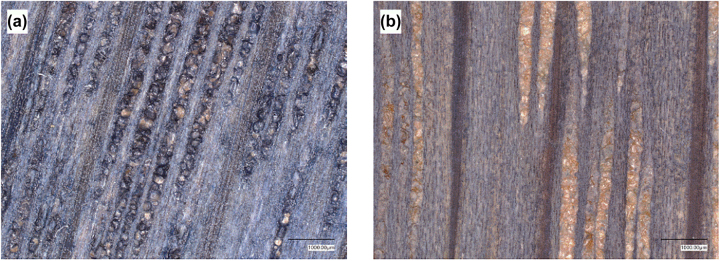
Figure 8 shows the microscopy images of two wood samples stained with a water based blue stain (a) and an iron (III) sulphate aqueous solution (b). The images show that the rays of wood are more intensely colored compared to the rest of the wood surface and the large open pores of oak wood are not stained for the iron-stained wood surface. For wood samples colored by the non-reactive water based blue stain, the opposite appearance is obtained with intensely colored pores compared to the rest of the wood surface. Previous studies in the literature determined the location of extractives in wood cells and showed that extractives are more present in parenchyma cells (Barnett 2004) but can also be found in vessels and fibers (Hillis 1971). Extractives are present in capillaries of cell walls and not only the lumens (Hillis 1971). It is suggested that extractives are formed in situ in parenchyma cells and then transferred to vessels, fibers and tracheids by pit membranes and plasmodesmata (Sachs et al. 1966). In the study of Koch et al. (2003), it was found that drying method can also affect the migration of water soluble phenolic extractives from vacuoles of parenchyma cells into the lumina of vessels and fibers. White oak wood possesses very large rays parenchyma that are visible on all surfaces of wood (Wheeler 2001) and longitudinal parenchyma cells which are paratracheal and apotracheal (Bajpai 2018).
Figure 8:
Microscopic photos taken directly on wood surface stained with a water-based blue stain (a) and an iron (III) sulphate aqueous solution (b).
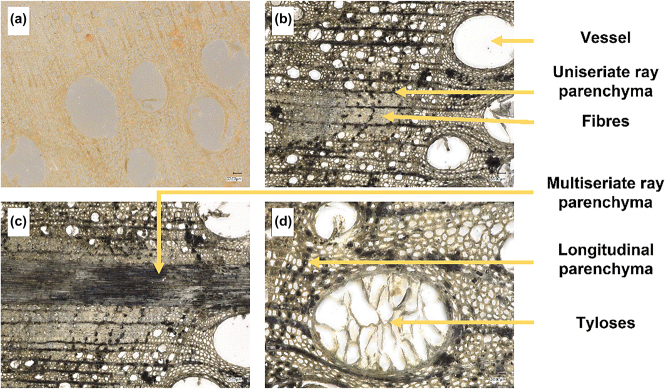
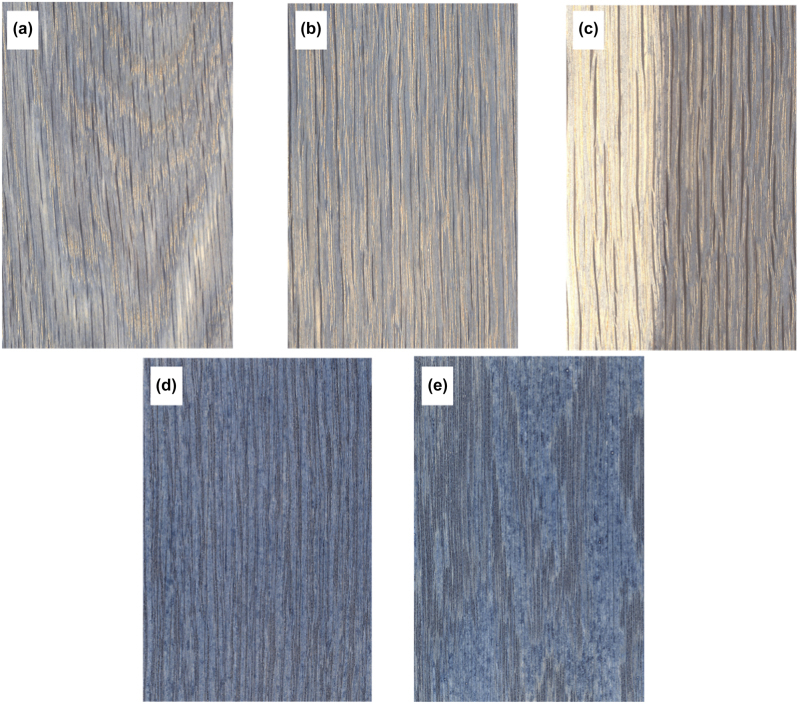
Images obtained with a light microscope of thin wood sections of white oak stained with iron (III) sulphate (Figure 9) show that rays and longitudinal parenchyma cells were more intensely stained than the rest of the sample. Moreover, earlywood vessels in white oak possess tyloses which are overgrowths of the protoplast of adjacent living parenchymatous cells (Agrios 2005) and these lower the permeability of wood (Wheeler 2001). Tyloses are considered to be due to gas embolism, which occurs during drought or in response to wounding (Barnett 2004). Another observation that could influence the grain contrast between stained wood samples is the presence of parts of both sapwood and heartwood in the same wood board. Figure 10c shows the image of a wood sample that contains both heartwood and sapwood which is shown by the difference of color modification after staining the surface of wood with iron (III) sulphate aqueous solution since the concentration of phenolic extractives is generally higher in heartwood compared to sapwood (Dagher et al. 2020). This appearance is not obtained with nonreactive water-based blue stains since the color modification is not dependent on the chemical composition of wood and is only obtained by the presence of pigments in the stain product.
Figure 9:
Photos of thin wood cross sections observed on a digital light microscope of (a) unstained wood and (b, c, d) wood stained with iron (III) sulphate aqueous solutions.
Figure 10:
Photos of wood samples stained with iron (III) sulphate aqueous solution (a, b and c) and a blue water-based stain (d and e). The wood samples show the curved grain (a and e) and the straight grain (b, c and d). The wood sample on photo (c) shows the difference in color modification of both the sapwood and the heartwood.
3.3. Wood grain contrast
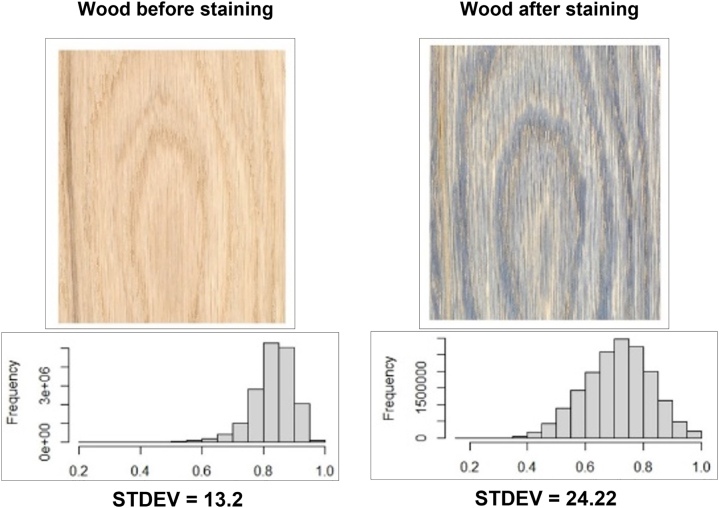
In this study, the contrast was calculated by the standard deviation of the luminance in the image histogram, which represents luminance values frequencies in the image (Asamoah et al. 2018). Figure 11 shows an example of luminance histograms of grayscale images of unstained wood (left image) and wood stained with a ferric salt aqueous solution (right image). There are different methods available to calculate the contrast in an image. For example, Michelson contrast is appropriate for an image with periodic structures (Moulden et al. 1990). For aperiodic stimuli, root mean square (RMS) contrast, which is based on the standard deviation of luminance in the stimulus, is often used (Bhuiyan and Khan 2018; Kukkonen et al. 1993). For random dot images, the standard deviation of the luminance values of pixels in images in greyscale was used to evaluate the contrast intensity (Moulden et al. 1990) and to evaluate the contrast in images of architectural spaces for daylighting studies (Demers and Arch 2007). When higher precision is needed, standard deviation of luminance method for contrast evaluation should be considered only for histograms with normal distribution (Demers and Arch 2007).
Figure 11:
Example of luminance histograms of grayscale images of a plainsawn wood sample before and after staining with a ferric sulphate aqueous solution obtained through Imager package in RStudio software (Barthelmé and Tschumperlé 2019) and luminosity standard deviation (STDEV) values obtained by adobe photoshop software (Photoshop). The X axis of the histogram shows the different luminance values which are rescaled from 0 to 1 with the left edge corresponding to the lowest value and the right edge to the highest (Barthelmé and Tschumperlé 2019).
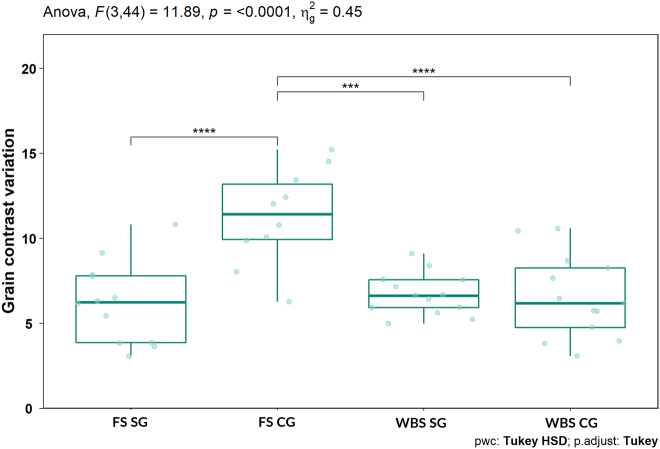
Image statistics of all samples including mean, median, pixels and standard deviation are presented in Table 1. Contrast, as expressed by standard deviation (STDEV) of luminance values in the images, increased in average after staining of wood samples with both iron (III) sulphate and water based blue stain as shown in Figure 12. The increase of grain contrast compared to noncolored wood was the highest for the wood samples showing the curved grain and colored by the iron (III) sulphate solution (FS CG), compared to the other types of wood evaluated and statistically different by ANOVA test (p value lower than 0.05).
Table 1:
Image statistics from luminosity histograms of images of wood samples scanned before and after staining with iron (III) sulphate (FS) aqueous solution and a water-based stain (WBS).
| Before staining | After staining | |||||||
|---|---|---|---|---|---|---|---|---|
| Mean | Median | Pixels | STDEV of luminance values | Mean | Median | Pixels | STDEV of luminance values | |
| FS SG | 200 ± 6 | 201 ± 6 | 211,125 | 12.6 ± 2 | 154 ± 13 | 153 ± 12 | 211,125 | 20 ± 8 |
| FS CG | 205 ± 11 | 205 ± 11 | 211,125 | 12 ± 3 | 168 ± 16 | 166 ± 16 | 211,125 | 28 ± 11 |
| WBS SG | 199 ± 5 | 200 ± 5 | 211,125 | 12 ± 1 | 108 ± 5 | 109 ± 5 | 211,125 | 19 ± 1 |
| WBS CG | 205 ± 14 | 206 ± 14 | 211,125 | 12 ± 2 | 115 ± 6 | 116 ± 6 | 211,125 | 19 ± 2 |
RG, straight grain; CG, curved grain; STDEV, standard deviation.
Figure 12:
Wood surface contrast variation for wood samples showing straight grain (SG) and curved grain (CG) separately and stained by iron (III) sulphate aqueous solutions (FS) and a water-based blue stain (WBS).
This higher difference can be due to two reasons. First, wood surface appearance differs depending on the direction in which a lumber was cut (Shmulsky and Jones 2019). Different directions of cutting of wood samples show wood cells in a different way, which results in different aesthetics and performance of plainsawn and quartersawn wood boards. For example in plainsawn wood boards, the large difference between earlywood and latewood is more apparent (Williams et al. 2000). The difference in color development between different wood cells results in higher contrast in stained wood samples compared to unstained samples. Therefore, the resulting appearance obtained with the application of iron (III) sulphate aqueous solutions to wood surface differs from the appearance obtained by coloration of wood with pigments. When using pigments to stain wood, higher concentrations of pigments are found in vessels and therefore the vessels are more intensely colored than the rest of the surface (Landry et al. 2013). These differences are mainly visible on the curved surface of white oak wood compared to the straight grain surface due to the large vessels in its porous structure. However, with the use of iron (III) sulphate aqueous solutions, the opposite result is obtained. In addition, when using pigments to color wood, both sapwood and heartwood are stained equally in contrast to the color development with iron (III) sulphate color system.
4. Conclusions
White oak wood surface color can be modified using iron (III) sulphate aqueous solutions. In this study, the resulting appearance of stained wood and the impact of the coloring method on the natural grain contrast and surface roughness of wood were evaluated. The results of this study showed that the staining with aqueous ferric salt solution method for wood color modification significantly increased the surface roughness, as demonstrated by the roughness parameter Ra calculated from the profilometry measurements. Grain contrast was evaluated by image analysis and the results showed that the contrast associated to the natural grain pattern of wood was enhanced after color modification by iron (III) sulphate aqueous solutions and by a non-reactive water-based blue stain. In order to quantify the changes in wood colour, the method of colour measurements is vastly used in the literature, which is not enough to take into consideration the overall appearance of wood surface. In this study, the interest of using contrast measurements expressed by the standard deviation of luminance values in wood images, was applied in order to quantify the overall change in wood appearance, following the use of different staining methods. The combination of color and grain contrast measurements provides a comprehensive analysis of the final wood surface appearance following the application of different staining methods. Differences in color modification of wood surfaces were observed between different wood cells and between heartwood and sapwood parts of wood samples. When using pigments to stain wood, higher concentrations of pigments are found in vessels and therefore the vessels were more intensely colored than the rest of the surface. However, with the use of iron (III) sulphate aqueous solutions, the opposite result is obtained, and the rays are more intensely colored than the rest of the wood surface, which make the appearance of colored wood different between the two methods. In addition, when using pigments to color wood, both sapwood and heartwood are stained equally in contrast to the color development with iron (III) sulphate color system. Therefore, the application of iron (III) sulphate aqueous solutions for color modification of wood samples can better enhance the contrast of wood natural traits compared to non-reactive water-based stains when applied to wood samples showing the curved grain.
Footnotes
Author contributions: All the authors have accepted responsibility for the entire content of this submitted manuscript and approved submission.
Research funding: This work was supported by the Natural Sciences and Engineering Research Council of Canada (NSERC) through the IRC program and the industrial partners of NSERC/Canlak Industrial Research Chair in Interior Wood Products Finishes (CRIF) Canlak, Boa-Franc, EMCO-Inortech and Canadel (grant no. IRCPJ 514918-16). The authors acknowledge the support provided by a student scholarship from the Spark of Hope foundation and would like to also thank the Quebec Center for Advanced Materials (CERMA) and Renewable Materials Quebec (MRQ).
Conflict of interest statement: The authors declare no conflicts of interest regarding this article.
References
- Agrios G.N. How plants defend themselves against pathogens. In: Agrios G.N., editor. Plant pathology. 5th ed. Academic Press; Massachusetts: 2005. pp. 207–248. [Google Scholar]
- Asamoah D., Ofori E., Opoku S., Danso J. Measuring the performance of image contrast enhancement technique. IJCA. 2018;181:6–13. doi: 10.5120/ijca2018917899. [DOI] [Google Scholar]
- Bajpai P. Biermann’s handbook of pulp and paper. Volume 1: raw material and pulp making. Elsevier; Amsterdam: 2018. [Google Scholar]
- Barnett J.R. Tree physiology | xylem physiology. In: Burley J., editor. Encyclopedia of forest sciences. Elsevier; Oxford: 2004. pp. 1583–1590. [Google Scholar]
- Barthelmé S., Tschumperlé D. Imager: an R package for image processing based on CImg. J. Open Source Softw. 2019;4:1012. doi: 10.21105/joss.01012. [DOI] [Google Scholar]
- Bhuiyan A.-A., Khan A.R. Image quality assessment employing RMS contrast and histogram similarity. Vol. 15. IAJIT; Zarqa: 2018. p. 7. [Google Scholar]
- Cool J. Optimisation de l’usinage de finition du bois d’épinette noire pour fins d’adhésion. Université Laval; Quebec: 2011. [Google Scholar]
- Dagher R., Landry V., Stevanovic T. Contribution to understanding the color development on wood surfaces treated with iron salts by a combination of analytical methods. J. Wood Chem. Technol. 2020;40:1–12. doi: 10.1080/02773813.2020.1745845. [DOI] [Google Scholar]
- Demers C., Arch M. Conference proceedings of the American solar energy society (ASES) solar 2007 . American Solar Energy Society (ASES); 2007. A classification of daylighting qualities based on contrast and brightness analysis. [Google Scholar]
- Donaldson L.A., Singh A., Raymond L., Hill S., Schmitt U. Extractive distribution in Pseudotsuga menziesii: effects on cell wall porosity in sapwood and heartwood. IAWA J. 2019;40:721–740. doi: 10.1163/22941932-40190248. [DOI] [Google Scholar]
- Evans P.D., Cullis I., Kim J.D.W., Leung L.H., Hazneza S., Heady R.D. Microstructure and mechanism of grain raising in wood. Coatings. 2017;7:135. doi: 10.3390/coatings7090135. [DOI] [Google Scholar]
- Fernando de Moura L., Hernández R.E. Evaluation of varnish coating performance for two surfacing methods on sugar maple wood. Wood Fiber Sci. 2005;37:355–366. [Google Scholar]
- Fernando de Moura L., Hernández R.E. Evaluation of varnish coating performance for three surfacing methods on sugar maple wood. For. Prod. J. 2006;56:130–136. [Google Scholar]
- Gurau L., Irle M. Surface roughness evaluation methods for wood products: a review. Curr. For. Rep. 2017;3:119–131. doi: 10.1007/s40725-017-0053-4. [DOI] [Google Scholar]
- Gurau L., Mansfield-Williams H., Irle M. Filtering the roughness of a sanded wood surface. Holz als Roh-Werkst. 2006;64:363–371. doi: 10.1007/s00107-005-0089-1. [DOI] [Google Scholar]
- Hillis W.E. Distribution, properties and formation of some wood extractives. Wood Sci. Technol. 1971;5:272–289. doi: 10.1007/BF00365060. [DOI] [Google Scholar]
- Ikei H., Song C., Miyazaki Y. Physiological effects of wood on humans: a review. J. Wood Sci. 2017;63:1–23. doi: 10.1007/s10086-016-1597-9. [DOI] [Google Scholar]
- Jiménez-López A.M., Hincapié-Llanos G.A. Identification of factors affecting the reduction of VOC emissions in the paint industry: systematic literature review – SLR. Prog. Org. Coating. 2022;170:106945. doi: 10.1016/j.porgcoat.2022.106945. [DOI] [Google Scholar]
- Jonsson O. Consumer perceptions and preferences on solid wood, wood-based panels, and composites: a repertory grid study. Wood Fiber Sci. 2008;40:663–678. [Google Scholar]
- Kilic M., Hiziroglu S., Burdurlu E. Effect of machining on surface roughness of wood. Build. Environ. 2006;41:1074–1078. doi: 10.1016/j.buildenv.2005.05.008. [DOI] [Google Scholar]
- Koch G., Puls J., Bauch J. Topochemical characterisation of phenolic extractives in discoloured beechwood (Fagus sylvatica L.) De Gruyter. 2003;57:339–345. doi: 10.1515/HF.2003.051. [DOI] [Google Scholar]
- Kukkonen H., Rovamo J., Tiippana K., Näsänen R. Michelson contrast, RMS contrast and energy of various spatial stimuli at threshold. Vis. Res. 1993;33:1431–1436. doi: 10.1016/0042-6989(93)90049-3. [DOI] [PubMed] [Google Scholar]
- Kuroda K., Fujiwara T., Hashida K., Imai T., Kushi M., Saito K., Fukushima K. The accumulation pattern of ferruginol in the heartwood-forming Cryptomeria japonica xylem as determined by time-of-flight secondary ion mass spectrometry and quantity analysis. Ann. Bot. 2014;113:1029–1036. doi: 10.1093/aob/mcu028. [DOI] [PMC free article] [PubMed] [Google Scholar]
- Landry V., Blanchet P., Vaillancourt É. Reducing VOC emissions in the furniture and cabinets industries: an opportunity for hybrid coating systems. Bioresources. 2010;5:770–779. [Google Scholar]
- Landry V., Blanchet P., Cormier L.M. Water-based and solvent-based stains: impact on the grain raising in yellow birch. Bioresources. 2013;8:1997–2009. doi: 10.15376/biores.8.2.1997-2009. [DOI] [Google Scholar]
- Liu N., Yan H. Improved method for color image enhancement based on luminance and color contrast. J. Electron. Ind. 1994;3:190–197. doi: 10.1117/12.173323. [DOI] [Google Scholar]
- Magoss E., Molnár Z., Suri V., Fuchs I. Evaluating of wetting-induced effects on the surface stability of sanded wood. Wood Res. 2019;64:401–410. [Google Scholar]
- Moulden B., Kingdom F., Gatley L.F. The standard deviation of luminance as a metric for contrast in random-dot images. Perception. 1990;19:79–101. doi: 10.1068/p190079. [DOI] [PubMed] [Google Scholar]
- Ramananantoandro T., Eyma F., Belloncle C., Rincé S., Irle M. Effects of machining parameters on raised grain occurring after the application of water-based finishes. Wood Fiber Sci. 2018;76:1323–1333. doi: 10.1007/s00107-017-1250-3. [DOI] [Google Scholar]
- Rice J., Kozak R.A., Meitner M.J., Cohen D.H. Appearance wood products and psychological well-being. Wood Fiber Sci. 2007;38:644–659. [Google Scholar]
- Robertson A.R. The CIE 1976 color-difference formulae. Color Res. Appl. 1977;2:7–11. doi: 10.1002/j.1520-6378.1977.tb00104.x. [DOI] [Google Scholar]
- Romagnoli M., Segoloni E., Luna M., Margaritelli A., Gatti M., Santamaria U., Vinciguerra V. Wood colour in Lapacho (Tabebuia serratifolia): chemical composition and industrial implications. Wood Sci. Technol. 2013;47:701–716. doi: 10.1007/s00226-013-0534-y. [DOI] [Google Scholar]
- Royer M., Houde R., Viano Y., Stevanovic T. Non-wood forest products based on extractives - a new opportunity for the Canadian forest industry. Part 1: hardwood forest species. JFR. 2012;1:8. doi: 10.5539/jfr.v1n3p8. [DOI] [Google Scholar]
- Sachs I.B., Ward J.C., Bulgrin E.H. Heartwood stain in red oak. Holz als Roh-Werkst. 1966;24:489–497. doi: 10.1007/BF02612881. [DOI] [Google Scholar]
- Shmulsky R., Jones P.D. Forest products and wood science: an introduction. 7th ed. John Wiley & Sons; Hoboken: 2019. [Google Scholar]
- Singh A., Dawson B., Hands K., Ward J., Greaves M., JCP T., Rickard C. The anatomy of raised grain on Pinus radiata weatherboards. IAWA J. 2010;31:67–76. doi: 10.1163/22941932-90000006. [DOI] [Google Scholar]
- Technical Committee : ISO/TC 213 . ISO Standards. Geneva; Switzerland: 1996. ISO 4288:1996 Geometrical Product Specifications (GPS) — Surface texture: Profile method — Rules and procedures for the assessment of surface texture . [Google Scholar]
- Wheeler E. Wood: macroscopic anatomy. In: Buschow K.H.J., Cahn R.W., Flemings M.C., Ilschner B., Kramer E.J., Mahajan S., Veyssière P., editors. Encyclopedia of materials: science and technology. Elsevier; Oxford: 2001. pp. 9653–9657. [Google Scholar]
- Williams R.S., Jourdain C., Daisey G.I., Springate R.W. Wood properties affecting finish service life. J. Coating Technol. 2000;72:35–42. doi: 10.1007/BF02698003. [DOI] [Google Scholar]
- Witzel C., Gegenfurtner K. Chromatic contrast sensitivity. In: Luo R., editor. Encyclopedia of color science and technology . Berlin/Heidelberg: Springer; 2015. pp. 1–7. [Google Scholar]


