

Summary
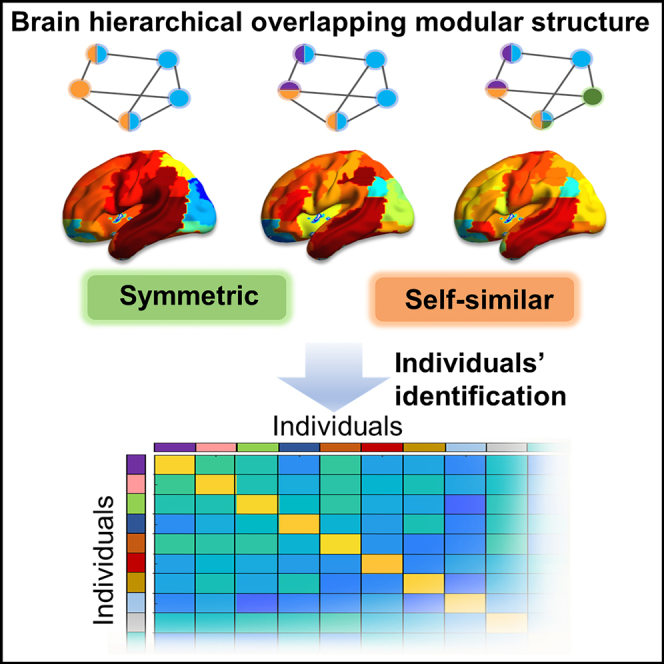
The idea that brain networks have a hierarchical modular organization is pervasive. Increasing evidence suggests that brain modules overlap. However, little is known about the hierarchical overlapping modular structure in the brain. In this study, we developed a framework to uncover brain hierarchical overlapping modular structures based on a nested-spectral partition algorithm and an edge-centric network model. Overlap degree between brain modules is symmetrical across hemispheres, with highest overlap observed in the control and salience/ventral attention networks. Furthermore, brain edges are clustered into two groups: intrasystem and intersystem edges, to form hierarchical overlapping modules. At different levels, modules are self-similar in the degree of overlap. Additionally, the brain’s hierarchical structure contains more individual identifiable information than a single-level structure, particularly in the control and salience/ventral attention networks. Our results offer pathways for future studies aimed at relating the organization of hierarchical overlapping modules to brain cognitive behavior and disorders.
Subject areas: Systems neuroscience, Cognitive neuroscience
Graphical abstract
Highlights
-
•
Edge-centric and NSP algorithms reveal hierarchical overlapping modules
-
•
Overlapping modular structure is self-similar across different hierarchical levels
-
•
Hierarchical structure improves individual identifiability
-
•
CON and VAN contribute the most overlap and individual’s difference
Systems neuroscience; Cognitive neuroscience
Introduction
The brain is a complex and sophisticated system that is organized at multiple spatial scales to support diverse cognitive functions, including perception, decision-making, and action.1,2 Using the correlation between brain region activity that is usually called functional connectivity obtained from functional magnetic resonance imaging (fMRI), the brain system can be represented from the network perspective.3 Network analysis has revealed that brain functions are governed and shaped by topological principles, such as modularity, small-worldness, and rich-clubs.4 Modularity is an important feature of brain functional networks to trade off efficient information processing and economical metabolic costs of wiring.5,6 This structure allows functional segregation and integration in brain functional organization, which contributes to diverse cognitive functions. Moreover, abnormalities in this structure are related to multiple brain disorders.7,8 In addition, recent studies have found that the modules of brain functional networks are hierarchically organized with small modules nested in large modules.9,10 This hierarchical structure contributes to increased robustness, adaptivity, evolvability, and functional diversity in the brain.11,12 However, the organizing principles of integrating small modules into large modules in the hierarchical modular structure of brain networks remain unclear.
At the functional system scale, the multimodal association cortex appears to be partitioned into more submodules than the occipital system.13,14,15 The network hubs, which play a key role in intermodule connectivity, are also concentrated in association cortical areas.15 These evidences suggest that hierarchical modular organization is associated with the brain activity features of different systems. However, in the standard procedure to analyze modular brain structure, the whole brain network is partitioned into nonoverlapping modules, and each region only participates in one single module. In fact, brain regions could be activated by a diverse range of cognitive tasks.16 There is an increasing realization that brain regions belong to several modules simultaneously.17,18 Recent studies have also provided more evidence that module overlap is not only dense and pervasive in the brain but also individual and state (i.e., task or rest, healthy or disorder) dependent.17,18,19,20 However, research on the organizing principles of overlapping modules in hierarchical structures is lacking.
To address these questions, it is necessary to extend overlapping module analysis to the hierarchical modular structure and to study the hierarchical overlapping modular structure of the brain network. Currently, many algorithms have been proposed to uncover the overlapping modules in the brain network, such as the extended Newman’s modularity approach,21 fitness function optimization approach,22 and matrix factorization approach.18 Recently, an edge-centric (eFC) model has been proposed for representing pairwise functional interactions among a network’s edges.19 By partitioning links of an eFC network into several modules, the edges belonging to the same region can be assigned to multiple modules. The regional overlapping modules are obtained when mapping edge modules back to their respective regions.
In addition, the hierarchical modular structure can be effectively detected using a nested-spectral partition (NSP) method.11,23,24 The NSP method can partition a brain network into multiple modules at different levels based on eigenmodes that enable us to track the detailed changes in the organization of overlapping modules across hierarchical levels.
In this study, we revealed the basic organizing principles of brain hierarchical overlapping modules and explored their effects on individual identification. Hierarchical overlapping modules were analyzed based on the NSP algorithm and eFC network using the resting-state fMRI dataset of 110 healthy adults (age: 21–50 years). We first investigated the distribution of the degree of overlap across multiple hierarchical levels of the brain. Second, we extracted the integrating rule of overlapping modules from high-order levels to low-order levels (or the segregation rule from the low levels to the high levels). Finally, we tested whether hierarchical overlapping modular structures could improve the identification of individuals.
Results
Hierarchical overlapping modular structure of brain networks
Many studies have revealed that brain networks are organized as a hierarchical modular structure.11,12,25 Here, we first constructed eFC networks using fMRI data. Unlike traditional node-centric (nFC) networks, where nodes represent brain regions and edges represent functional interactions between pairs of brain regions, the eFC network considers interactions not between pairs of brain regions but between pairs of edges. The eFC can be calculated in three steps. The first step is to z-scoring the regional blood-oxygen-level-dependent (BOLD) time series. Next, we calculate the element-wise product of the z-score time series of pairs of brain regions. This gives rise to a new set of time series, whose elements represent the amplitude of instantaneous co-fluctuations between two brain regions. The final step involves calculating the element-wise product between the new time series obtained in the second step. This results in the matrix of the eFC network when repeated over all pairs of edges (Figure 1A and STAR Methods).
Figure 1.

Flowchart of constructing nFC and eFC networks and detecting modules across hierarchical levels
(A) The BOLD time series of regions were used to construct nFC and eFC networks. To evaluate eFC, the BOLD time series was first z-scored, and element-wise production was computed. Then, the values of a product across time were averaged as eFC.
(B andC) Left panels: hierarchical modular structures detected by the NSP method in nFC and eFC networks. The connecting density within modules was greater than that between modules at the same level, and the weights of intramodule connections at each level were significantly greater than those of intermodule connections (see Figure S1). Right panels: the eigenvectors of the first four functional modes of the nFC and eFC networks. The modules in each level are differentiated by colors.
Then, we partitioned the networks into hierarchical modules based on the NSP method. The NSP algorithm first calculates the eigenvalues and eigenvectors of the network and then detects hierarchical modules according to the eigenvectors that were sorted in descending order of eigenvalues (see STAR Methods). In the hierarchical modular structure, the lower level contains a small number of large modules, and the higher level contains a large number of small modules. In Figures 1B and 1C, we show the hierarchical modular partition in nFC and eFC networks (bounded by red or yellow dotted lines with each other). The elements in the first eigenvector having the same sign suggest that the whole network is the largest module in the first level. The largest module is then partitioned into two modules in the second level according to the positive and negative signs of elements in the second eigenvector. The two modules are further divided into four small modules in the third level based on the signs of the third eigenvector. As the partition process moves forward, the nFC and eFC networks can be decomposed into nested modules at different levels. It is clear that the connecting density within modules was higher than that between modules at the same level (Figures 1B and 1C), and the weights of intramodule connections at each level were significantly higher than those of intermodule connections (Figure S1). Thus, the NSP method can effectively detect the hierarchical modules in both nFC and eFC networks.
Different edge modules partitioned by the NSP in eFC networks may comprise edges from the same node. Mapping edge modules back to regions in nFC networks and extracting regions that were linked by the edges within an edge module can reveal the overlapping modular structure (Figure 2A). The normalized entropy that accounts for the distribution of edge module assignments was calculated to assess module overlap.19 Here, we partitioned the brain according to two parcellation atlases: 1) 90 regions with the automated anatomical labeling (AAL) atlas,26 and 2) 100 regions with the Schaefer 100-parcel atlas.27 The results of the AAL atlas are presented in the main text, and the results of the Schaefer atlas are given in the supplemental information.
Figure 2.

Consistency between nFC modules and eFC modules
(A) A toy diagram revealing overlapping modules. The graph contains five nodes (depicted as yellow circles) and seven edges. The edges were partitioned into two edge modules (three edges in the blue module and four edges in the purple module). Then, edge modules were mapped back to node modules according to which regions were noted at the endpoints of each edge. The overlapping structure is more clearly presented in node view. The number of colors represents the number of modules in which the node participates, and the distribution of colors represents the distribution of edges between modules. The more evenly the edges are distributed in the module, the greater the entropy of nodes.
(B) Similarity between nFC modules and eFC modules. The similarity was measured by computing the proportion of intersected nodes between the eFC and nFC modules.
Although eFC is constructed using a different processing mode, it is related to nFC. We tested whether the organization of modules in the eFC network was replicable from the nFC network. This is an important question to test the reliability of the overlapping structures of modules revealed by eFC. We measured the proportion of regions that intersected between the nFC modules and eFC modules. However, a direct comparison of eFC and nFC modules is unavailable due to the differences in module size. We can compare the similarity using the following steps. First, we sorted regions according to their participation degree in the eFC module and controlled the same regional number with that in a comparable nFC module by deleting those regions with a low participation degree. Second, the proportion of the intersected region between the eFC and nFC modules was calculated to measure the similarity. In the similarity matrix, the diagonal values were significantly higher than others (Figure 2B). Specifically, the highest value of the three diagonals was 0.94, and the lowest value was 0.55. Thus, each eFC module has the highest similarity with the corresponding nFC modules, suggesting consistency between the eFC and nFC modules.
Organizing principle of hierarchical overlapping modules
The organization of nonoverlapping modules in the brain functional network revealed by traditional approaches is closely associated with several well-known cognitive subsystems.28 Regions within the same subsystem tend to participate in the same module. These observations have prompted the hypothesis that the organizing principle of modular structure is deeply associated with brain function. Previous studies on single-level overlapping modular structures have shown that each pair of brain subsystems interacts with each other through at least two distinct edge modules.29 Furthermore, module overlap varies across brain functional subsystems,27 and heteromodal systems exhibited greater complexity in terms of module overlap than sensorimotor systems.29 However, whether hierarchical overlapping modules have a similar structure among hierarchical levels and whether the organizational property of hierarchical overlapping modules is specific to functional subsystems remain unknown. Thus, it is necessary to conduct a detailed study on the diversity of module overlaps between subsystems and the principles of the segregation (or integration) of overlapping module structures across hierarchical levels. Here, we address those questions by analyzing overlapping modules level-by-level in great detail.
We first calculated the entropy of each region at different hierarchical levels to show its distribution in the brain. On the whole-brain scale, we observed that the distribution of entropy was symmetric between the left and right hemispheres at low-order levels (Figures 3A and 3B), as indicated by the correlation of entropy between the left and right hemispheres of the eFC network (Figure 3C). Symmetry remains when large modules are partitioned into small modules with increasing level (Figure 3D). These results are consistent with a nFC network study showing that the module affiliation of regions has hemispheric symmetry.30
Figure 3.

Symmetry between the left and right hemispheres of entropy
(A) Bar plots of region entropy from the second to fourth hierarchical levels. The regions were sorted from the left hemisphere to the right hemisphere symmetrically.
(B) Spatial patterns of region overlap entropy corresponding to the second, third, and fourth levels. A full view of these patterns is shown in Figure S2.
(C) Correlation of entropies between the left and right hemispheres of the eFC network corresponding to the second, third, and fourth levels.
(D) Correlation coefficients of entropies between the left and right hemispheres at different levels.
The entropy reflects the uniformity of the distribution of eFC module assignments. If a region participates in every eFC module on average, it has the highest entropy. Conversely, if a region affiliates with only one eFC module, it has the lowest entropy. Previous studies showed that entropy was greatest within primary sensory and attentional systems19,29; thus, we studied the homogeneity of entropy in subsystems across multiple levels. We found that the overlapping modular structure was pervasive across brain regions and levels, but the entropies of regions were significantly distinct (Figure 4A, the results of Schaefer 100 parcellation shown in Figure S4). Regions on the control and salience/ventral attention subsystems have high entropy across multiple successive levels (shown in Figure 4A with red rectangles), and regions on the visual subsystem alternated between high entropy and low entropy (shown in Figure 4A with blue rectangle). We next showed region’s entropy within seven intrinsic functional subsystems31 of three levels in Figure 4B. The results showed that entropy was not uniformly distributed across subsystems (Figure 4C takes the second level, for example. Two-sample t-test, p < 0.05, see Table S1). By calculating the standard deviation of entropy within each subsystem, we found that the diversity of entropies within default mode and sensorimotor networks was greatest. Meanwhile, the control and salience/ventral attention networks centralized regions in high entropy (Figure 4B). Entropy concentrating in high values suggests that these subsystems more widely interact with other subsystems. Surrogate networks generated by randomizing the connections exhibited uniform entropies over the whole network, and each node had great entropy (Figure S3).
Figure 4.

Heterogeneity of entropy in the seven subsystems
(A) Entropy involves all brain regions across hierarchical levels. Regions in red rectangles exhibit high entropy across levels, and regions in the blue rectangle have alternating high and low entropy across levels.
(B) Left panel: heterogeneity entropy distribution of different subsystems (two-sample t-test, p < 0.05, see Table S1). Right panel: the standard deviation of entropy within each subsystem.
(C) Top panel: spatial pattern of the seven brain subsystems. Bottom panel: spatial pattern of nodes’ overlap entropy corresponding to the second level.
The edge modules can be positioned for distinct functional classes according to the subsystems that they linked.29 We next investigated the principle for the integration of high-level small modules into low-level large modules from the perspective of edge module classification. We first subdivided the brain subsystems into two groups: the heteromodal system, including the control (CON), default mode (DMN), dorsal attention (DAN), limbic (LIM), and salience/ventral attention networks (VAN); and the sensorimotor system, which comprises the somatomotor (SMN) and visual (VIS) subsystems. Then, the edges can be further subclassified into two communities based on the subsystems that they link: the intra-edges that link regions within heteromodal or sensorimotor system, and the inter-edges that link heteromodal and sensorimotor systems (Figure 5, results of Schaefer 100 parcellation shown in Figure S5). We found that one of the two edge modules in the second level comprised mostly inter-edges (the left panel of the second level in Figure 5), and the other included disproportionately many intra-edges (the right panel of the second level in Figure 5). When edge modules at the second level were further subdivided into four modules at the third level and more modules at the fourth level, these small modules could still be divided into two groups based on the proportion of intra- and inter-edges. As shown in Figure 5, modules in the blue box have a high proportion of inter-edges, and modules in the yellow box have a high proportion of intra-edges. These results indicate that edge modules tend to be clustered together with the same type edges (i.e., intra- or inter-edges) when small modules are integrated into large modules.
Figure 5.

Organization of edge modules at different levels
The top panel shows the largest module at the first level. The seven subsystems were classified into two groups: the heteromodal system (CON, DMN, DAN, LIM, and VAN) and the sensorimotor system (SMN and VIS). Then, edges were defined as intra- or intersystem edge. Edge modules in the second–fourth levels are shown. The bar plots depict the percentage of the intra- (or inter-) edge in one module.
Although the edge modules prefer to integrate with similar modules, the basic properties of overlapping eFC modules when they are broken into modules at a high level remain unknown. For example, do modules at different levels have similar overlapping structures? How do hierarchical overlapping modules contribute to information integration and segregation? To investigate these questions, we defined the local entropy. Local entropy measures the entropy of regions on two modules in the same level that are separated from the same module in the upper level (Figure 6A). This local measurement estimates local overlapping structures and is estimated on multiple levels. As shown in Figure 6B, each pair of modules in each level had several regions with high local entropy, indicating that these regions distribute their edges evenly across the pair of modules (results of Schaefer 100 parcellation shown in Figure S6). This phenomenon was similar for different levels. These results indicated that the internal structure and complexity of hierarchical overlapping eFC modules are similar even though low-order levels have larger modules and high-order levels have small modules. Furthermore, the subsets of high local entropy regions at different levels were composed of different regions (Figure 6C).
Figure 6.

Local entropy of eFC modules across hierarchical levels
(A) The difference between global entropy and local entropy. The graph has two edge modules (blue and purple) in the first level. The purple module was subdivided into two submodules (orange module and purple module) in the second level. The local entropy was calculated by counting the distribution of edges within the orange and purple modules, which were separated from the same purple module in the first hierarchical level.
(B) Distribution of local entropies on multiple levels. Red markers denote regions with local entropy greater than 0.99.
(C) The allocation of regions with high local entropy on the first six levels. Notably, there are two, four, eight, and sixteen modules in the second, third, fourth, and fifth levels, respectively. Each pair of modules has one set of local entropies. Therefore, there are one, two, four, and eight columns of local entropies in the second, third, fourth, and fifth levels, respectively.
In summary, these findings indicate that the overlapping modular structure of the brain functional network was hemispherically symmetrical across hierarchical levels but was system specific. We also found that the edge modules were hierarchically organized into two groups: one group dominated by inter-edges and the other dominated by intra-edges. More importantly, the overlapping modules on different hierarchical levels exhibited similar local behavior with local entropy.
Hierarchical overlapping modular structure improves individual identification
The group-level results reveal the mean and collective characters of the brain network. However, brain functional organization is individually personalized and idiosyncratic.32,33,34 Recently, several important studies have begun focusing on individual-specific factors and aim to understand individuals’ brains.35,36,37 We next studied whether the hierarchical modular structure could supply more contribution to individual identification.
Hierarchical structures of the brain contain high-dimensional information and are difficult to compare directly between individuals. The basic hypothesis of individual identifiability is that an individual’s module overlapping structure should be more similar within the same individual across hierarchical levels than between different individuals. A previous study showed that, to a great extent, higher individual identifiability makes it easier to robustly identify individual “targets” from a sample database.38 We quantified individual identifiability using the measure “differential identifiability” (Idiff), which is calculated as the mean within-individuals similarity of regional entropies between hierarchical levels minus the mean between-subject similarity (see STAR Methods and Figure 7). The higher the Idiff, the better will be the identifiability of individuals.
Figure 7.

Schematic of differential identifiability in entropy
To calculate Idiff, the correlations between entropies within individuals (Iself) and between individuals (Iothers) were computed, resulting in the entropy correlation matrix. Idiff is calculated as the mean within-individual correlations minus the mean between-individual correlations.
We first focused on the individual similarity across hierarchical levels. As a comparison, we also used the k-means clustering algorithm to acquire overlapping modular structures with different k values. Although the k-means clustering algorithm obtains similar module partitioning results in the specified k-value order,29 the difference between the NSP method and the k-means clustering algorithm is that the modules from the NSP method have a clear order between the levels, that is, higher-order submodules can only be a subset of edges in lower-order modules. This order is seen as the hierarchical information contained in the hierarchical module structure. As the level increases, the number of edge modules acquired by the NSP algorithm is 2, 4, 8, 16, and 32, and we also set k in the k-means algorithm to vary by 2, 4, 8, 16, and 32. Figure 8A shows the difference in estimating individual similarity between the single-level modular structure divided by the NSP and k-means clustering algorithm (two-sample t-test, p < 0.0001, results of Schaefer 100 parcellation shown in Figure S7). The results reveal that the overlapping modular structure divided by the k-means clustering algorithm has less individual similarity compared with that obtained using the NSP method. In other words, the modular structures detected by the NSP algorithm did not perform better than the traditional k-means clustering algorithm on individual identification at the single level.
Figure 8.

Hierarchical modular structure enhances individual identification
(A) Individual similarity revealed by entropy on a single level detected using the k-means clustering and NSP algorithms.
(B) Idiff calculated from hierarchical levels (Hdiff) and a single level (Sdiff). The results of hierarchical levels represent stacking levels partitioned by the NSP method, and the results of a single level were computed by stacking multiple levels with different k values of the k-means clustering algorithm. (Two-sample t-test p values, ∗p < 0.0001).
(C) Difference between Hdiff and Sdiff. Black short lines represent the mean values.
(D) Idiff values of hierarchical levels for seven brain systems. The control and salience/ventral attention networks exhibited high individual identifiability.
We next introduce the hierarchical information by stacking multiple hierarchical levels, and study the influence of hierarchical modular structure on individuals’ differential identifiability by calculating the correlation between entropies of different hierarchical levels within an individual. In Figure 8B, the results of stacking the 2, 3, 4, and 5 levels are presented. The results of hierarchical levels were computed by stacking levels that were partitioned using the NSP algorithm, and the results of a single level were computed by stacking the results of the k-means clustering algorithm with different k values. Individual identification was improved when the brain overlapping modular structure was integrated across hierarchical levels (Figure 8B). The Idiff values of hierarchical levels (Hdiff) were higher than those of single levels (Sdiff), implying that the inherent hierarchical structures of brain networks revealed more significant differences between individuals’ properties (two-sample t-test, p < 0.0001). More importantly, entropies became more similar between regions in higher levels due to more small modules (Figure 4A), and Idiff decreased as the number of stacked levels increased. However, we found that the difference between Hdiff and Sdiff was not significantly reduced when the number of stacked levels increased (Figure 8C). We next tested which brain subsystem significantly contributes to individual identification. As shown in Figure 8D, regions located in the control and salience/ventral attention networks yielded high Idiff, which is consistent with a previous study.39
In summary, we investigated the results of individual identifiability in brain overlapping modular structures on a single level and hierarchical levels. We found that the hierarchical overlapping modular structures can enhance individual identification. Furthermore, the control and salience/ventral attention regions have the greatest contribution to individual identification in the brain.
Discussion
Here, we investigated the hierarchical overlapping modular organization of brain functional networks and its effect on individual identification. We constructed eFC networks by focusing on edge-edge interactions and revealed overlapping modules by mapping eFC networks back to nFC networks. Furthermore, hierarchical organizations were obtained using an NSP method. We found that the degree of overlap was distributed symmetrically among brain hemispheres and peaked in the control and salience/ventral attention networks. In hierarchical modules, the edges linking the same type of systems (heteromodal or sensorimotor system) tended to integrate into a community, whereas the edges connecting different systems tended to be integrated. Furthermore, the overlapping modules have similarity structures at different levels. Finally, we showed that brain hierarchical organization revealed more differences between individuals than the single-level structure, and control and salience/ventral attention networks had high individual identifiability.
Hierarchical modular organization and overlapping modules represent the intrinsic structures of the human brain.9,15,17,18 A key open problem is how the brain combines hierarchy and overlap to optimize information processing. On the whole-brain level, we found that the degree of overlap was symmetrically distributed across hemispheres. In previous studies, nonoverlapping modules have always involved symmetrically distributed regions across hemispheres.15,40 The membership or entropy of overlapping modules was also symmetrical in general.17,19 These results coincided with the fact that brain modules are clustered and consistent with the known functional brain subsystems.41 More importantly, our hierarchical analysis suggested that hemispheric symmetry survived at multiple levels. Indeed, brains are anatomically connected with self-similarity at multiple scales and work at scale-free dynamics.42,43 The self-similarity of brain overlapping modular organization between hierarchical levels is congruent with other intrinsic self-similarity features of the brain. Multiscale self-similarity implies a reduction of structure complexity and is related to the need for economical brain network organization.
The economical brain network reduces wiring costs by controlling the roles of different nodes. Hub regions, which are thought to play pivotal roles in the coordination of information flow in a network, may be classified as connector or provincial hubs. Connector hubs with many intermodule connections are responsible for functional integration and global information processing, whereas provincial hubs with mostly intramodule connections support functional segregation and specialized information processing.5,44 Our results indicated that some regions connect multiple modules evenly on each level and play as connector hubs in promoting the integration of global information processing. However, the level-dependence of entropy indicated that regions play different roles in different hierarchical levels. At the high level, the provincial hubs with low entropy inside the large modules at the low level can become the local connector hubs with high entropy in the small module structure. This organizing principle is conducive to the balance of information integration and separation at different scales and the formation of both an economic and an efficient network structure.9,11
In addition to economic benefits, brain dynamical self-similarity relates to the spontaneous balance between integration and segregation.45 The hierarchical overlapping modular structures were found to exhibit self-similarity with local entropy at multiple levels. These self-similarity structures formed with each pair of overlapping local modules sharing several regions with high local entropy. High local entropy suggests that regions participate in two modules equally and benefit to integrate the two modules. In contrast, low local entropy indicates that a region’s participation is concentrated on one of the two modules and contributes to segregation from each other. We found that the distribution of local entropies exhibited several regions with excessively high entropy and some regions with extremely low entropy. The self-similarity of local entropy implies that the brain functions at an intermediate balance state by maintaining both the integration ability to collective information between modules and segregation ability to diverse processing information. The balance between integration and segregation as well as hierarchical connectome modes are essential for the diversity of brain cognitive function.11,23,46,47 Furthermore, the subset of regions with high local entropy contained brain regions that were significantly different between levels. This finding indicates that different brain regions are responsible for local information integration within modules of different scales, which also explained why entropy was level dependent. Our results further verified the brain self-similarity but extended it to the hierarchical overlapping modular structure.
Edge-centric networks have revealed that edge modules are diverse across brain functional systems.29 Edge modules code co-fluctuation patterns of high-order interregional communication. Our findings suggest that edge modules of hierarchical levels partitioned using the NSP method can be referred to as two groups when large modules were divided into small modules. One group had a greater proportion of edges linking heteromodal systems to other heteromodal systems or linking sensorimotor systems to other sensorimotor systems, and the other included a greater proportion of edges linking heteromodal systems to sensorimotor systems. The separation of edges between heteromodal and sensorimotor systems from other edge modules implies that the interplay between heteromodal and sensorimotor systems is functionally segregated. In particular, in semantic processing, brain regions of heteromodal systems play a role by storing particular combinations of sensorimotor features.48
To examine the effects of hierarchical overlapping modular structures on individual identification, we adopted the measurement of differential identifiability,49 which involves the difference between the similarity of hierarchical structures within and between individuals. In hierarchical levels detected using the NSP method, the overlapping modular structures of high levels were derived from and limited by low levels.11 In contrast, the overlapping modular structures detected by the k-means clustering algorithm with different k values had no direct interplay with each other and no hierarchical information. We found that although the overlapping modular structure of single levels detected using the NSP method reported fewer personal peculiarities; structures that stack multiple levels with hierarchical information can describe more individual differences than structures that stack multiple levels without hierarchical information. These observations imply that hierarchical structures significantly improve individual identification. Furthermore, we found that control and salience/ventral attention networks contribute the most to individual identifiability among brain systems. This result agrees with the other recent analysis with eFC in which the removal of regions or edges from higher-order systems led to significant reductions in individual difference.39 These findings also support the earlier results with nFC, suggesting that brain regions of heteromodal systems drive individual identification compared to sensorimotor systems.38 Combined with the previous results that brain regions associated with control and salience/ventral attention networks exhibit the highest average entropy, these findings suggest that these brain regions not only integrate information but are also organized variables among individuals. In previous studies, differential identifiability usually evaluates individual identifiability based on the difference between within-subject similarity and between-subject similarity across multiple scans.39,49,50 We calculated the differential identifiability based on the similarity of entropies of different levels that were estimated from the data in the same scan. The results of the differential identifiability may be large. However, the differential identifiability with hierarchical information was greater than that without hierarchical information in the same situation, suggesting that hierarchical information improved the difference identifiability. In the future, studies using data that have long duration or multiple scans of the same individual are needed to study the contribution of hierarchical module information to individual identification in more detail. In addition, the improvement of individual identifiability by hierarchical information raises the need for deeper mechanistic studies. For example, the questions on the origins of identifiability can be uncovered by tracking changes in the hierarchical overlapping modular structure across brain development.
Limitations of the study
One of the most important limitations of this study concerns the scalability of eFC. The dimension of the eFC network is the square of the nFC network. We parceled the brain into regions based on coarse-scale atlases to ensure computation efficiency. This process causes the investigation of hierarchical structure to be limited to low levels because modules in high levels contain very few regions. A second limitation is associated with overlapping modules. The entropy of a region measures the number of its edge’s distribution in each module and does not account for the edges’ weight. However, the weight of edges represents the intensity of the dependence between two regions. In weighted networks, a region should have a high participation degree in a module if its edges in this module have high weight. A final limitation concerns the short scan duration of the resting-state fMRI. The reliability of our analysis depends on two key parameters, the sample size and the scan duration.51 Previous studies suggested that the duration of most existing datasets is 5–10 min, which is insufficient to achieve high reliability at the individual level.52,53 However, the results on individual identifiability at the subsystem level in the current study were almost consistent with a study using a dataset with a long scan duration,39 indicating that the duration of scanning had a limited effect on the results of our analysis. This may in part be due to the inclusion of a sufficiently large number of subjects in our analysis. A sufficient number of samples can significantly improve the reliability of the analysis results.51 Another possible reason is that individual identifiability analysis is not entirely an individual-level analysis. The value of Idiff of an individual was calculated using the data of all subjects, which may also reduce the insufficient caused by the short scan duration to some extent.
STAR★Methods
Key resources table
| REAGENT or RESOURCE | SOURCE | IDENTIFIER |
|---|---|---|
| Biological samples | ||
| fMRI data | University of California Los Angeles project | https://www.openfmri.org/dataset/ds000030/ |
| Software and algorithms | ||
| MATLAB R2020b | MathWorks | https://github.com/fanyongchen/Hierarchal-overlapped-modular-structure |
Resource availability
Lead contact
Further information and requests for resources and reagents should be directed to and will be fulfilled by the lead contact, Ying Wu (wying36@mail.xjtu.edu.cn).
Materials availability
This study did not generate new unique reagents.
Experimental model and subject details
The MRI data were acquired from OpenfMRI database. Its accession number is ds000030 and is part of the UCLA Consortium for Neuropsychiatric Phenomics LA5c Study.54 This dataset includes resting-state fMRI data for 130 healthy unrelated adult participants. Twenty participants were excluded due to incomplete data. Thus, the total number of participants in this study was 110 (age: 21–50, mean age = 31.6 years, 47 females). All data are made available under the Public Domain Dedication and License v1.0 (http://www.opendatacommons.org/licenses/pddl/1.0/).
Method details
MRI scanning parameters
Images of fMRI were obtained in a 3T Siemens Trio scanner and lasted for 304 s for each participant with slice thickness = 4 mm, 34 slices, TR = 2 s, TE = 30 ms, flip angle = 90°, matrix = 64 × 64, FOV = 192 mm and eyes open. See ref.54 for more detailed scanning parameters.
MRI data preprocessing
Functional images were preprocessed using AFNI (http://afni.nimh.nih.gov/afni/) and FSL (http://www.fmrib.ox.ac.uk/fsl/) according to standard preprocessing protocols.55,56 To ensure the initial stabilization of the fMRI signal, the first four volumes were removed from the subsequent preprocessing and analysis. Then, motion correction was performed for each participant using a 3D image realignment with the AFNI program 3dvolreg function. Images acquired from echo-planar imaging (EPI) were motion and slice-timing corrected and spatially smoothed using a Gaussian kernel of 6 mm full width at half maximum (FWHM). The fMRI signal was filtered with a bandpass 0.01 Hz–0.08 Hz to minimize the effects of low-frequency drift and high-frequency physiological noise.57 The NSP algorithm requires all connections to be positive. In contrast, the global signal regression would introduces more negative connections, and its use remains controversial in resting-state fMRI analyses.58,59 Therefore, we did not remove the whole-brain global signal.
Functional network construction
The brain was partitioned into two different parcellation atlases: 1) 90 regions with the AAL atlas,26 and 2) 100 regions with the Schaefer 100-parcel atlas.27 The fMRI time series for each region was obtained by averaging the BOLD signals of voxels within each region.
Node-centric network construction
The functional connectivity (FC) between region’s time series is used to estimates their statistical interdependency, i.e., how strongly (or weakly) one region’s activity fluctuates with the other region. The most common measure of FC is the Pearson correlation coefficient. Let xi = [xi (1), xi (2), …, xi (T)] and xj = [xj (1), xj (2), …, xj (T)] represent the time series for regions i and j, respectively. Each time series was first normalized as follows:
| (Equation 1) |
Here, is the time-average mean value, is the standard deviation, T is the length of fMRI length, and t is in the range of [1, T]. The Pearson correlation coefficient between regions i and j can be calculated as follows:
| (Equation 2) |
where the element-wise product encodes the moment-by-moment co-fluctuations magnitude of regions i and j. When regions i and j at time t simultaneously exhibit increased (or decreased) activity relative to baseline, is positive. Otherwise, one region increased while the other decreased at time t, is negative. Thus, the correlation was defined as the time-averaged co-fluctuation magnitude between regions, and the node-centric network was constructed wherein the edge is represented by the nFC.
Edge-centric network construction
Contrary to the time-averaged element-wise product in nFC, the time-variable can be used to construct the edge-functional connectivity. In an edge-centric network, the node is the nFC between regions, and the edge is the correlation between nFCs, named the eFC.19 Let cij and cuv be the time series for edges {i,j} and {u,v}, respectively. The eFC can be calculated as follows:
| (Equation 3) |
To meet the requirements of the NSP algorithm, negative correlations in the nFC and eFC metrics were set to zero. In addition, the results of taking the absolute value of the negative correlation are presented in Figure S8 and Table S2. Excluding negative correlations and making negative correlations positive have minimal effects on the results.
Module detection algorithm
NSP algorithm
The NSP algorithm was used to partition networks into hierarchical modules.11,23 The functional matrix A can be decomposed into with eigenvectors U and eigenvalues . In the spectral space, larger eigenvalues relate to a stronger degree of collectiveness in dynamic patterns. Thus, the eigenvectors were sorted according to the descending order of eigenvalues. The NSP method partitions the network into hierarchical modules based on the negativity and positivity of eigenvector values in each order.11 In the first order mode, all the elements of the eigenvector are positive or negative values as we zero out all negative correlations (Figure 1), which was regarded as the first level with one functional module (i.e., the whole network). Furthermore, in the 2nd order mode, the eigenvector has both positive and negative elements. The elements with positive signs were assigned as a module, and the remaining elements with negative signs were assigned as the second module. This mode with two modules was regarded as the second level. Each module in the second level can be further divided into two submodules according to their sign of elements in the 3rd order eigenvector which was regarded as the third level. Subsequently, the network can be partitioned into hierarchical modules until each module contains only one node. This method has been demonstrated to be more effective in linking brain functional networks to cognitive abilities and clinical scores.60
Clustering algorithm
At the single level, we used a standard k-means clustering algorithm with Euclidean distance to detect modules in the eFC network. In addition, the results of the k-means clustering algorithm with cosine distance are provided in Figure S9. Different distance metrics have minimal effects on the results. Other module detection algorithms, such as modularity maximization61 and Infomap62 could also be used. Here, however, we used the k-means clustering algorithm due to the number of modules, i.e., parameter k needs to be predefined, which ensures that the number of modules obtained using the k-means algorithm and using the NSP algorithm are equal in a specific hierarchical level. The clustering algorithm was replicated 250 times for each k value.
Module overlap entropy
The module detection algorithms partitioned the eFC network into nonoverlapping modules (edge modules). The nodes in eFC networks represent edges of regions in nFC networks, and mapping edge modules back to the nFC networks would generate the overlapping modules (eFC modules). The participation degree of region i in overlapping module m can be calculated as follows19:
| (Equation 4) |
where is the module assignment of the edge between regions i and j. In addition, is the Kronecker delta function; its value is 1 if x=y and 0 otherwise. By definition, , and we can set pi = [pi1, pi2, …, pik] as the participation probability vector of region i in each of k overlapping modules. The entropy of the probability vector measures the extent to which the region evenly participates across all modules (high entropy and high overlap) or is concentrates within a few modules (low entropy and low overlap). The entropy of region i was defined as follows:
| (Equation 5) |
which was further divided by log2 k to be normalized into [0,1]. If one region participates evenly and its edges distribute uniformly in every module, its entropy is close to 1. Otherwise, one region participates in a single module, and its entropy is close to 0. This entropy was calculated at each hierarchical level.
To investigate the organized principle of hierarchical overlapping modules across multiple levels, we further defined the local entropy to estimate the overlap degree of regions between two modules that are separated from the same large module. In this situation, the participation probability of the region is counted from the two modules.
Differential identifiability
The individual identifiability from the brain hierarchical overlapping modular structure is achieved by calculating the differential identifiability (Idiff).49 We first quantified the spatial (Pearson) correlation of regional entropies between hierarchical levels within- and between-individuals. The average correlation within an individual is regarded as self-identifiability (Iself) and the average value between individuals is regarded as between-individual similarity (Iothers).
| (Equation 6) |
| (Equation 7) |
Here, l is the number of hierarchical levels and k means the individual. represents the correlation coefficient of entropies between level i in individual k and level j in individual n. Then, the Idiff of an individual is defined as follows:
| (Equation 8) |
which quantifies the difference between the average within individual entropy similarity and the average between individual entropy similarity. A high value of Idiff indicates that the individual brain exhibits greater identifiability. By defining Idiff, we integrated information across multiple levels into a single metric and made it comparable between individuals.
Quantification and statistical analysis
The linear regression model was applied to fit the symmetry between the two hemispheres in Figure 3C. Two-sample t-test was used to estimate the significant difference. A value of p < 0.05 was considered to be significant.
Acknowledgments
This work was supported by the National Natural Science Foundation of China (Grants No. 12132012, No. 11972275, and No. 11802229).
Author contributions
Conceptualization, Y. F.; Methodology, Y.F., and R. W.; Data curation: Y. F.; Formal analysis: Y. F., and C. Y.; Funding acquisition, R. W., and Y. W.; Investigation, Y. F., C. Y., and L. Z.; Software, Y. F., C. Y.; Supervision, R. W. and Y. W.; Visualization, Y. F. and C. Y.; Writing – original draft, Y. F.; Writing – review & editing: Y. F., R. W., and Y. W..
Declaration of interests
The authors declare no competing interests.
Published: April 6, 2023
Footnotes
Supplemental information can be found online at https://doi.org/10.1016/j.isci.2023.106575.
Supplemental information
Data and code availability
The accession number for the original fMRI dataset is listed in the key resources table. Main original code has been deposited at https://github.com/fanyongchen/Hierarchical-overlapping-modular-structure and is publicly available as of the date of publication. Any additional information required to reanalyze the data reported in this paper is available from the lead contact upon request.
References
- 1.Yamamoto H., Moriya S., Ide K., Hayakawa T., Akima H., Sato S., Kubota S., Tanii T., Niwano M., Teller S., et al. Impact of modular organization on dynamical richness in cortical networks. Sci. Adv. 2018;4:eaau4914. doi: 10.1126/sciadv.aau4914. [DOI] [PMC free article] [PubMed] [Google Scholar]
- 2.Yue Q., Martin R.C., Fischer-Baum S., Ramos-Nuñez A.I., Ye F., Deem M.W. Brain modularity mediates the relation between task complexity and performance. J. Cognit. Neurosci. 2017;29:1532–1546. doi: 10.1162/jocn_a_01142. [DOI] [PubMed] [Google Scholar]
- 3.Park H.-J., Friston K. Structural and functional brain networks: from connections to cognition. Science. 2013;342:1238411. doi: 10.1126/science.1238411. [DOI] [PubMed] [Google Scholar]
- 4.Sporns O., Betzel R.F. Modular brain networks. Annu. Rev. Psychol. 2016;67:613–640. doi: 10.1146/annurev-psych-122414-033634. [DOI] [PMC free article] [PubMed] [Google Scholar]
- 5.Bullmore E., Sporns O. The economy of brain network organization. Nat. Rev. Neurosci. 2012;13:336–349. doi: 10.1038/nrn3214. [DOI] [PubMed] [Google Scholar]
- 6.Fan Y., Fan Q., Zhou L., Wang R., Lin P., Wu Y. Cohesive communities in dynamic brain functional networks. Phys. Rev. E. 2021;104:014302. doi: 10.1103/PhysRevE.104.014302. [DOI] [PubMed] [Google Scholar]
- 7.Baum G.L., Ciric R., Roalf D.R., Betzel R.F., Moore T.M., Shinohara R.T., Kahn A.E., Vandekar S.N., Rupert P.E., Quarmley M., et al. Modular segregation of structural brain networks supports the development of executive function in youth. Curr. Biol. 2017;27:1561–1572.e8. doi: 10.1016/j.cub.2017.04.051. [DOI] [PMC free article] [PubMed] [Google Scholar]
- 8.Gallen C.L., D’Esposito M. Brain modularity: a biomarker of intervention-related plasticity. Trends Cognit. Sci. 2019;23:293–304. doi: 10.1016/j.tics.2019.01.014. [DOI] [PMC free article] [PubMed] [Google Scholar]
- 9.Meunier D., Lambiotte R., Bullmore E.T. Modular and hierarchically modular organization of brain networks. Front. Neurosci. 2010;4:200. doi: 10.3389/fnins.2010.00200. [DOI] [PMC free article] [PubMed] [Google Scholar]
- 10.Safari A., Moretti P., Diez I., Cortes J.M., Muñoz M.A. Persistence of hierarchical network organization and emergent topologies in models of functional connectivity. Neurocomputing. 2021;461:743–750. doi: 10.1016/j.neucom.2021.02.096. [DOI] [Google Scholar]
- 11.Wang R., Lin P., Liu M., Wu Y., Zhou T., Zhou C. Hierarchical connectome modes and critical state jointly maximize human brain functional diversity. Phys. Rev. Lett. 2019;123:038301. doi: 10.1103/PhysRevLett.123.038301. [DOI] [PubMed] [Google Scholar]
- 12.Wang S.-J., Zhou C. Hierarchical modular structure enhances the robustness of self-organized criticality in neural networks. New J. Phys. 2012;14:023005. doi: 10.1088/1367-2630/14/2/023005. [DOI] [Google Scholar]
- 13.Doucet G., Naveau M., Petit L., Delcroix N., Zago L., Crivello F., Jobard G., Tzourio-Mazoyer N., Mazoyer B., Mellet E., Joliot M. Brain activity at rest: a multiscale hierarchical functional organization. J. Neurophysiol. 2011;105:2753–2763. doi: 10.1152/jn.00895.2010. [DOI] [PubMed] [Google Scholar]
- 14.Fan Y., Wang R., Lin P., Wu Y. Hierarchical integrated and segregated processing in the functional brain default mode network within attention-deficit/hyperactivity disorder. PLoS One. 2019;14:e0222414. doi: 10.1371/journal.pone.0222414. [DOI] [PMC free article] [PubMed] [Google Scholar]
- 15.Meunier D., Lambiotte R., Fornito A., Ersche K.D., Bullmore E.T. Hierarchical modularity in human brain functional networks. Front. Neuroinf. 2009;3:37. doi: 10.3389/neuro.11.037.2009. [DOI] [PMC free article] [PubMed] [Google Scholar]
- 16.Crossley N.A., Mechelli A., Vértes P.E., Winton-Brown T.T., Patel A.X., Ginestet C.E., McGuire P., Bullmore E.T. Cognitive relevance of the community structure of the human brain functional coactivation network. Proc. Natl. Acad. Sci. USA. 2013;110:11583–11588. doi: 10.1073/pnas.1220826110. [DOI] [PMC free article] [PubMed] [Google Scholar]
- 17.Najafi M., McMenamin B.W., Simon J.Z., Pessoa L. Overlapping communities reveal rich structure in large-scale brain networks during rest and task conditions. Neuroimage. 2016;135:92–106. doi: 10.1016/j.neuroimage.2016.04.054. [DOI] [PMC free article] [PubMed] [Google Scholar]
- 18.Li X., Gan J.Q., Wang H. Collective sparse symmetric non-negative matrix factorization for identifying overlapping communities in resting-state brain functional networks. Neuroimage. 2018;166:259–275. doi: 10.1016/j.neuroimage.2017.11.003. [DOI] [PubMed] [Google Scholar]
- 19.Faskowitz J., Esfahlani F.Z., Jo Y., Sporns O., Betzel R.F. Edge-centric functional network representations of human cerebral cortex reveal overlapping system-level architecture. Nat. Neurosci. 2020;23:1644–1654. doi: 10.1038/s41593-020-00719-y. [DOI] [PubMed] [Google Scholar]
- 20.Chen N., Shi J., Li Y., Ji S., Zou Y., Yang L., Yao Z., Hu B. Decreased dynamism of overlapping brain sub-networks in Major Depressive Disorder. J. Psychiatr. Res. 2021;133:197–204. doi: 10.1016/j.jpsychires.2020.12.018. [DOI] [PubMed] [Google Scholar]
- 21.Nicosia V., Mangioni G., Carchiolo V., Malgeri M. Extending the definition of modularity to directed graphs with overlapping communities. J. Stat. Mech. 2009;2009:P03024. doi: 10.1088/1742-5468/2009/03/P03024. [DOI] [Google Scholar]
- 22.Lancichinetti A., Fortunato S., Kertész J. Detecting the overlapping and hierarchical community structure of complex networks. New J. Phys. 2009;11:033015. doi: 10.1088/1367-2630/11/3/033015. [DOI] [Google Scholar]
- 23.Wang R., Liu M., Cheng X., Wu Y., Hildebrandt A., Zhou C. Segregation, integration, and balance of large-scale resting brain networks configure different cognitive abilities. Proc. Natl. Acad. Sci. USA. 2021;118 doi: 10.1073/pnas.2022288118. e2022288118. [DOI] [PMC free article] [PubMed] [Google Scholar]
- 24.Wang R., Su X., Chang Z., Wu Y., Lin P. Flexible Brain Transitions Between Hierarchical Network Segregation and Integration Predict Human Behavior. IEEE J. Biomed. Health Inform. 2021;26:1835–1846. doi: 10.21203/rs.3.rs-94060/v1. [DOI] [PubMed] [Google Scholar]
- 25.Betzel R.F., Medaglia J.D., Papadopoulos L., Baum G.L., Gur R., Gur R., Roalf D., Satterthwaite T.D., Bassett D.S. The modular organization of human anatomical brain networks: accounting for the cost of wiring. Netw. Neurosci. 2017;1:42–68. doi: 10.1162/NETN_a_00002. [DOI] [PMC free article] [PubMed] [Google Scholar]
- 26.Tzourio-Mazoyer N., Landeau B., Papathanassiou D., Crivello F., Etard O., Delcroix N., Mazoyer B., Joliot M. Automated anatomical labeling of activations in SPM using a macroscopic anatomical parcellation of the MNI MRI single-subject brain. Neuroimage. 2002;15:273–289. doi: 10.1006/nimg.2001.0978. [DOI] [PubMed] [Google Scholar]
- 27.Schaefer A., Kong R., Gordon E.M., Laumann T.O., Zuo X.-N., Holmes A.J., Eickhoff S.B., Yeo B.T.T. Local-global parcellation of the human cerebral cortex from intrinsic functional connectivity MRI. Cerebr. Cortex. 2018;28:3095–3114. doi: 10.1093/cercor/bhx179. [DOI] [PMC free article] [PubMed] [Google Scholar]
- 28.He Y., Wang J., Wang L., Chen Z.J., Yan C., Yang H., Tang H., Zhu C., Gong Q., Zang Y., Evans A.C. Uncovering intrinsic modular organization of spontaneous brain activity in humans. PLoS One. 2009;4:e5226. doi: 10.1371/journal.pone.0005226. [DOI] [PMC free article] [PubMed] [Google Scholar]
- 29.Jo Y., Zamani Esfahlani F., Faskowitz J., Chumin E.J., Sporns O., Betzel R.F. The diversity and multiplexity of edge communities within and between brain systems. Cell Rep. 2021;37:110032. doi: 10.1016/j.celrep.2021.110032. [DOI] [PubMed] [Google Scholar]
- 30.Vangimalla R.R., Sreevalsan-Nair J. Comparing community detection methods in brain functional connectivity networks. bioRxiv. 2020 doi: 10.1101/2020.02.06.935783. Preprint at. [DOI] [Google Scholar]
- 31.Yeo B.T.T., Krienen F.M., Sepulcre J., Sabuncu M.R., Lashkari D., Hollinshead M., Roffman J.L., Smoller J.W., Zöllei L., Polimeni J.R., et al. The organization of the human cerebral cortex estimated by intrinsic functional connectivity. J. Neurophysiol. 2011;106:1125–1165. doi: 10.1152/jn.00338.2011. [DOI] [PMC free article] [PubMed] [Google Scholar]
- 32.Cui Z., Li H., Xia C.H., Larsen B., Adebimpe A., Baum G.L., Cieslak M., Gur R.E., Gur R.C., Moore T.M., et al. Individual variation in functional topography of association networks in youth. Neuron. 2020;106:340–353.e8. doi: 10.1016/j.neuron.2020.01.029. [DOI] [PMC free article] [PubMed] [Google Scholar]
- 33.Poldrack R.A., Laumann T.O., Koyejo O., Gregory B., Hover A., Chen M.-Y., Gorgolewski K.J., Luci J., Joo S.J., Boyd R.L., et al. Long-term neural and physiological phenotyping of a single human. Nat. Commun. 2015;6:8885. doi: 10.1038/ncomms9885. [DOI] [PMC free article] [PubMed] [Google Scholar]
- 34.Laumann T.O., Gordon E.M., Adeyemo B., Snyder A.Z., Joo S.J., Chen M.-Y., Gilmore A.W., McDermott K.B., Nelson S.M., Dosenbach N.U.F., et al. Functional system and areal organization of a highly sampled individual human brain. Neuron. 2015;87:657–670. doi: 10.1016/j.neuron.2015.06.037. [DOI] [PMC free article] [PubMed] [Google Scholar]
- 35.Dubois J., Adolphs R. Building a science of individual differences from fMRI. Trends Cognit. Sci. 2016;20:425–443. doi: 10.1016/j.tics.2016.03.014. [DOI] [PMC free article] [PubMed] [Google Scholar]
- 36.Gordon E.M., Laumann T.O., Gilmore A.W., Newbold D.J., Greene D.J., Berg J.J., Ortega M., Hoyt-Drazen C., Gratton C., Sun H., et al. Precision functional mapping of individual human brains. Neuron. 2017;95:791–807.e7. doi: 10.1016/j.neuron.2017.07.011. [DOI] [PMC free article] [PubMed] [Google Scholar]
- 37.Menara T., Lisi G., Pasqualetti F., Cortese A. Brain network dynamics fingerprints are resilient to data heterogeneity. J. Neural. Eng. 2021;18:026004. doi: 10.1088/1741-2552/abd684. [DOI] [PubMed] [Google Scholar]
- 38.Finn E.S., Shen X., Scheinost D., Rosenberg M.D., Huang J., Chun M.M., Papademetris X., Constable R.T. Functional connectome fingerprinting: identifying individuals using patterns of brain connectivity. Nat. Neurosci. 2015;18:1664–1671. doi: 10.1038/nn.4135. [DOI] [PMC free article] [PubMed] [Google Scholar]
- 39.Jo Y., Faskowitz J., Esfahlani F.Z., Sporns O., Betzel R.F. Subject identification using edge-centric functional connectivity. Neuroimage. 2021;238:118204. doi: 10.1016/j.neuroimage.2021.118204. [DOI] [PubMed] [Google Scholar]
- 40.Valencia M., Pastor M.A., Fernández-Seara M.A., Artieda J., Martinerie J., Chavez M. Complex modular structure of large-scale brain networks. Chaos. 2009;19:023119. doi: 10.1063/1.3129783. [DOI] [PubMed] [Google Scholar]
- 41.Power J.D., Cohen A.L., Nelson S.M., Wig G.S., Barnes K.A., Church J.A., Vogel A.C., Laumann T.O., Miezin F.M., Schlaggar B.L., Petersen S.E. Functional network organization of the human brain. Neuron. 2011;72:665–678. doi: 10.1016/j.neuron.2011.09.006. [DOI] [PMC free article] [PubMed] [Google Scholar]
- 42.Zheng M., Allard A., Hagmann P., Alemán-Gómez Y., Serrano M.Á. Geometric renormalization unravels self-similarity of the multiscale human connectome. Proc. Natl. Acad. Sci. USA. 2020;117:20244–20253. doi: 10.1073/pnas.1922248117. [DOI] [PMC free article] [PubMed] [Google Scholar]
- 43.La Rocca D., Zilber N., Abry P., van Wassenhove V., Ciuciu P. Self-similarity and multifractality in human brain activity: a wavelet-based analysis of scale-free brain dynamics. J. Neurosci. Methods. 2018;309:175–187. doi: 10.1016/j.jneumeth.2018.09.010. [DOI] [PubMed] [Google Scholar]
- 44.Bertolero M.A., Yeo B.T.T., D’Esposito M. The modular and integrative functional architecture of the human brain. Proc. Natl. Acad. Sci. USA. 2015;112:E6798–E6807. doi: 10.1073/pnas.1510619112. [DOI] [PMC free article] [PubMed] [Google Scholar]
- 45.Expert P., Lambiotte R., Chialvo D.R., Christensen K., Jensen H.J., Sharp D.J., Turkheimer F. Self-similar correlation function in brain resting-state functional magnetic resonance imaging. J. R. Soc. Interface. 2011;8:472–479. doi: 10.1098/rsif.2010.0416. [DOI] [PMC free article] [PubMed] [Google Scholar]
- 46.Fox P.T., Friston K.J. Distributed processing; distributed functions? Neuroimage. 2012;61:407–426. doi: 10.1016/j.neuroimage.2011.12.051. [DOI] [PMC free article] [PubMed] [Google Scholar]
- 47.Fan Y., Wang R., Zhou L., Lin P., Wu Y. Nested-spectral analysis reveals a disruption of behavioral-related dynamic functional balance in the aging brain. Nonlinear Dynam. 2023 doi: 10.1007/s11071-023-08328-7. [DOI] [Google Scholar]
- 48.Fernandino L., Humphries C.J., Conant L.L., Seidenberg M.S., Binder J.R. Heteromodal cortical areas encode sensory-motor features of word meaning. J. Neurosci. 2016;36:9763–9769. doi: 10.1523/JNEUROSCI.4095-15.2016. [DOI] [PMC free article] [PubMed] [Google Scholar]
- 49.Amico E., Goñi J. The quest for identifiability in human functional connectomes. Sci. Rep. 2018;8:8254. doi: 10.1038/s41598-018-25089-1. [DOI] [PMC free article] [PubMed] [Google Scholar]
- 50.Bari S., Amico E., Vike N., Talavage T.M., Goñi J. Uncovering multi-site identifiability based on resting-state functional connectomes. Neuroimage. 2019;202:115967. doi: 10.1016/j.neuroimage.2019.06.045. [DOI] [PubMed] [Google Scholar]
- 51.Termenon M., Jaillard A., Delon-Martin C., Achard S. Reliability of graph analysis of resting state fMRI using test-retest dataset from the Human Connectome Project. Neuroimage. 2016;142:172–187. doi: 10.1016/j.neuroimage.2016.05.062. [DOI] [PubMed] [Google Scholar]
- 52.Elliott M.L., Knodt A.R., Cooke M., Kim M.J., Melzer T.R., Keenan R., Ireland D., Ramrakha S., Poulton R., Caspi A., et al. General functional connectivity: shared features of resting-state and task fMRI drive reliable and heritable individual differences in functional brain networks. Neuroimage. 2019;189:516–532. doi: 10.1016/j.neuroimage.2019.01.068. [DOI] [PMC free article] [PubMed] [Google Scholar]
- 53.Kraus B.T., Perez D., Ladwig Z., Seitzman B.A., Dworetsky A., Petersen S.E., Gratton C. Network variants are similar between task and rest states. Neuroimage. 2021;229:117743. doi: 10.1016/j.neuroimage.2021.117743. [DOI] [PMC free article] [PubMed] [Google Scholar]
- 54.Poldrack R.A., Congdon E., Triplett W., Gorgolewski K.J., Karlsgodt K.H., Mumford J.A., Sabb F.W., Freimer N.B., London E.D., Cannon T.D., Bilder R.M. A phenome-wide examination of neural and cognitive function. Sci. Data. 2016;3:160110. doi: 10.1038/sdata.2016.110. [DOI] [PMC free article] [PubMed] [Google Scholar]
- 55.Biswal B.B., Mennes M., Zuo X.-N., Gohel S., Kelly C., Smith S.M., Beckmann C.F., Adelstein J.S., Buckner R.L., Colcombe S., et al. Toward discovery science of human brain function. Proc. Natl. Acad. Sci. USA. 2010;107:4734–4739. doi: 10.1073/pnas.0911855107. [DOI] [PMC free article] [PubMed] [Google Scholar]
- 56.Lin P., Hasson U., Jovicich J., Robinson S. A neuronal basis for task-negative responses in the human brain. Cerebr. Cortex. 2011;21:821–830. doi: 10.1093/cercor/bhq151. [DOI] [PMC free article] [PubMed] [Google Scholar]
- 57.Biswal B., Yetkin F.Z., Haughton V.M., Hyde J.S. Functional connectivity in the motor cortex of resting human brain using echo-planar mri. Magn. Reson. Med. 1995;34:537–541. doi: 10.1002/mrm.1910340409. [DOI] [PubMed] [Google Scholar]
- 58.Murphy K., Birn R.M., Handwerker D.A., Jones T.B., Bandettini P.A. The impact of global signal regression on resting state correlations: are anti-correlated networks introduced? Neuroimage. 2009;44:893–905. doi: 10.1016/j.neuroimage.2008.09.036. [DOI] [PMC free article] [PubMed] [Google Scholar]
- 59.Schölvinck M.L., Maier A., Ye F.Q., Duyn J.H., Leopold D.A. Neural basis of global resting-state fMRI activity. Proc. Natl. Acad. Sci. USA. 2010;107:10238–10243. doi: 10.1073/pnas.0913110107. [DOI] [PMC free article] [PubMed] [Google Scholar]
- 60.Wang R., Su X., Chang Z., Lin P., Wu Y. Flexible brain transitions between hierarchical network segregation and integration associated with cognitive performance during a multisource interference task. IEEE J. Biomed. Health Inform. 2022;26:1835–1846. doi: 10.1109/JBHI.2021.3119940. [DOI] [PubMed] [Google Scholar]
- 61.Newman M.E.J., Girvan M. Finding and evaluating community structure in networks. Phys. Rev. E. 2004;69:026113. doi: 10.1103/PhysRevE.69.026113. [DOI] [PubMed] [Google Scholar]
- 62.Rosvall M., Bergstrom C.T. Maps of random walks on complex networks reveal community structure. Proc. Natl. Acad. Sci. USA. 2008;105:1118–1123. doi: 10.1073/pnas.0706851105. [DOI] [PMC free article] [PubMed] [Google Scholar]
Associated Data
This section collects any data citations, data availability statements, or supplementary materials included in this article.
Supplementary Materials
Data Availability Statement
The accession number for the original fMRI dataset is listed in the key resources table. Main original code has been deposited at https://github.com/fanyongchen/Hierarchical-overlapping-modular-structure and is publicly available as of the date of publication. Any additional information required to reanalyze the data reported in this paper is available from the lead contact upon request.