Abstract
We present an automated method for measuring the lineal density of red blood cells (RBCs) in human retinal capillaries using adaptive optics near-confocal ophthalmoscopy (AONCO). The spatiotemporal traces of RBCs flowing in retinal capillaries were extracted from AONCO images, enhanced using the Gabor filter, the vesselness filter, and the Hough transform. A total of 43 capillary segments (each 50 μm long) were analyzed in 12 eyes of 12 subjects and the measurement error of the automated method was 0.09 cell over 50 μm compared with results obtained by manual counting. Our method provides a tool for assessing RBCs spatial distribution in retinal capillaries.
The inner retina is one of the highest energy consuming tissues in the human body. The delivery of oxygen and nutrients, and removal of metabolic wastes are accomplished largely by red blood cells (RBCs) as they pass through retinal capillaries. Theoretical simulations and experimental studies in animal models suggest that the RBCs in the capillary system must distribute in a specific spatiotemporal pattern to meet the tissue’s energy demand. This process, in a single capillary, manifests a continuous flow of RBCs that are separated by plasma gaps [1]. The spacing between RBCs varies with the physiological state or in response to stimuli, decreasing during functional hyperemia [2] and maximal vasodilation [3] and increasing during tissue hyperoxia [1, 2]. To provide a constant, uniform flux of oxygen out of the capillary, the microcirculation must maintain a specific number of RBCs within a certain length of a capillary at any time. The instantaneous spatial distribution of the RBCs in a single capillary can be described by ‘cell lineal density [4].’ This metric is similar to hematocrit, which measures the volume percentage of RBCs in the blood and varies with the physiological state. However, in a single capillary, the hematocrit is lower than that in large vessels, which has been referred as the Fahraeus effect and can significantly affect the viscosity of the blood flow in the capillary [5].
RBCs are not only the carriers of oxygen but also play a role in sensing oxygen within blood vessels [6]. Thus, in vivo measurement of RBC lineal density in retinal capillaries may provide insight into the mechanisms by which the oxygen is supplied and regulated under normal physiological and pathophysiological conditions at the microscale [4]. However, this work has not been conducted in the human eye due to technical limitations (described in next paragraph). Only limited data have thus far been acquired in animal tissues [4, 7]. While animal models have provided important insight into retinal physiology, the human microcirculation has its own unique attributes that warrant specific investigation.
Many established modalities, such as laser Doppler velocimetry [8], optical coherence tomography (OCT) [9], laser speckle imaging [10], and Doppler OCT [11], do not possess the spatial resolution required for imaging retinal capillaries (5 – 10 μm) and the blood cells within [12, 13]. While adaptive optics (AO) has enabled ophthalmoscopy with the spatial resolution that is sufficient for imaging retinal capillaries in the living human eye [12, 13], most imaging systems are limited by temporal bandwidth that is insufficient to render the fasting moving RBCs in the capillaries. In vivo imaging of RBCs in human retinal capillary became possible only recently with the development of high speed AO fundus camera [14] or a dual-light AO scanning laser ophthalmoscope [13].
Recently we designed an adaptive optics near-confocal ophthalmoscope (AONCO) [15], which can image individual RBCs flowing in retinal capillaries at a frame rate of 800 Hz, a speed that is sufficient for accurately measuring the movement of RBCs in retinal capillaries of the human eye. In this study, we have developed an automated method to characterize the RBC lineal density in individual retinal capillaries using images acquired by the AONCO. We then evaluated the accuracy of the algorithm.
The measurement of RBC lineal density in retinal capillaries is achieved in three steps: RBC spatiotemporal trace generation, enhancement, and detection.
RBC spatiotemporal trace generation.
The method for generating the spatiotemporal traces of the RBCs in retinal capillaries imaged by the AONCO has been described in previous papers [15, 16]. For the readers’ convenience, we summarize the procedures here. The AONCO is a near-confocal ophthalmoscope in which AO corrects for the human eye’s optical wave aberration thereby ensuring diffraction limited image resolution. A high-speed line camera is employed to acquire the retinal image and serves as a confocal gate that rejects out-of-focus scattering light in the direction perpendicular to the line image chip. The confocal performance is further enhanced by using a digital micromirror-array device (DMD, Texas Instruments, DLP® 0.55 XGA Series 450 DMD, Dallas, US) to modulate the imaging light into a line of point sources in the line image (chip of the camera) direction. An anamorphic imaging mechanism is implemented to increase the imaging light collection efficiency thereby ensuring a good signal-to-noise ratio (SNR) for high-speed imaging. The imaging light of the AONCO is from a low coherent near infrared (NIR) superluminescent laser diode with wavelength at 795 ± 15 nm (Broadlighter S795-HP, Superlum Ltd., Ireland). The wavelength of the beacon light for ocular wavefront sensing is 730 nm (LP730-SF15, Thorlabs Inc., Newton, NJ). To image RBCs in retinal capillaries, the AONCO focused the imaging light at the capillaries and acquired the images with a frame rate of 800 Hz over a field of view (FOV) of 1.2°× 0.3°, which was digitized at a resolution of 512 × 128 pixels. Simultaneous to the retinal image acquisition, the cardiac pulse signal of the subject was recorded using a pulse-transducer (TN1012/ST and PowerLab 8/35, ADInstruments Inc., Colorado Springs, CO) and plotted with the blood velocity waveform for concomitant analysis. To correct the displacement between successive frames and the distortion within the same frame caused by eye motion, the successive frames of the AONCO video were registered using custom software. Capillaries were then extracted using the motion contrast enhancement method [17]. Spatiotemporal image analysis was applied to generate the traces of the RBCs flowing through the retinal capillary. The spatial axis of the spatiotemporal plot presents the travel distance of the blood cells, and the temporal axis indicates the frame (time) index (Fig. 1).
Fig. 1.

RBC spatiotemporal trace generation. (a) AONCO image registration. (b) Retinal capillaries generated by motion contrast method. Arrowheads indicate a capillary segment (50 μm long) in which the RBC traces were generated and shown in (c).
RBC trace enhancement.
While RBC traces extracted from the AONCO images generally feature a SNR or contrast that is sufficient for measuring the velocity (i.e., the slope of the RBC traces), automated counting of RBC cells can be affected by the noise in the spatiotemporal image, by inhomogeneous brightness or by discontinuity of the cell traces (Fig. 2(a)). We thus applied the Gabor filter to reduce noise and enhance the contrast, in particular, to improve the ‘continuity’ of the RBC traces.
Fig. 2.
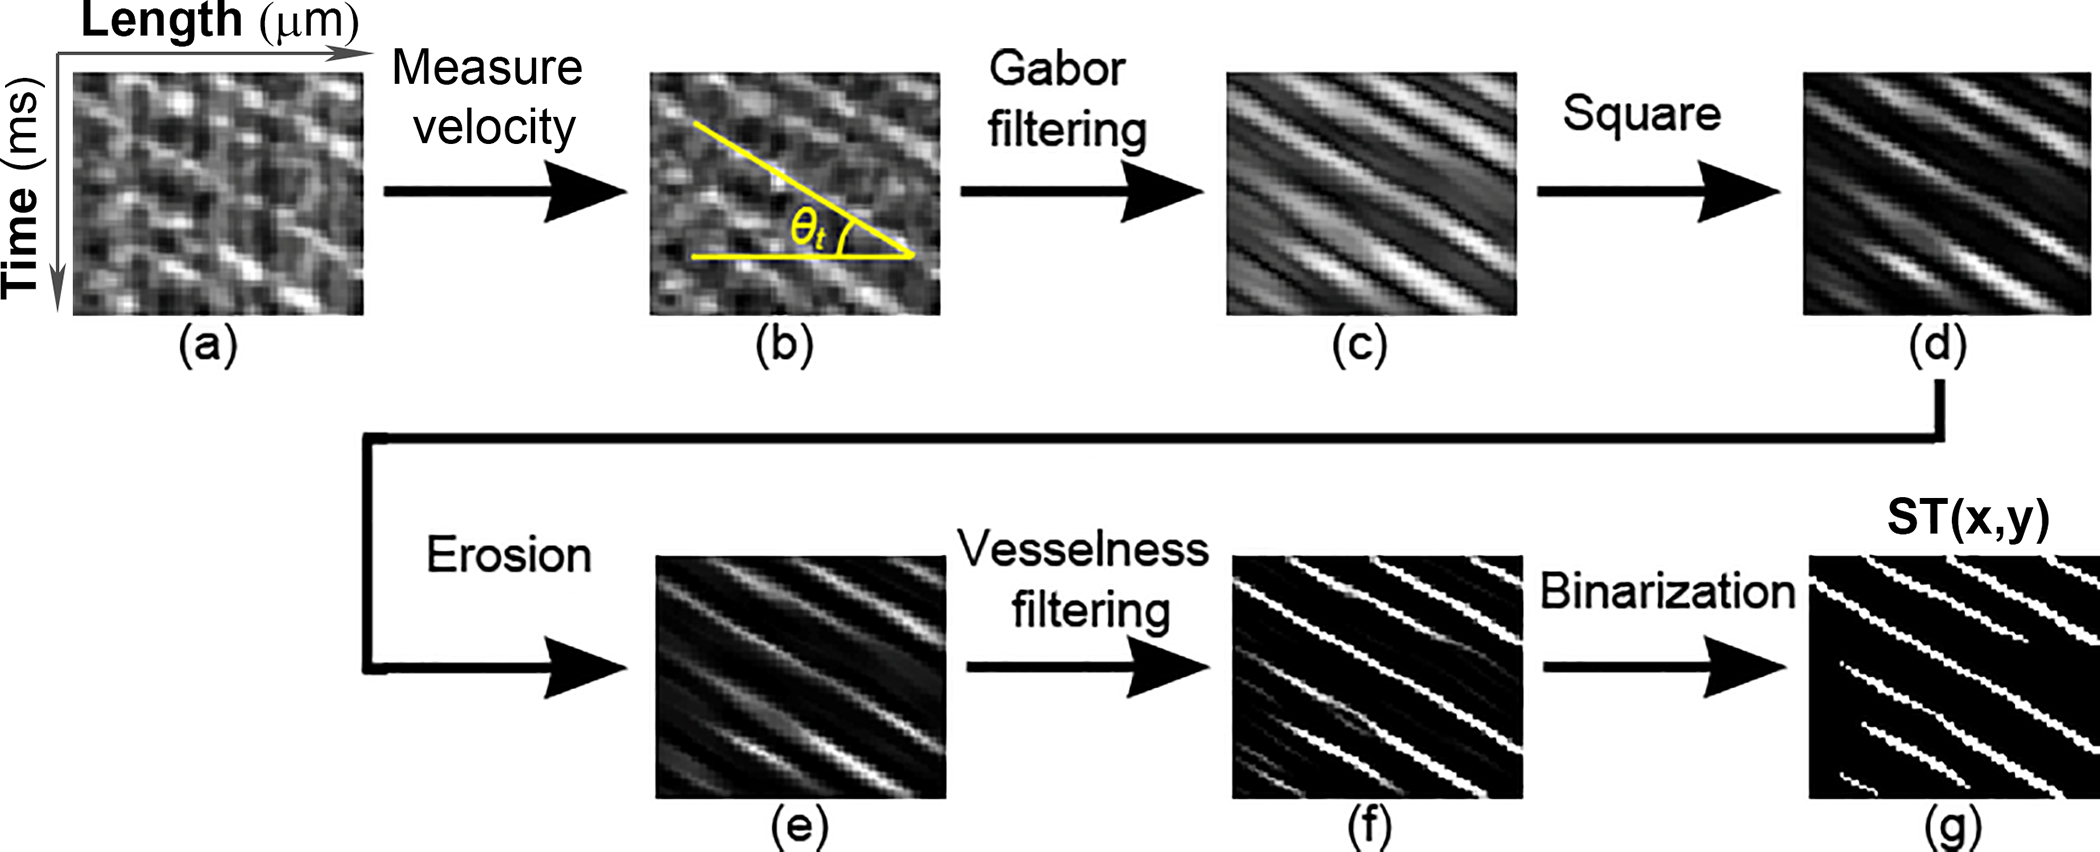
RBC spatiotemporal trace enhancement. (a) Raw RBC spatiotemporal trace image. (b) The direction of the RBC traces θt was detected by using the Radon transform. (c) The Gabor filter was applied to RBC traces along the direction θt to improve the continuity. (d) The RBC trace image was enhanced by a square operator. (e) An image erosion operator was applied to panel (d). (f) The RBC traces were further enhanced by Jerman’s vesselness filter. (g) The RBC traces were binarized by Otsu’s adaptive threshold.
The Gabor filter is a linear filter that is particularly good at enhancing the tubular structure with a specific spatial frequency and direction [18]. A 2D Gabor filter is essentially a 2D Gaussian function modulated by a sinusoidal function:
| (1) |
| (2) |
| (3) |
Where θt is the angular direction of RBC traces detected by the Radon transform (Fig. 2(b)) within a sampling window of 80 ms wide [15], x and y are horizontal and vertical coordinates of the 2D Gabor filter, σ is the standard deviation of the Gaussian function, λ is the spatial frequency of the sinusoidal function, γ is the spatial aspect ratio that controls the ellipticity of the 2D Gaussian function. The parameters σ, λ, and γ were determined by a series of trial and error tests. σ = 1.75, λ = 5, γ = 0.25, in this study.
After application of the Gabor filter (Fig. 2(c)), a square operator was applied to the RBC traces to enhance the contrast (Fig. 2(d)). Then, an erosion operator (Fig. 2(e)) was applied to offset the expansion of the edges caused by the Gaussian component in the Gabor filter, which replaced a pixel by the minimum value in its neighborhood. The neighborhood was defined by a 3-by-3 structuring element: [0, 1, 0; 1, 1, 1; 0, 1, 0], in this study.
The intensity uniformity and edge sharpness of the RBC traces were further enhanced by using a vesselness filter (Fig. 2(f)), which is originally designed to improve vascular contrast in angiographic images. Among various vesselness filters, Jerman’s filter is an optimal option since it has a robust performance for processing highly varying intensities and provides a good uniformity of response across the spatiotemporal traces [19], which is important for image binarization. Of note, since the vesselness filter enhances the tubular structures in all directions, it must be applied after the Gabor filter. Finally, the RBC traces were binarized using the Otsu’s adaptive threshold method [20]. An optimal threshold was determined by minimizing the intra-class intensity variance based on the intensity histogram. A pixel intensity lower than the threshold was set to zero, otherwise the pixel value was 1 (Fig. 2(g)).
RBC trace detection.
Due to inhomogeneous intensity of the pixels, some binarized RBC traces appear ‘broken.’ To avoid counting errors caused by the incompleteness of the RBC traces, we applied the Hough transform to the binarized RBC trace image. The Hough transform is a feature extraction method for finding lines or objects with specific shape (for example, cycle, ellipse, curve, etc.) in an image, even the object is ‘broken.’ [21]. After the Hough transform, a RBC trace image ST(x, y) was mapped into the Hough space (Fig. 3(a)). A point (ρ, θ) on the H(ρ, θ) image represents a line in the RBC trace image.
Fig. 3.
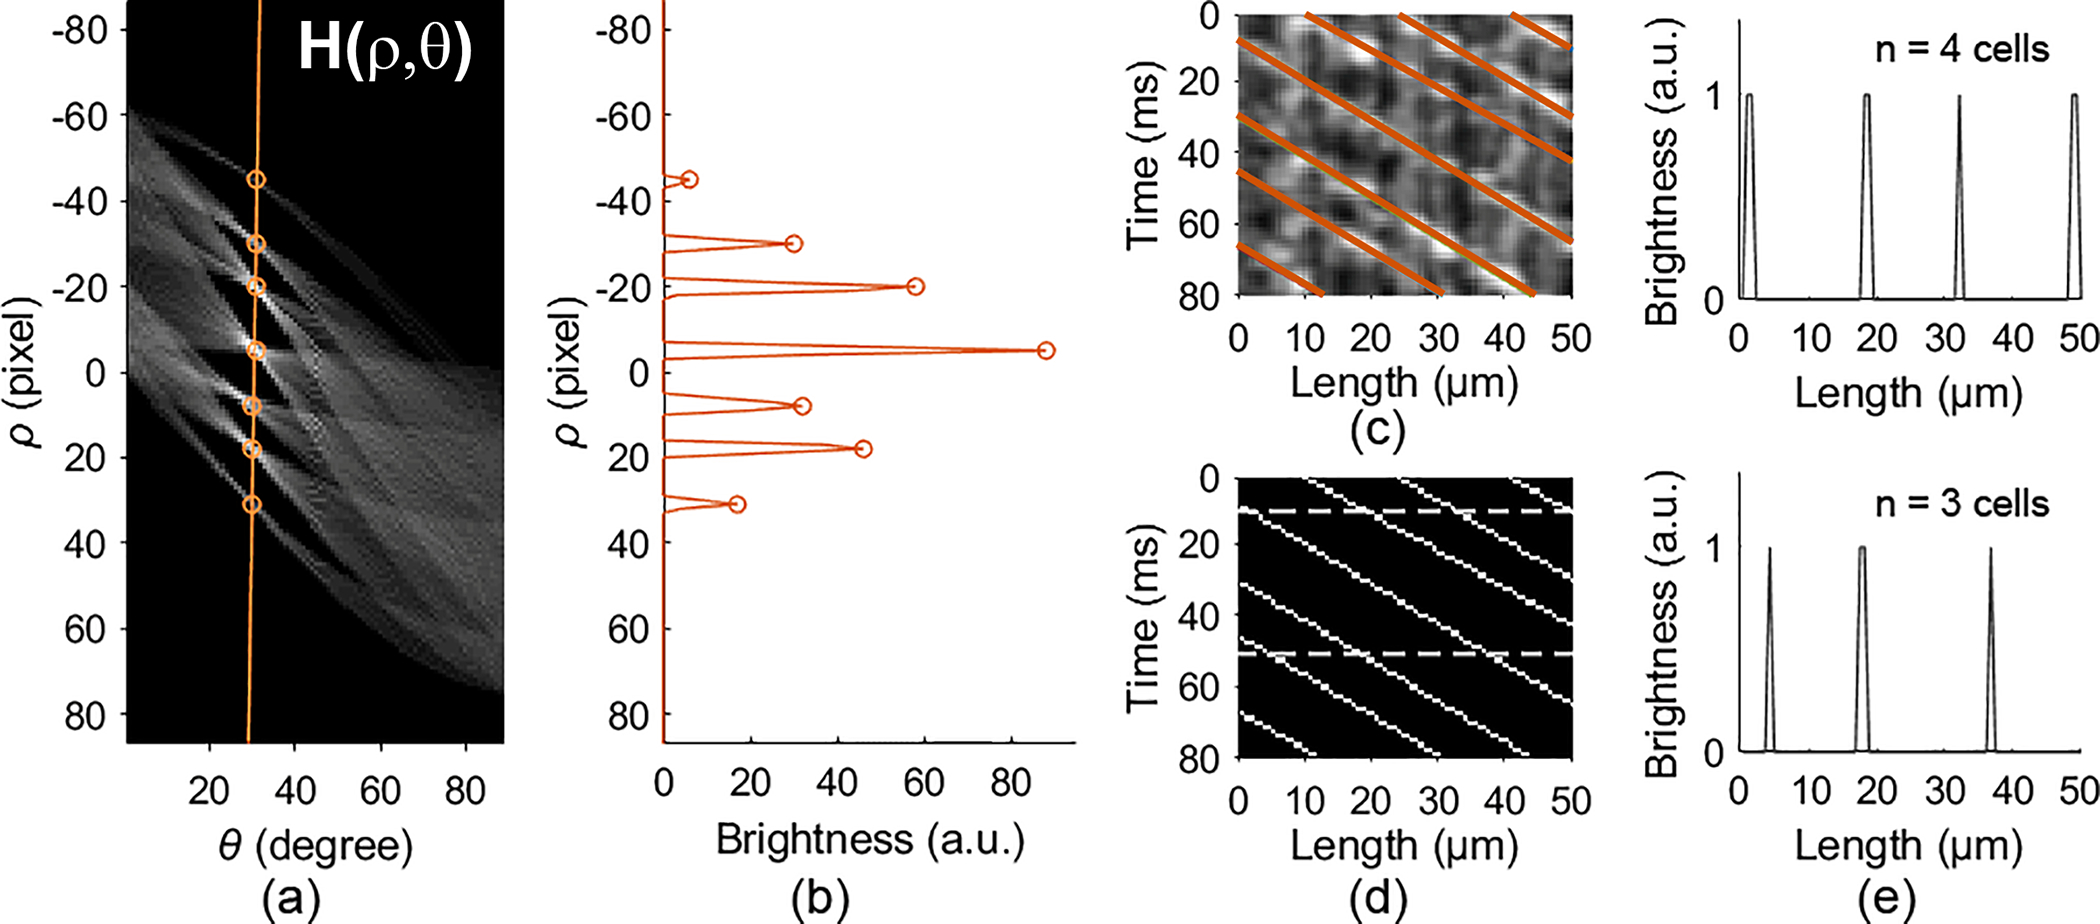
RBC spatiotemporal trace detection. (a) The Hough transform of the binarized RBC trace image. (b) The local maximums on the orange line in (a) that correspond to the RBC traces. (c) RBC traces detected by the location of the local maximums in (a) & (b). (d) Skeleton RBC traces. (e) The number of red blood cells counted at 2 time points, 10 ms and 50 ms, indicated by the dashed lines in panel (d). See Code and the testing image.
The points on the same binarized RBC trace in the ST(x,y) image accumulate a bright dot on the H(ρ, θ) image (Fig. 3(a)). Since the slope of the RBC traces (θt) is known, the corresponding ρ can be detected by finding the local maximums on the column of θ = θt on the H(ρ, θ) image (orange circles in Figs. 3(a) & 3(b)). With the (ρ, θ) of each RBC traces determined from the H(ρ, θ) image and the line equation, we generated the skeleton lines that rendered complete RBC traces (Figs. 3(c) & 3(d)), with which we were able to count the RBCs at any time points (Fig. 3(e)) in a capillary segment.
The algorithm was written using Matlab (R2020a, MathWorks Inc, Natick, Mass). To verify the accuracy, we compared the results obtained by the automated algorithm with that obtained by manual counting [7], in 43 capillary segments from 12 eyes of 12 subjects with normal healthy retinae. The study was approved by the Institutional Review Board for Human Use at the University of Alabama at Birmingham and at the University of California – Los Angeles. Written informed consent was obtained from the participants after the nature and risks and benefits of the study were explained. All subjects were in normal physical health. Before imaging, the subject was seated for ~15 minutes in order to establish a stable cardiovascular and respiratory resting state.
The RBC lineal density was measured in capillaries near the foveal avascular zone. Limited by the AONCO FOV, all capillary segments were selected with a length of 50 μm, in the relatively straight portion of the vessels, within which RBC flowed in single file. Fig. 4 presents the data measured in one capillary over 5 cardiac circles. RBC flow velocity was also drawn to illustrate the flow fluctuation.
Fig. 4.
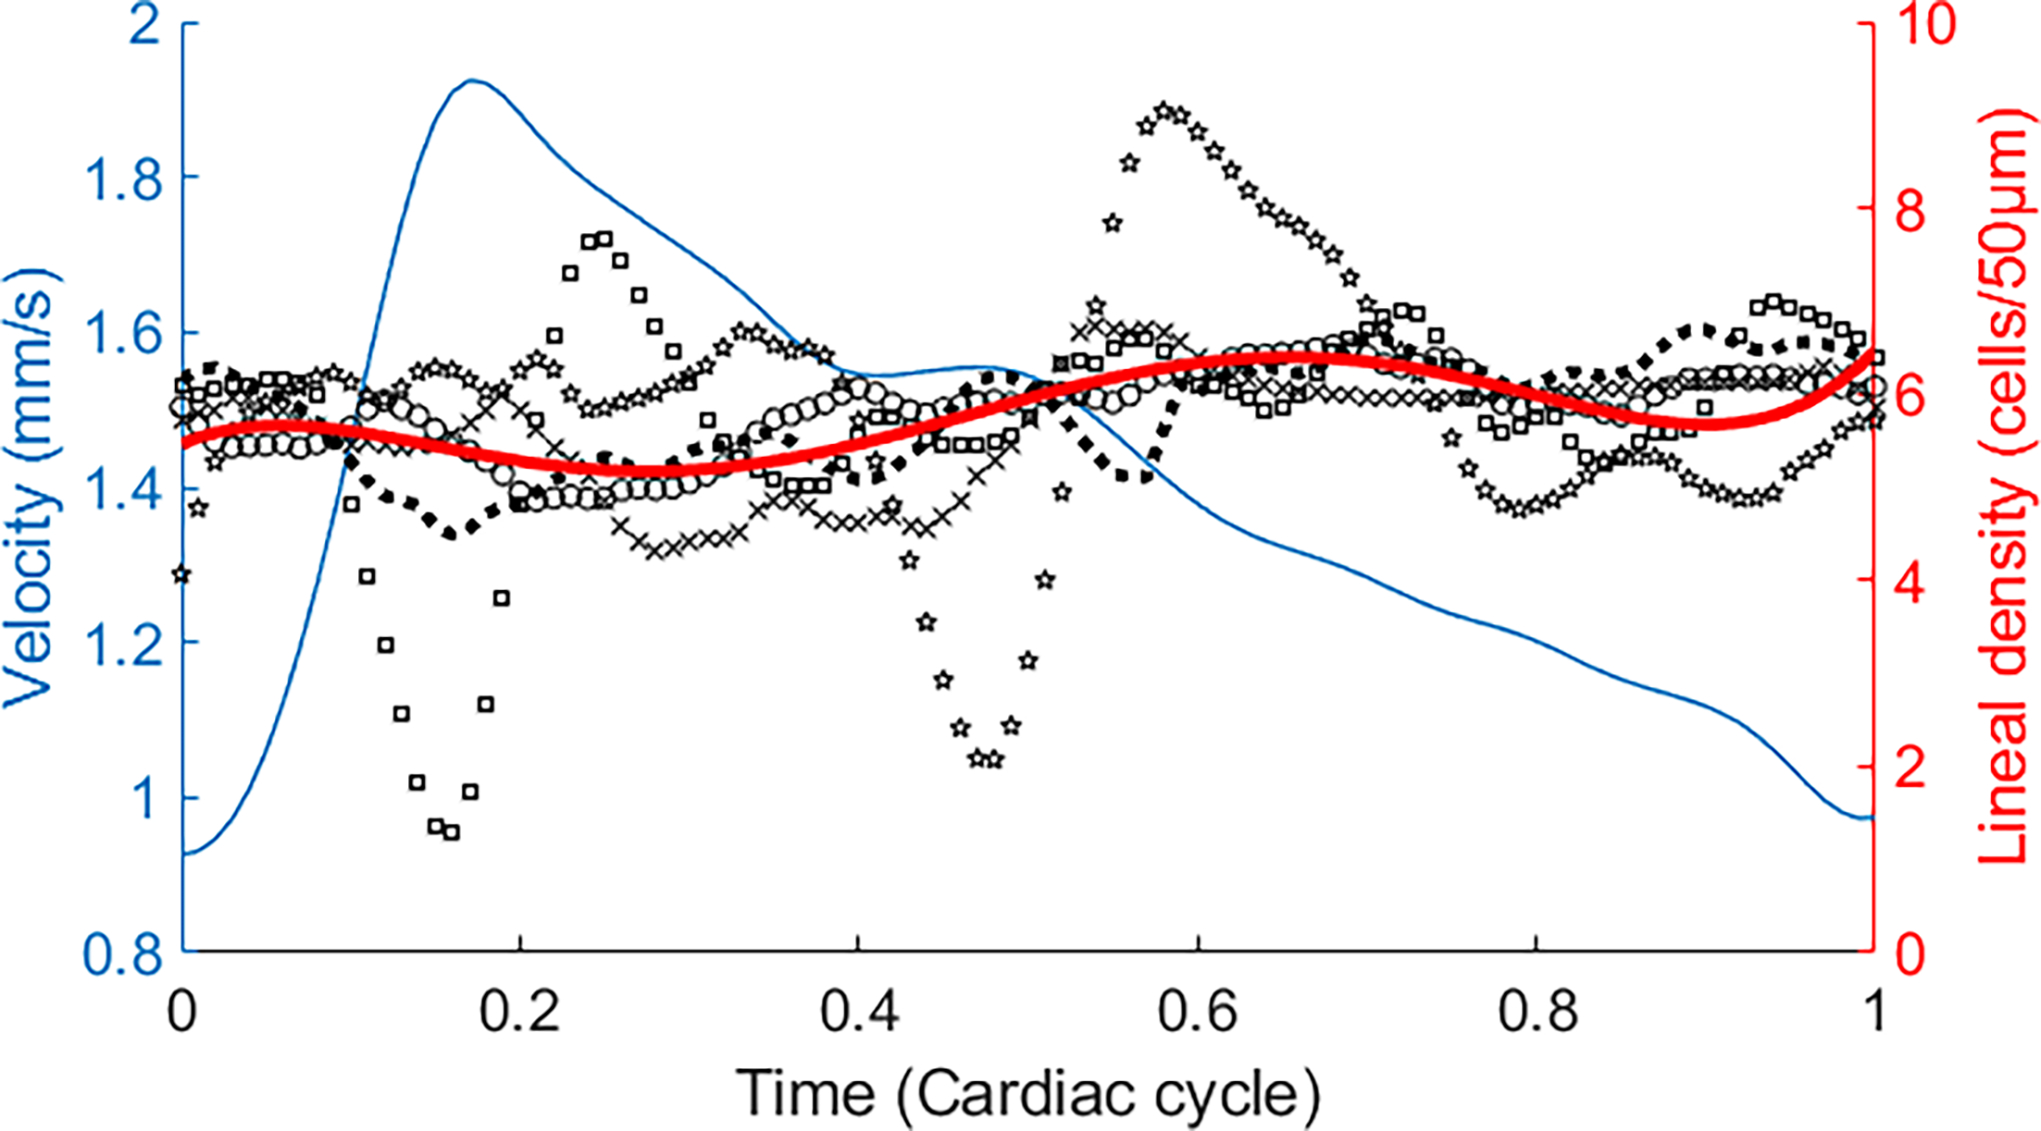
RBC lineal density within a cardiac circle in a capillary. Black markers are RBC lineal density measured in different cardiac cycles. Red line is the average RBC lineal density over 5 cardiac circles. Blue line is the average RBC velocity. The plots were drawn in the following steps. 1) The RBC velocity and lineal density were measured in all cardiac cycles. 2) The periods of all cardiac cycles were normalized to 1. 3) RBC velocity and lineal density at the corresponding time points within the normalized cycle were averaged. The cardiac cycle was determined by the simultaneously recorded cardiac pulses. See Data File 1 for underlying values.
The mean difference between the results obtained by manual counting and by the automated algorithm was 0.09 cell, with a 95% confidence interval of (−0.81, 0.98) cells over 50 μm (Fig. 5). The major causes of the measurement error of the automated algorithm were the background noise and the RBC spatiotemporal trace discontinuity (Supplemental Figure. S1).
Fig. 5.
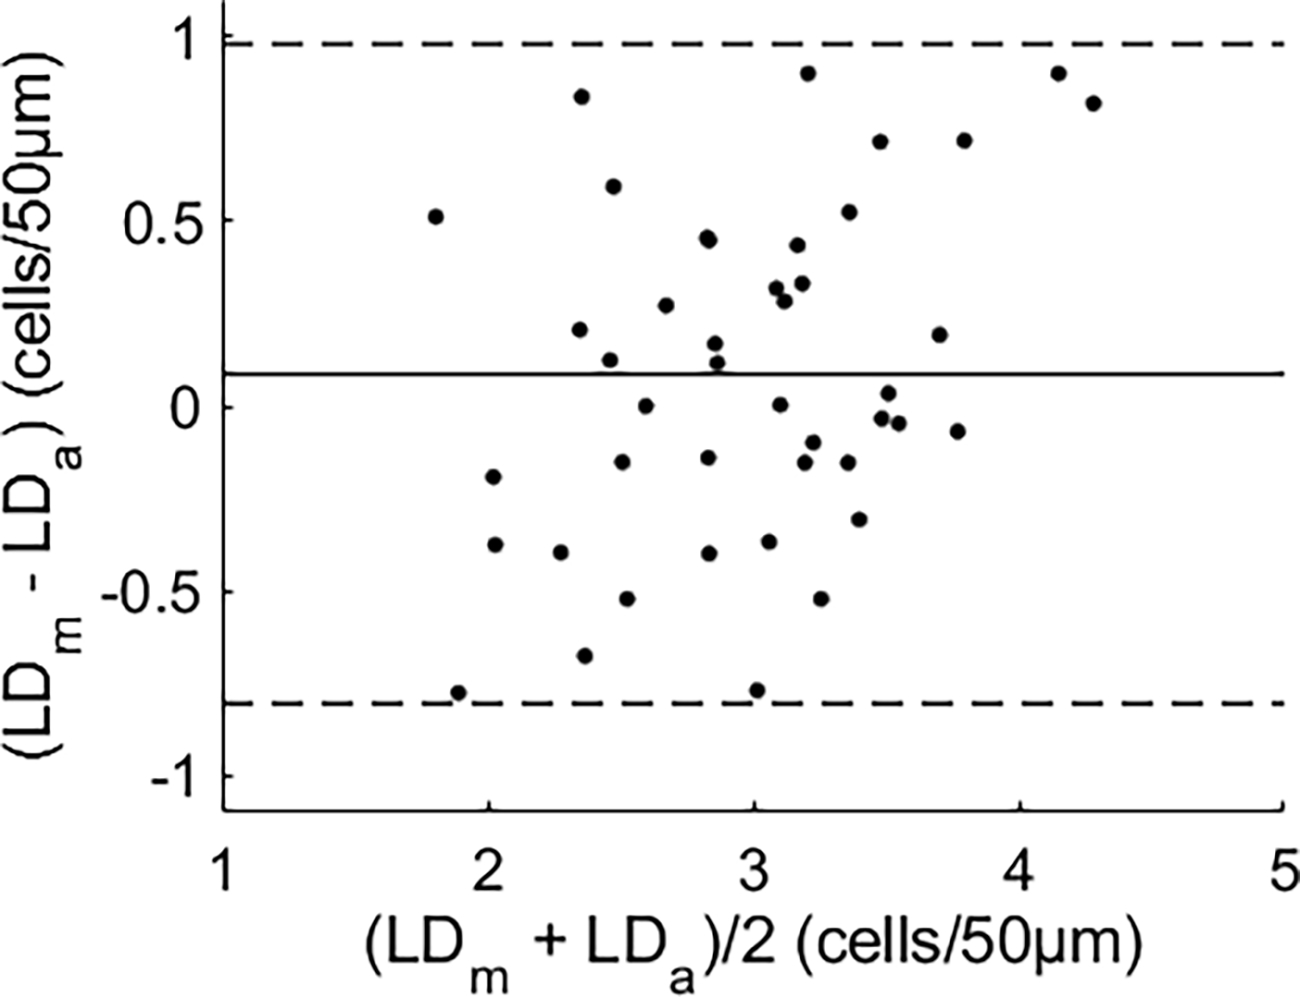
Bland-Altman plot [22] of RBC lineal density measured by manual counting (LDm) versus that by the automated algorithm (LDa). The solid line is the mean difference of the two measurements. Dashed lines indicate the 95% confidence interval (mean ± 1.96 × standard deviation). See Data File 2 for underlying values.
RBC lineal density was normally distributed (Fig. 6), with a maximum frequency of 3 cells/50μm and a probability of ~0.4. The 95% confidence interval was 1 to 5 cells/50μm.
Fig. 6.
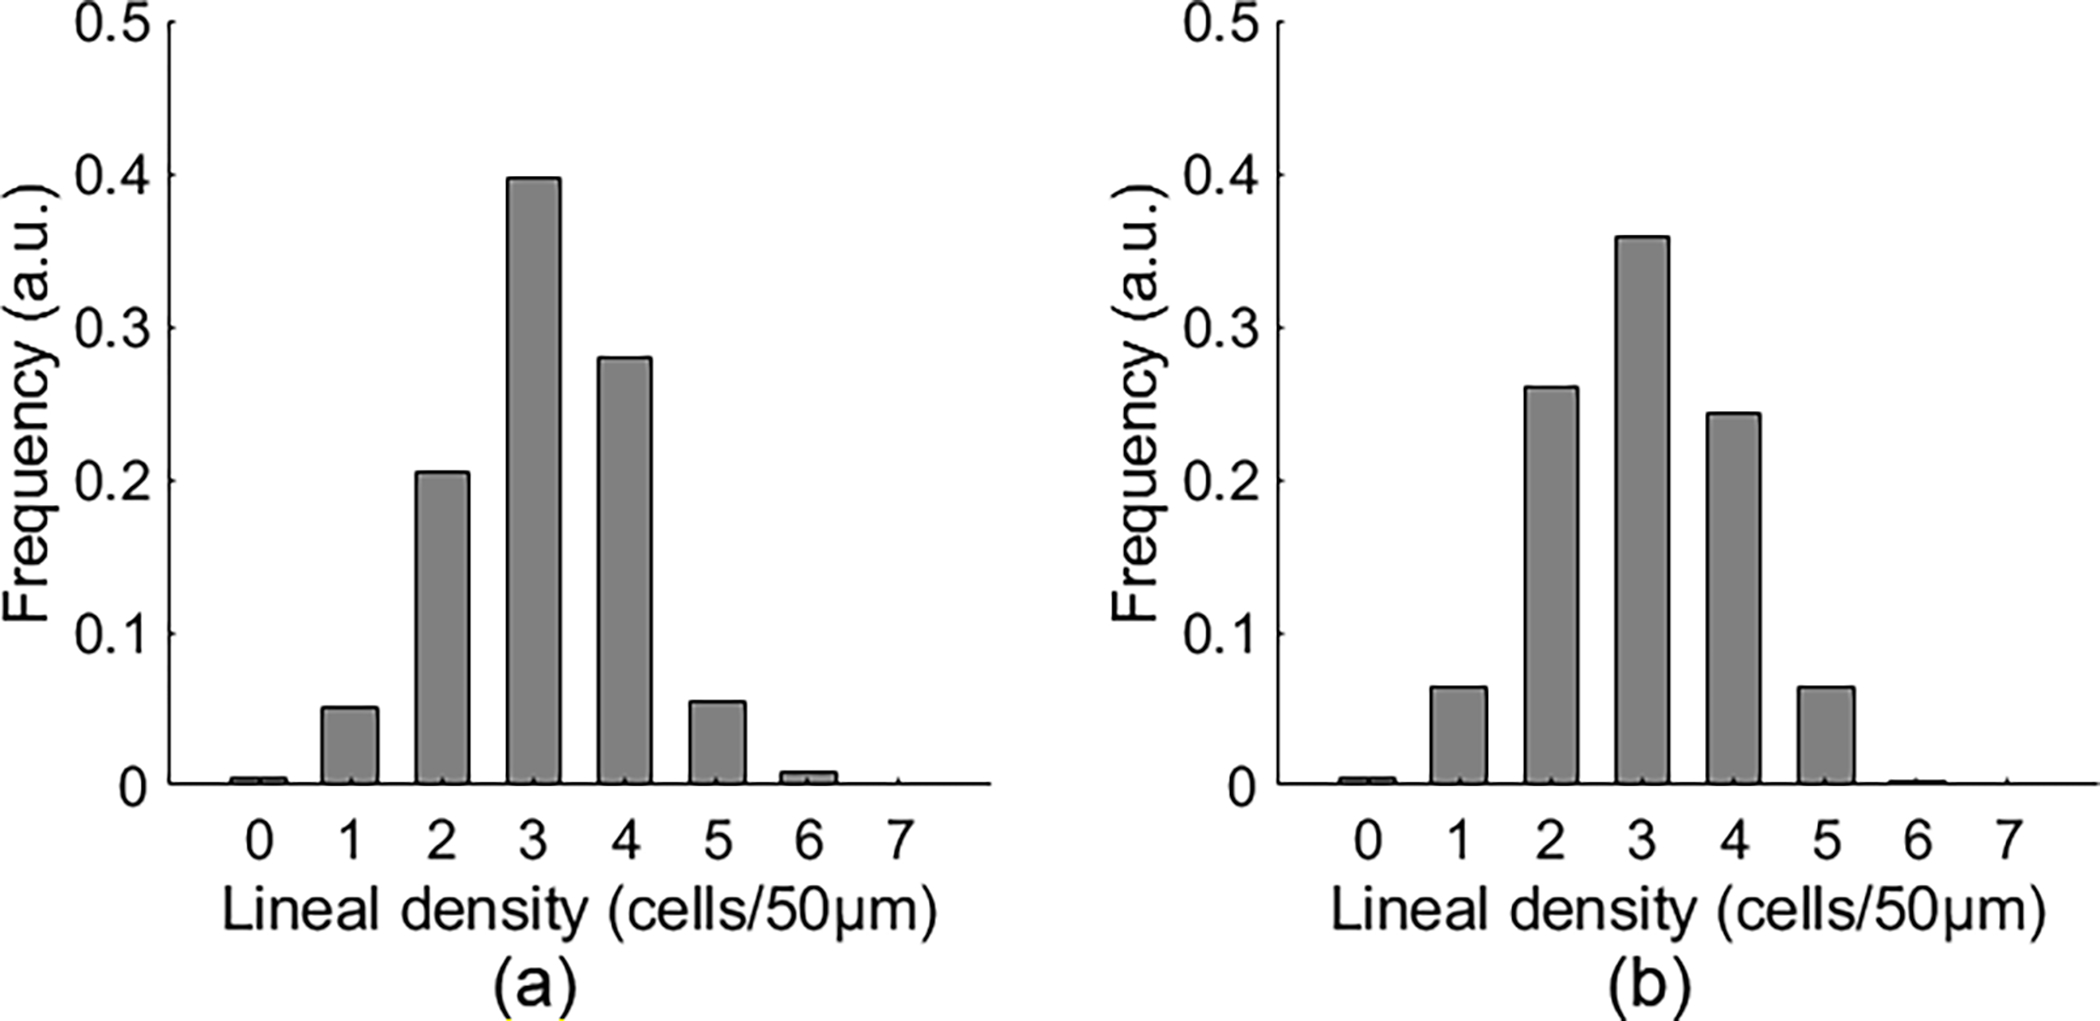
The distribution of RBC lineal density quantified by manual counting (a) and by the automated measurement (b) in 43 capillaries. See Data File 3 for underlying values.
In 43 capillaries, the mean RBC lineal density was 61.98 ± 20.12 cells/mm (mean ± SD) by manual counting and 59.62 ± 20.86 cells/mm by the automated method. The results were measured in 4679 epochs (80 ms), including a total of 27638 cells. On average, the lineal density was measured over 8.71 seconds in each segment.
This study reports a method for in vivo measurement of the lineal density of RBCs in human retinal capillaries and presents for the first time in vivo data in the human eye. Previously, Ellis and co-workers reported the RBC lineal density of 33.25 cells/mm in one capillary in the sartorius muscle of a frog [4]. Japee and colleagues showed that the RBC lineal density was between 43.4 – 50.1 cells/mm in the capillaries in the retractor muscle of hamsters and in the extensor digitorum longus muscle of a rat [7]. These methods, however, are invasive and not appropriate for in vivo human study.
The AONCO [16] enables a reliable tracing of RBCs flowing in human retinal capillaries thereby allowing for in vivo measurement of the RBC lineal density. Since the AONCO images the eye using NIR light without using any exogenous contrast agents. The NIR light does not visually stimulate the retina. Thus the RBC lineal density can be assessed under the natural rheological state without disturbing the normal retinal function. On the other hand, a drawback of this imaging regime is low image contrast of the RBCs. Although RBC traces can be extracted by using the motion contrast method, noise in the spatiotemporal image can affect automated cell counting. We thus implemented strategies to further enhance the SNR and improve the continuity of RBC traces thereby ensuring the accuracy for automatic counting of the cells.
RBC lineal density measured by the automated algorithm (59.62 cells/mm) agrees with that obtained by manual counting (61.98 cells/mm) (Figs. 5 & 6). Our preliminary data show that the RBC lineal density can vary significantly in a single cardiac cycle (Fig. 4, black markers with different shapes) but the average density over multiple cycles appears fairly consistent (Fig. 4, red line) under the normal cardiovascular and respiratory resting state; meanwhile the average RBC velocity fluctuated (Fig. 4, blue line). This observation requires further validation in more capillaries and in more subjects since the results were only in a small number of capillaries and the physical condition of the subjects was not strictly controlled.
Future work may devote to investigation of the relationship between RBC lineal density and other metrics such as flow velocity, RBC flux, and capillary hematocrit, thereby obtaining critical hemodynamic parameters for assessing the flow viscosity and wall stress of the vessels [23]. RBC lineal density should be measured across different retinal areas and may be tested under visual stimulation or gas breathing perturbations to understand retinal microcirculation and physiology at single capillary level. Alterations in microcirculation, as may occur in diabetic retinopathy, glaucoma, age-related macular degeneration, hypertension, stroke, and Alzheimer’s disease, can result in reduction or loss of oxygen supply and lead to retinal tissue damage and functional impairment [24]. Our method may potentially be applied to detect the RBC flow alteration in the retinal capillary at an early stage.
We have identified limitations that can be addressed in future work. The discrepancy between the automated measurement and manual counting of the lineal density may be further reduced. Advanced deep learning-based imaging processing methods may be adopted to identify the RBC traces. Bedggood and Metha presented a method [25] recently by which cell density can be quantified thus this method may be applied to improve the automatic RBC counting.
In conclusion, in vivo quantification of RBC lineal density in human retinal capillaries under the natural rheological state may provide a potential useful biological index or a biomarker for assessing vascular function and pathophysiology.
Supplementary Material
Acknowledgment.
Boyu Gu’s current affiliation is School of Computer and Information Engineering, Tianjin Chengjian University. Tianjin 300384, China
Funding.
NIH R01EY024378, W. F. Keck Foundation, and Research to Prevent Blindness.
Footnotes
Disclosures: B Gu and Y Zhang: None, SR Sadda: Allergan (F, C), Carl Zeiss Meditec (F), Genentech (F,C), Optos (F, C), Topcon (F), Centervue (C), Heidelberg Engineering Inc (C), Iconic Inc (C), Novartis (C), Oxurion (C). D Sarraf: Amgen (F, C), Bayer (C), Genentech (F, C), Novartis (C), Optovue (F, C), Heidelberg Engineering (F), Regeneron (F) and Topcon (F). M Ip: Boehringer Ingelheim (C), Thrombogenics (C), Quark (C), Omeros (C), Allergan (C), Amgen (C), Astellas (C), Alimera (C), Novartis (F), Genentech (F), Clearside (F), Biogen (F).
Supplemental document. See Supplement 1 for supporting content for Matlab code of the algorithm.
Data availability.
Data underlying the results presented in this paper are available in Data File 1, Data File 2, and Data File 3.
Full References
- 1.Federspiel WJ and Sarelius IH, “An examination of the contribution of red cell spacing to the uniformity of oxygen flux at the capillary wall,” Microvas Res 27, 273–285 (1984). [DOI] [PubMed] [Google Scholar]
- 2.Klitzman B and Duling BR, “Microvascular hematocrit and red cell flow in resting and contracting striated muscle,” Am J Physiol 237, H481–490 (1979). [DOI] [PubMed] [Google Scholar]
- 3.Sarelius IH, Damon DN, and Duling BR, “Microvascular adaptations during maturation of striated muscle,” Am J Physiol 241, H317–324 (1981). [DOI] [PubMed] [Google Scholar]
- 4.Ellis CG, Fraser S, Hamilton G, and Groom AC, “Measurement of the lineal density of red blood cells in capillaries in vivo, using a computerized frame-by-frame analysis of video images,” Microvas Res 27, 1–13 (1984). [DOI] [PubMed] [Google Scholar]
- 5.Silverman DA and Rakusan K, “Red blood cell spacing in rat coronary capillaries during the cardiac cycle,” Microvasc Res 52, 143–156 (1996). [DOI] [PubMed] [Google Scholar]
- 6.Wei HS, Kang H, Rasheed IY, Zhou S, Lou N, Gershteyn A, McConnell ED, Wang Y, Richardson KE, Palmer AF, Xu C, Wan J, and Nedergaard M, “Erythrocytes Are Oxygen-Sensing Regulators of the Cerebral Microcirculation,” Neuron 91, 851–862 (2016). [DOI] [PMC free article] [PubMed] [Google Scholar]
- 7.Japee SA, Pittman RN, and Ellis CG, “A new video image analysis system to study red blood cell dynamics and oxygenation in capillary networks,” Microcirculation 12, 489–506 (2005). [DOI] [PubMed] [Google Scholar]
- 8.Petrig BL and Riva CE, “Near-IR retinal laser Doppler velocimetry and flowmetry: new delivery and detection techniques,” Appl. Opt. 30, 2073–2078 (1991). [DOI] [PubMed] [Google Scholar]
- 9.Lee B, Novais EA, Waheed NK, Adhi M, de Carlo TE, Cole ED, Moult EM, Choi W, Lane M, Baumal CR, Duker JS, and Fujimoto JG, “En Face Doppler Optical Coherence Tomography Measurement of Total Retinal Blood Flow in Diabetic Retinopathy and Diabetic Macular Edema,” JAMA Ophthalmol 135, 244–251 (2017). [DOI] [PMC free article] [PubMed] [Google Scholar]
- 10.Luft N, Wozniak PA, Aschinger GC, Fondi K, Bata AM, Werkmeister RM, Schmidl D, Witkowska KJ, Bolz M, Garhofer G, and Schmetterer L, “Measurements of Retinal Perfusion Using Laser Speckle Flowgraphy and Doppler Optical Coherence Tomography,” Invest Ophthalmol Vis Sci 57, 5417–5425 (2016). [DOI] [PubMed] [Google Scholar]
- 11.Leitgeb RA, Werkmeister RM, Blatter C, and Schmetterer L, “Doppler optical coherence tomography,” Prog Retin Eye Res 41, 26–43 (2014). [DOI] [PMC free article] [PubMed] [Google Scholar]
- 12.Roorda A and Duncan JL, “Adaptive optics ophthalmoscopy,” Annual review of vision science 1, 19–50 (2015). [DOI] [PMC free article] [PubMed] [Google Scholar]
- 13.Burns SA, Elsner AE, Sapoznik KA, Warner RL, and Gast TJ, “Adaptive optics imaging of the human retina,” Prog Retin Eye Res 68, 1–30 (2019). [DOI] [PMC free article] [PubMed] [Google Scholar]
- 14.Bedggood P and Metha A, “Direct visualization and characterization of erythrocyte flow in human retinal capillaries,” Biomed Opt Express 3, 3264–3277 (2012). [DOI] [PMC free article] [PubMed] [Google Scholar]
- 15.Gu B, Wang X, Twa MD, Tam J, Girkin CA, and Zhang Y, “Noninvasive in vivo characterization of erythrocyte motion in human retinal capillaries using high-speed adaptive optics near-confocal imaging,” Biomed Opt Express 9, 3653–3677 (2018). [DOI] [PMC free article] [PubMed] [Google Scholar]
- 16.Lu J, Gu B, Wang X, and Zhang Y, “High speed adaptive optics ophthalmoscopy with an anamorphic point spread function,” Opt Express 26, 14356–14374 (2018). [DOI] [PMC free article] [PubMed] [Google Scholar]
- 17.Tam J, Martin JA, and Roorda A, “Noninvasive visualization and analysis of parafoveal capillaries in humans,” Invest Ophthalmol Vis Sci 51, 1691–1698 (2010). [DOI] [PMC free article] [PubMed] [Google Scholar]
- 18.Weldon TP, Higgins WE, and Dunn DF, “Efficient Gabor filter design for texture segmentation,” Pattern Recognition 29, 2005–2015 (1996). [Google Scholar]
- 19.Jerman T, Pernus F, Likar B, and Spiclin Z, “Enhancement of Vascular Structures in 3D and 2D Angiographic Images,” IEEE Trans Med Imaging 35, 2107–2118 (2016). [DOI] [PubMed] [Google Scholar]
- 20.Otsu N, “A Threshold Selection Method from Gray-Level Histograms,” IEEE Transactions on Systems, Man, and Cybernetics 9, 62–66 (1979). [Google Scholar]
- 21.Ballard DH, “Generalizing the Hough transform to detect arbitrary shapes,” Pattern Recognition 13, 111–122 (1981). [Google Scholar]
- 22.Bland JM and Altman DG, “Statistical methods for assessing agreement between two methods of clinical measurement,” Lancet 1, 307–310 (1986). [PubMed] [Google Scholar]
- 23.Secomb TW, “Blood Flow in the Microcirculation,” Annual Review of Fluid Mechanics 49, 443–461 (2017). [Google Scholar]
- 24.Pournaras CJ, Rungger-Brandle E, Riva CE, Hardarson SH, and Stefansson E, “Regulation of retinal blood flow in health and disease,” Prog Retin Eye Res 27, 284–330 (2008). [DOI] [PubMed] [Google Scholar]
- 25.Bedggood P and Metha A, “Recovering the appearance of the capillary blood column from under-sampled flow data,” Opt Lett 45, 4320–4323 (2020). [DOI] [PubMed] [Google Scholar]
Associated Data
This section collects any data citations, data availability statements, or supplementary materials included in this article.
Supplementary Materials
Data Availability Statement
Data underlying the results presented in this paper are available in Data File 1, Data File 2, and Data File 3.


