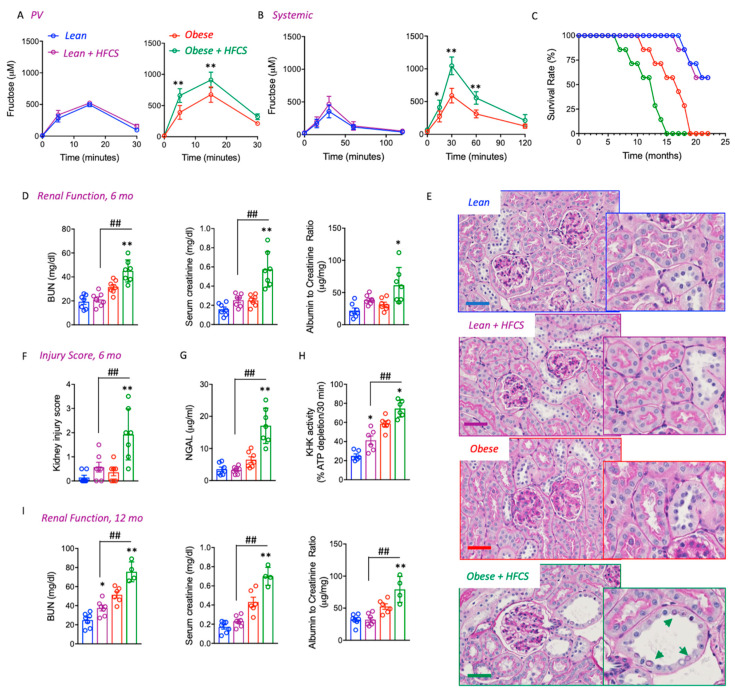
Figure 2.
HFCS Accelerates CKD and Mortality in Obese Mice. (A) Portal vein fructose levels in naïve (never exposed before, red) or chronically fed high fructose corn syrup (HFCS, green) lean and obese mice challenged with a 1.25 g/kg of lean mass oral fructose gavage. (B) Systemic circulating fructose levels in naïve (never exposed before, red) or chronically fed high fructose corn syrup (HFCS, green) lean and obese mice challenged with a 1.25 g/kg of lean mass oral fructose gavage. (C) Survival rate in lean (blue), lean fed HFCS (purple), obese control (red) and obese fed HFCS (green) over a 22-month period (D) Renal function determined as plasma creatinine (left), blood urea nitrogen (BUN, center), and albuminuria (right) in lean (blue), lean fed HFCS (purple), obese control (red), and obese fed HFCS (green) at 6 months of age. (E) Representative PAS kidney images of lean (blue), lean fed HFCS (purple), obese control (red), and obese fed HFCS (green) at 6 months of age. Green arrows indicate the glycosylated nuclei in, dilated distal tubules. Scale bar 200 μm (F) Injury score in lean (blue), lean fed HFCS (purple), obese control (red) and obese fed HFCS (green) at 6 months of age. (G) Urinary NGAL in lean (blue), lean fed HFCS (purple), obese control (red), and obese fed HFCS (green) at 6 months of age. (H) KHK-A/C (KHK) activity in kidney cortex of lean (blue), lean fed HFCS (purple), obese control (red), and obese fed HFCS (green) at 12 months of age. (I) Renal function determined as plasma creatinine (left), blood urea nitrogen (BUN, center), and albuminuria (right) in lean (blue), lean fed HFCS (purple), obese control (red), and obese fed HFCS (green) at 12 months of age. n = 4–7 mice per group. The bar graphs show mean ± SEM. * p < 0.05 and ** p < 0.01 versus respective lean or obese control mice, ## p < 0.01 between obese and lean mice on HFCS by one way ANOVA and post-hoc Tukey’s comparison test.

