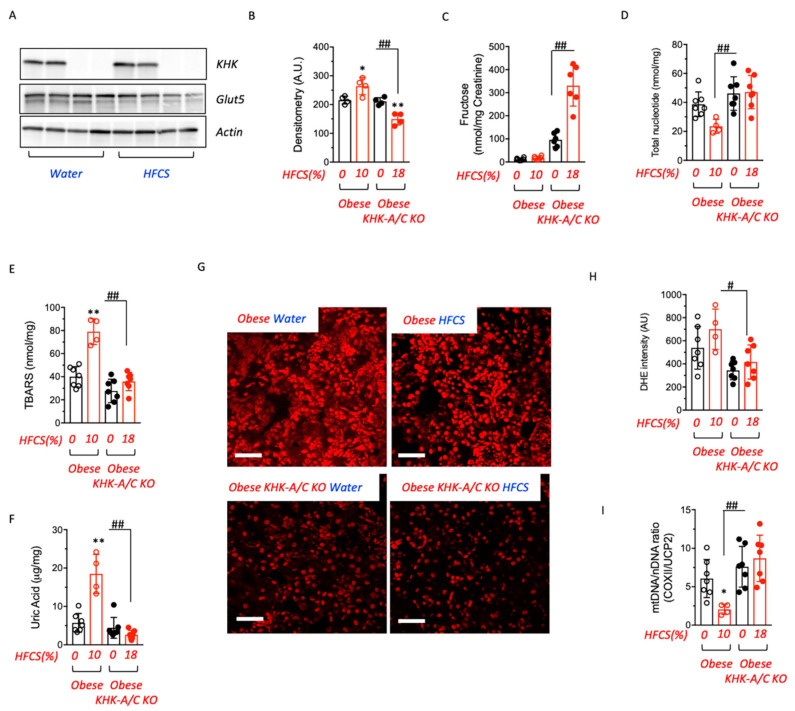
Figure 4.
Renal fructose metabolism is necessary for fructose reabsorption and metabolic dysregulation. (A,B) KHK-A/C (KHK), Glut5 and actin control expression and densitometry in kidney cortex of obese control and KHK-A/C knockouts on water or fed HFCS at 12 months of age. (C) 24-h urinary fructose levels in obese control and KHK-A/C knockouts on water (black) or fed HFCS (red) at 12 months of age. (D) Energy charge (total nucleotide ATP+ADP+AMP levels) in obese control and KHK-A/C knockouts on water (black) or fed HFCS (red) at 12 months of age. (E) Renal thiobarbituric reactive substances (TBARS) in obese control and KHK-A/C knockouts on water (black) or fed HFCS (red) at 12 months of age. (F) Renal uric acid in obese control and KHK-A/C knockouts on water (black) or fed HFCS (red) at 12 months of age. (G,H) Representative dihydroethidium images and quantification of obese control and KHK-A/C knockouts fed water or HFCS at 12 months of age. Scale bar 100 μm. (I) Renal mitochondrial (mtDNA) to nuclear DNA (nDNA) ratio in obese control and KHK-A/C knockouts on water (black) or fed HFCS (red) at 12 months of age, COXII cytochrome C Oxidase II, UCP2 Uncoupling protein 2. n = 4–7 mice per group. The bar graphs show mean ± SEM. * p < 0.05 and ** p < 0.01 versus respective water control, # p < 0.05 and ## p < 0.01 significative by one-way ANOVA and post-hoc Tukey’s comparison test.

