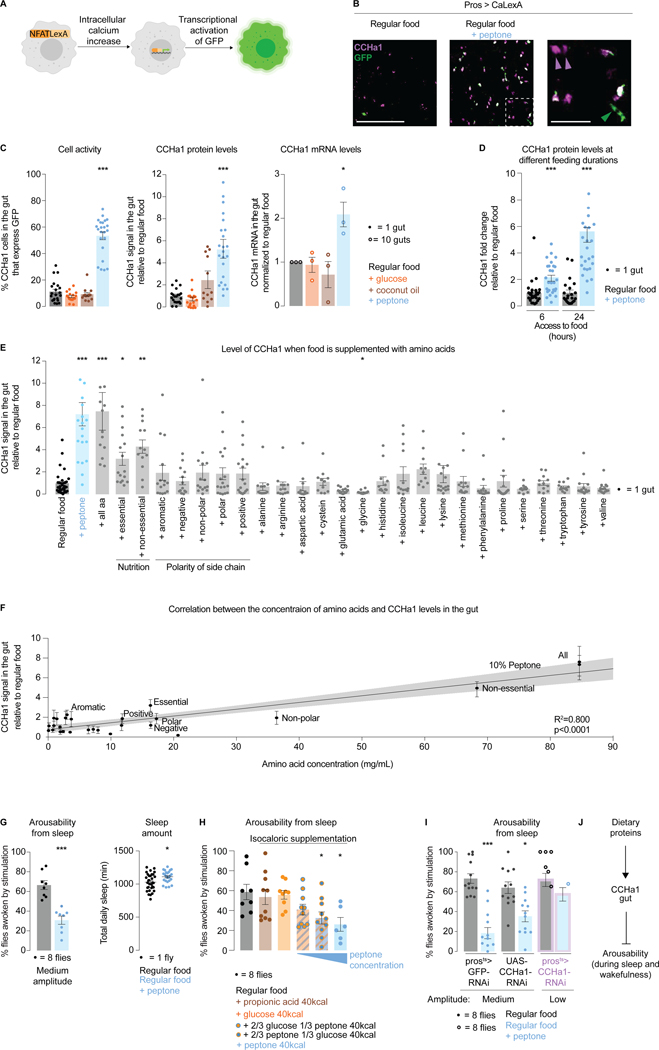
Figure 3. CCHa1-expressing enteroendocrine cells are activated by dietary proteins and promote deeper sleep.
(A) Schematized CaLexA tool. (B) A representative image showing the effect of protein supplementation on the levels of CaLexA-dependent GFP, and CCHa1, in enteroendocrine cells. Area outlined in the second panel in magnified in the third panel. White asterisks: activated CCHa1-producing cells. Magenta arrows: non-activated cells that produce CCHa1. Green arrows: activated cells that do not produce CCHa1. Scale bars: 100 μm and 25μm (zoom-in). (C) Quantification of enteroendocrine cell activity, and their levels of CCHa1 protein and mRNA. (D) CCHa1 protein levels after 6 or 24 hours of peptone supplementation. (E) CCHa1 levels in the gut when food is supplemented with individual or combined amino acids (at their respective concentrations in peptone). (F) CCHa1 levels relative to supplemented amino acid concentration. (G) Effect of dietary proteins on arousability from sleep, and total sleep amount. (H) Effect of equicaloric supplementation with different macronutrients on arousability from sleep. (I) Arousability from sleep on regular food (gray) vs peptone-supplemented food (blue), in controls (prosts>GFP-RNAi and UAS-CCHa1-RNAi) and in flies with gut-depleted CCHa1 (prosts>CCHa1-RNAi, purple outline). (J) Schematic. For (C , D, and E), normalized to regular food (STAR Methods). Error bars, mean and S.E.M. Genotypes, sample sizes and statistical analyses, Table S3. See also Figure S3.

