

Abstract
BACKGROUND:
This study aimed to identify pain-related behavior and pathological characteristics of the knee joint in rats with monosodium iodoacetate (MIA)-induced osteoarthritis (OA).
METHODS:
Knee joint inflammation was induced by intra-articular injection of MIA (4 mg/50 µL, n = 14) in 6-week-old male rats. Knee joint diameter, weight-bearing percentage on the hind limb during walking, the knee bending score, and paw withdrawal to mechanical stimuli were measured to evaluate edema and pain-related behavior for 28 d after MIA injection. Histological changes in the knee joints were evaluated using safranin O fast green staining on days 1, 3, 5, 7, 14, and 28 after OA induction (n = 3, respectively). Changes in bone structure and bone mineral density (BMD) were examined 14 and 28 d after OA (n = 3, respectively) using micro-computed tomography (CT).
RESULTS:
The knee joint diameter and knee bending scores of the ipsilateral joint significantly increased 1 d after MIA injection, and the increased knee joint diameter and knee bending score persisted for 28 d. Weight-bearing during walking and paw withdrawal threshold (PWT) decreased from 1 and 5 d, respectively, and were maintained up to 28 d after MIA. Cartilage destruction started on day 1, and Mankin scores for bone destruction significantly increased for 14 d, as shown by micro-CT imaging.
CONCLUSION:
The present study demonstrated that histopathological structural changes in the knee joint due to inflammation started soon after MIA injection, which induced OA pain from inflammation-related acute pain to spontaneous and evoked associated chronic pain.
Keywords: Osteoarthritis, Monosodium iodoacetate model, Articular cartilage, Arthritic pain, Histopathology
Introduction
Osteoarthritis (OA) is a chronic disease accompanied by degenerative changes in the entire joint structure [1], leading to limited daily activities accompanied by chronic joint pain [2, 3], which degrades the quality of life of the patient [4]. The symptoms of OA are largely classified as inflammation and pain. Inflammation is a major key to the onset of OA, and pain occurs throughout the overall pathological phase of OA. Among the complaints of patients with chronic OA, pain evoked by daily activities is a major complaint. However, there is a lack of studies that experimentally well mimic the symptoms of patients with clinical OA, as well as studies that integrated the characteristics of progression of OA symptoms.
Based on the various etiologies of clinical OA, many experimental models and measurement methods have been developed to investigate the pathological mechanisms of pain following OA. One of the most common experimental OA models is the chemical induction model using monosodium iodoacetate (MIA), classified as secondary OA [5] induced by specific factors. MIA selectively inhibits proteoglycan synthesis [6] and glyceraldehyde-3-phosphate dehydrogenase, a key enzyme in the Krebs cycle [7, 8]. Despite the different pathophysiology with rapid progression compared to clinical OA, MIA-induced OA models in rats and mice have generally been used to evaluate sustained pain-related behaviors and the pain-relieving efficacy of drugs. Therefore, it is important to investigate the specific characteristics of pathological progression of MIA-induced OA.
Histological analysis of the MIA-induced OA model is usually conducted to elucidate the involved molecular pathways and the state of the cellular phase [9, 10]; however, it is difficult to continuously and directly follow up pathological changes in the structure of the knee joint. Micro-computed tomography (micro-CT), a non-invasive method using X-rays to visualize a 3D model, stacking physical cross-sections, is another method for observing knee joint structure. Micro-CT has been commonly used to analyze micro-architectural changes and the mechanical characteristics of bone in patients with OA to follow over time and may be more suitable for following up the in vivo pathologic status of OA knee joints. However, many previous studies using micro-CT [11–14] have focused only on mechanical or structural analysis of bone in OA. There has been still a lack of systemic studies analyzing the integrated characteristics, including from histological and structural changes, as well as the occurrence of pain-related OA symptoms.
In the present study, we investigated the characteristics associated with histopathological structural changes in the knee joint and the development of chronic pain in rats with MIA-induced OA. To this end, we assessed histopathological changes in the knee joint accompanied by OA pain-related behaviors after MIA injection in rats. In addition, we evaluated the bone mineral density (BMD) of femurs and tibias from rats with OA using micro-CT imaging of cartilage to observe the structural and biomechanical changes in MIA-induced OA rats.
Materials and methods
Experimental animals
Six-week-old male Sprague–Dawley rats (150–200 g, N = 42; Orient Bio Inc., Seoul, Republic of Korea) were maintained in cages under a 12-h light/12-h dark cycle with access to food and water ad libitum. This study was approved by the Korea University Institutional Animal Care and Use Committee (KUIACUC-2019–67), and all experiments were conducted in accordance with the relevant guidelines.
MIA-induced OA model
To induce OA, MIA (4 mg in 50 µL of saline; Sigma-Aldrich, St. Louis, MO, USA) was injected into the right knee joint cavity of anesthetized rats (2–3% isoflurane in O2), using a 30-gauge insulin syringe [15].
Assessment of behavioral signs for pain and inflammation
Knee joint diameter
The diameter of the knee joints was measured, using a caliper, in order to assess edema before and after the MIA injection. The diameter was measured from the medial to the lateral skin around the collateral ligaments of the flexed knee joints. The external jaws of the calipers were placed on the skin, without strong pressure. The diameter of each knee joint was measured thrice and averaged to calculate the ipsilateral/ contralateral ratio of the knee joint diameter.
Weight bearing test
The weight load of the hind limbs was measured as described in a previous study [16] to test pain-related behavior patterns caused by free walking in rats. The weight load of each hind limb was assessed, while the animals walked along a path comprising eight plates using strain gauge weight sensors (DACELL, Cheongju, Republic of Korea). The output of each weight load sensor was magnified and filtered through a DN-AM 310 digital amplifier (DACELL). Processed signals were sent to a personal computer via an analog–digital converter (PCM1716; Texas Instruments, Dallas, TX, USA) and plotted as a time-weight curve using WBT software (Korea University, Seoul, Republic of Korea) [10]. The test was repeated two or three times until at least five sets of weight-time curves were obtained for each hind limb. The weight distribution (%) was then calculated as follows and was expressed in averaged values:
| 1 |
Knee bending test
Passive movement-evoked pain in the OA knee joint was quantified using knee-bending tests [17]. To stably perform the knee bending test, the head and body of the rats were fixed, and the eyes were covered. Each test consisted of five flexions and extensions of the right and left knee joints, and the total number of squeaks (vocalization) and struggle reactions was scored for each knee joint on a scale of 0–2 as follows: 0, no response to any knee joint flexion or extension; 0.5, struggle at the end of the joint motion range; 1, struggle in the middle of the joint motion range or vocalization at the end of the joint motion range; and 2, vocalization in the middle of the joint motion range. The knee bending scores were summed, and the maximum score was 20.
Paw withdrawal threshold (PWT)
To assess mechanical hypersensitivity, considered secondary hyperalgesia mediated by central sensitization [18, 19], PWT was determined using a graded mechanical stimulus with a series of eight von Frey filaments (Stoeling, Wood Dale, IL, USA). The threshold for eliciting withdrawal of 50% of the time was determined using an up-down method [20]; the process was initiated with a 2.0 g (4.31 mN) strength filament in the middle of the von Frey filament series, with a logarithmic increase in stiffness (0.41–15.10 g). The 50% threshold was interpolated as described by Dixon [21].
Tissue preparation and immunohistochemistry
Tissues were extracted from the right knee joints of normal and OA rats at 1, 3, 5, 7, 14, and 28 d after the MIA injection (n = 3, respectively). The rats were deeply anesthetized with urethane (1 g/kg, s.c.) and perfused intracardially with 0.9% saline containing heparin (0.2 ml/L), followed by 4% paraformaldehyde in phosphate-buffered saline. The tissues were post-fixed in 4% paraformaldehyde for 1 d at 4 °C, decalcified in 10% ethylenediaminetetraacetic acid disodium salt dihydrate (EDTA) in distilled water at 4 °C for approximately 4 weeks, and sliced into 14-µm sagittal sections, using a Microm HM550 cryostat microtome (Thermo Fisher Scientific Inc., Waltham, MA, USA). The sections were stained with Harris hematoxylin, 0.025% fast–green FCF, and 0.1% safranin O (Sigma-Aldrich). The sections were assessed using the histological/histochemical grading system (HHGS) developed by Mankin et al. [22] and scored as described in a previous study [23], to analyze histopathological changes in MIA-induced OA. We serially analyzed at least three tissues per 0.5 mm (depth) from the lateral to the medial part of the joint. The data are expressed in average values.
Micro-CT imaging and BMD analysis
Bilateral hind limbs were dissected 14 and 28 d after the MIA injection (n = 3, respectively). The dissected limbs were stored in 4% paraformaldehyde and, fixed using a thin wooden bar of approximately 10 cm to maintain a specific knee joint angles.
We acquired CT images of the knee joints using a Quantum GX Micro-CT system (PerkinElmer, Hopkinton, MA, USA) located at the Korea Basic Science Institute (Gwangju, Republic of Korea). The X-ray source for 3D imaging and measurement of bone mineral density (voxel size, 20 μm; scan duration, 4 min) was set as follows: 90 kV and 80 μA with a field of view of 25 and 10 mm, respectively.
The 3D images were visualized using 3D Viewer software, which was integrated within Quantum GX. The structural parameters of the trabecular bone were analyzed using Analyze 12.0 (AnalyzeDirect, Overland Park, KS, USA). BMD of the femur and tibia was estimated using a QRM-Micro-CT-hydroxyapatite (HA) phantom (Quality Assurance in Radiology and Medicine GmbH., Möhrendorf, Germany) and scanned using the same parameters. BMD, total volume, and bone volume of the femurs and tibias were calculated using the region of interest tool. We then assessed the mechanical properties of the bone by calculating bone volume (BV) fracture, which is the ratio of BV to tissue volume (BV/TV), apparent density, modulus of elasticity, and yield strength [24].
Statistical analysis
All values were expressed in mean ± SD. A repeated-measures two-way analysis of variance (RM ANOVA) test was used to compare significant mean differences based on the behavioral data measured over several time points, followed by Tukey’s post-hoc test. If the data did not meet the parametric testing assumptions, Mann–Whitney U test was used to investigate differences between groups at each time point, and Friedman’s test with post-hoc Wilcoxon test was used to assess differences with pre-values within subjects. To analyze the histological data, one-way ANOVA followed by Tukey’s post-hoc test was used. To determine the relationship between the pathological progression of histological changes and the occurrence of OA symptoms, the ratio of pathological changes for each assessment was normalized using pre-values. The normalized ratio was tested using Mann–Whitney U test to evaluate statistical differences at each time point compared to histological changes. Statistical significance was set at p < 0.05. All data were statistically analyzed using IBM SPSS (version 26.0; IBM, Armonk, NY, USA).
Results
Knee joint edema
One day after the MIA injection, the knee joint diameter of the ipsilateral side significantly increased compared to that of the contralateral side; the ipsilateral/contralateral diameter ratio on day 1 was the largest (approximately 1.4) throughout the study (p < 0.0001, Fig. 1A). The rapid swelling of the knee joint on day 1 declined on day 3 but remained significantly above the baseline value throughout the study.
Fig. 1.

Edema and pain behavior over time after MIA injection. Osteoarthritic parameters were assessed before and 1, 3, 5, 7, 10, 14, 21, and 28 days after the MIA injection (monosodium iodoacetate, 4 mg/50 µL, n = 14). A Edema associated with inflammation induced by MIA was assessed as the ratio of ipsilateral to contralateral knee joint diameters. B Weight bearing on the ipsilateral sides was determined in freely walking rats and expressed in percentage (%) as follows: ipsilateral side weight bearing/(ipsilateral + contralateral side weight bearing) × 100. C Passive movement-evoked pain quantified using the knee bending test. D Paw withdrawal threshold (PWT) was determined to evaluate the difference in mechanical hypersensitivity between the ipsilateral and contralateral sides. All data are expressed in mean ± SEM. * indicates significant differences in values at each time point compared to those of the pre-test (p < 0.05; A and B, RM ANOVA with Tukey post-hoc test; C and D, Friedman’s test with Wilcoxon post-hoc test). †indicates significant differences between ipsilateral and contralateral sides (p < 0.05; Mann–Whitney U test)
Movement-evoked pain during activity
Weight bearing distribution during free walking was calculated measuring the weight load of the rats before and after the MIA injection in order to evaluate movement-evoked pain during physical activity. Prior to the MIA injection, the distribution of the weight load in each hind limb was equal. However, after the MIA injection, the weight load on the ipsilateral hind limb significantly decreased. The distribution of weight bearing was significantly higher on the contralateral hind limb than on the ipsilateral hind limb on day 3 (p < 0.0001, Fig. 1B). The weight distribution of the ipsilateral hind limb slightly improved compared to that on day 3 but did not reach 50% of the total body weight, even during the chronic phase.
Passive movement-evoked pain
Passive movement-evoked pain on the ipsilateral and contralateral sides of the knee joints was evaluated using the knee bending score. The knee bending score of the ipsilateral joint significantly increased immediately after the MIA injection with a posture that minimized contact between the paw and floor. The score reached a maximum on day 3 (p < 0.0001, Fig. 1C). In contrast, the knee bending score of the contralateral joint did not change significantly. Ipsilateral scores exhibited a slight but continuous decrease until day 28.
Mechanical hypersensitivity
PWT to von Frey stimulation did not show any significant difference from the pre-value up to 3 d after the MIA injection. PWT of the ipsilateral hind paw significantly decreased from days 5 to 10 after the MIA injection (p < 0.05, Fig. 1D), and a PWT of < 2 g was maintained throughout the study, which was interpreted as a sign of mechanical hypersensitivity induced by MIA.
Histopathological changes
We assessed the histopathological changes in the MIA-induced OA knee joint cavity, using safranin O fast green staining and Mankin scores. Immediately after the MIA injection, chondrocytes became hypercellular (Fig. 2A), cloned (Fig. 2B), and hypocellular (Fig. 2C), and the blood vessels penetrated the cartilage (Fig. 2D). The structure of the knee joint started to be destroyed on day 1, and the degree of deterioration worsened over time after the MIA-induced OA. Subchondral bone changes started after 3 days, accompanied by fibrovascular angiogenesis (Fig. 2G) and progressive sclerosis (Fig. 2H). The bone shape significantly changed 14 d after the MIA injection. The shape of the tibial plateau was significantly disrupted (Fig. 2E and F), which was associated with the significantly increased Mankin score on day 14 (Fig. 3C). At 28 d after the MIA-induced OA, the structure of the femur and tibia completely collapsed to the subchondral trabecular region (Fig. 2F), and the highest Mankin score of 14 was observed (Fig. 3A, C). The degree of deterioration was more severe in the posterior part of the joint than in the anterior part (Fig. 2E, F). The findings of serial analysis (Fig. 3B, D) of the femur and tibia were similar. The Mankin score was higher at the center (score 12–14) than at the edge of the joint (score 7–10), and the score of the tissues at 14 and 28 d after the MIA injection was 14 (maximal value), regardless of depth.
Fig. 2.

Histological changes in arthritic knee joints over time. Histopathological changes in arthritic knee joints over time were stained with Safranin O fast green (SOFG). A–C Histological cellularity of chondrocytes in femoral condyle Sects. 1 d after the MIA injection. Mankin scores of 1 (A) hypercellular chondrocytes, 2 (B) cloned chondrocytes, and 3 (C) hypocellularity. D Black arrows indicate tidemark integrity destroyed by blood vessel penetration into the cartilage on day 1 after the MIA injection. Completely disorganized articular cartilage and subchondral bone in the femur and tibia E days 14 and F 28. G Fibrovascular tissue in the subchondral bone of the femoral condyles three days after the MIA injection. H Intermediate stage of subchondral sclerosis in femoral condyles at 3 days after MIA injection. Scale bar: A–C, 50 µm; D, 100 µm; E and F, 2 mm; G and H, 200 µm. F, femur; T, tibia; MIA, monosodium iodoacetate
Fig. 3.

Histological analysis of arthritic knee joints. Histological analysis of knee joints stained with Safranin O fast green after the MIA injection, assessed using HHGS developed by Mankin* (Mankin score). A Histological analysis of the femurs. B Serial analysis of the lateral-to-medial part of the femur. C Histological analysis of the tibias. D Serial analysis of the lateral-to-medial part of the tibia. All data are expressed in means ± SEM. *Indicates significant differences in values at each time point compared to those of the normal group (p < 0.05; one-way ANOVA with Tukey’s post-hoc test). HHGS, histological/histochemical grading system; MIA, monosodium iodoacetate; SEM, standard error of the mean
Structural changes analyzed by micro-CT after MIA-induced OA
We compared the bones of normal and OA knee joints at 14 and 28 d after the MIA injection using 3D micro-CT images, when complete collapse of the joint structure was observed with the highest Mankin score (Fig. 3A, C). The bone surface was smooth, and the joint structure was distinct in normal knees (Fig. 4A, D), but it was rough and uneven with an indefinite boundary of structure in OA knee joints. In particular, the epicondyle structure was significantly corroded in the anterior and posterior regions (Fig. 4B, C, E, F). The shape of the patella also changed. The borders of the patella and patella groove were broken and almost disappeared 28 d after the MIA-induced OA (Fig. 4H). Osteophytes were evident on day 28 (Fig. 4G) and the edge of the tibial plateau was severely pitted (Fig. 4I). The degree of erosion was more severe in the posterior and lateral parts of the tibial plateau (Fig. 4F). The trabecular bones decreased as OA progressed (Fig. 5), and to a greater degree, in the tibia than in the femur, in particular, at 28 d after the MIA-induced OA. The cortical bone area and thickness increased, and the porosity of cortical bone decreased on day 28 compared to that on day 14, indicating joint stiffness (Table 1).
Fig. 4.

Micro-CT images showing anterior and posterior views of arthritic knee joints. Micro-CT images showing anterior and posterior views of normal rat knee joints (A and D; n = 1) and osteoarthritic rat knee joints 14 (B and E; n = 3) and 28 (C and F; n = 3) days after the MIA injection. G Rough, uneven surface of the femoral condyle. H The boundary of the patella and patellar groove almost completely disappeared. I Osteophytes and pitted tibial plateau. Normal and OA knee joints were dissected simultaneously. Scale bar, 1 mm. MIA, monosodium iodoacetate; OA, osteoarthritis
Fig. 5.

Micro-CT images showing femoral and tibial cross-sections from OA rats. Micro-CT images showing femoral and tibial cross-sections from normal rats (A and D; n = 1) and OA rats 14 (B and E; n = 3) and 28 (C and F; n = 3) days after the MIA injection. Femoral sections were obtained above the femoral condyles, and tibial sections were obtained below the tibial plateau. Scale bar, 1 mm. MIA, monosodium iodoacetate; OA, osteoarthritis
Table 1.
Mechanical properties of the subchondral bones from normal and OA rats
| Category | ρ_TISSUE (g/cm3) | BV/TV (mm3/mm3) | ρ_APP (g/cm3) | E (MPa) | σ_YIELD (MPa) | Ct.Ar/Tt.Ar (%) | Ct.Th (mm) | Ct.Po (%) | |
|---|---|---|---|---|---|---|---|---|---|
| Femur | |||||||||
| Normal 14 day | Avg | 0.252 | 0.447 | 0.113 | 186.142 | 1.485 | 43.618 | 101.958 | 0.040 |
| MIA 14 day | Avg | 0.268 | 0.403 | 0.108 | 175.939 | 1.389 | 39.148 | 90.815 | 0.060 |
| SE | 0.011 | 0.018 | 0.003 | 7.593 | 0.071 | 1.718 | 4.389 | 0.006 | |
| Normal 28 day | Avg | 0.226 | 0.446 | 0.101 | 160.165 | 1.240 | 41.717 | 111.877 | 0.040 |
| MIA 28 day | Avg | 0.228 | 0.435 | 0.099 | 157.265 | 1.221 | 42.716 | 104.571 | 0.030 |
| SE | 0.028 | 0.003 | 0.012 | 25.294 | 0.230 | 0.661 | 3.726 | 0.010 | |
| Tibia | |||||||||
| Normal 14 days | Avg | 0.389 | 0.567 | 0.220 | 467.533 | 4.472 | 48.765 | 126.690 | 0.320 |
| MIA 14 days | Avg | 0.358 | 0.418 | 0.150 | 275.289 | 2.376 | 37.592 | 95.389 | 0.217 |
| SE | 0.006 | 0.022 | 0.009 | 22.018 | 0.229 | 2.398 | 5.748 | 0.023 | |
| Normal 28 day | Avg | 0.388 | 0.493 | 0.191 | 385.511 | 3.550 | 39.923 | 119.568 | 0.190 |
| MIA 28 day | Avg | 0.325 | 0.421 | 0.137 | 243.094 | 2.047 | 40.957 | 106.927 | 0.107 |
| SE | 0.010 | 0.022 | 0.008 | 18.773 | 0.187 | 2.875 | 1.921 | 0.007 | |
Mechanical properties of subchondral bones from normal (n = 1) and OA rats at 14 (n = 3) and 28 (n = 3) days after MIA injection
BV/TV bone volume fraction; Ct.Ar/Tt.Ar cortical area fraction; Ct.Po cortical porosity; Ct.Th average cortical thickness; E modulus of elasticity; MIA monosodium iodoacetate; ρ_TISSUE tissue density; ρ_APP apparent density; σ_YIELD yield strength
The apparent BMD was calculated for the femur and tibia of the normal and OA knees (Table 1). The apparent BMD of the normal and OA knees decreased over time, and the apparent BMD was higher in the normal knees than in the OA knees on days 14 and 28 (Table 1). This difference was more significant in the tibias than in the femurs. The modulus of elasticity and yield strength showed a similar tendency, with a significant difference between the tibias of the normal and OA knees.
Relationships between the pathological progression of histological changes and the occurrence of OA symptoms
We calculated the normalized change ratio for each assessment in order to observe the progression pattern of histopathological changes, symptoms occurrence following OA, and their relationship (Fig. 6). In these data, the statistical differences indicated that the occurrence of OA symptoms was relatively less related to the histological changes at that time point. On day 1, which could be called the early acute phase, histological changes and OA symptoms showed a relatively increased pattern, except for mechanical hypersensitivity. This increased pattern continued until day 3, which was still in the acute phase, but the degree of knee joint edema decreased. There was no observable trend among them on days 5–7. However, only mechanical hypersensitivity, considered secondary hyperalgesia mediated by central sensitization following OA, showed a similar pattern to histological changes on days 14 and 28.
Fig. 6.
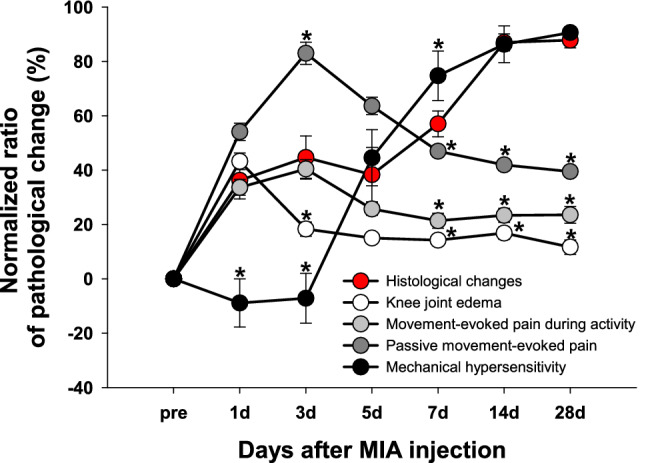
The relationships between the pathological progression of histological changes and the occurrence of OA symptoms. The relationships between the pathological progression of histological changes and the occurrence of OA symptoms were shown through the ratio of pathological changes for each assessment normalized by the pre-value. The mean values of Mankin scores from the femur and tibia at each time point were used for reflecting histological changes. The behavioral data used for each OA symptom were as follows; knee joint diameters reflecting edema, weight bearing reflecting movement-evoked pain during activity, knee bending test reflecting passive movement-evoked pain, and PWT reflecting mechanical hypersensitivity. *indicates significant differences in values at each time point compared to histological changes (p < 0.05; Mann–Whitney U test). These statistical differences indicate that the occurrence of OA symptoms is relatively less related to the histological changes at that time point
Discussion
The present results demonstrate that MIA injection into the knee joint cavity increased cellularity of chondrocytes, which led to the death of chondrocytes and associated histological changes. In addition, cartilage lesions followed by inflammation were associated with changes in the subchondral bone microstructure in the late-stage of OA, eventually leading to functional deterioration of the joint with changes of biomechanical characteristics. During these pathological processes, pain was accompanied sequentially, the major mechanism of which might differ according to the pathological stage.
The first stage of OA at the cellular level is hypercellularity. Proliferating chondrocytes secrete pro-inflammatory cytokines, including interleukin (IL)-1, and tissue destructive enzymes such as matrix metalloproteinases, which rather contribute to destruct themselves [25, 26]. In the present study, synovial inflammation was maximal 1d after the MIA injection, based on chondrocyte hypercellularity, collapsed integrity of the tidemark caused by blood vessels (Fig. 2A–D), and the highest joint diameter ratio (Fig. 1A). This suggested that the MIA model mimics well the pathological mechanism of OA at the cellular level. MIA inhibits glyceraldehyde-3-phosphate dehydrogenase [7, 8], leading to abnormal metabolism accompanied by excessive inflammation in the articular cartilage microenvironment. This cell shift toward hypercellularity might lead to the thinning of the soft articular cartilage and destroy the boundary between articular and calcified cartilage, which is shown as a histological stiff cleft or pannus, resulting in an abnormal functional joint unit leading to joint instability. This is the process that the inflammation leads to persistent pathologic status [25, 27].
In this study, the subchondral bone underwent significant histological, structural, and biomechanical changes concurrently with pathological cartilage changes three days after the MIA-induced OA. This can be explained by bone-cartilage crosstalk via additional vascular communication that provokes unpredicted molecular diffusion [1]. Lyons et al. [28] and Walsh et al. [29] reported increased angiogenesis from the subchondral bone marrow to articular cartilage in the presence of vessels and channels in patients with OA. Under these conditions, increased cellular activity of the subchondral bone leads to osteophyte formation at the edge of the joint and trabecular bone remodeling [30], as shown in our data (Figs. 4, 5). However, the degree of mineralization, which determines the mechanical properties of bone [31], might not always occur at the same rate as trabecular bone remodeling. Therefore, the elasticity and yield strength of de novo remodeled bone undergoing OA pathogenesis may be lower than those of normal bone as shown in this study (Table 1). These pathological changes in the OA joint disrupt joint stability, induce immobility, and eventually affect the functional deterioration of the joint manifested by weight-bearing disturbance (Fig. 1B). We used the correlation equation calculated by Cory et al. [24] to noninvasively calculate mechanical properties, using the measured BMD. Although they used different OA models, their correlation equation could generally be applied to study the mechanical characteristics according to the rat BMD. However, our results might have limited on using indirect assessment to measure BMD by their statistical correlated equation, and further studies are needed.
Osteoarthritic pain is considered to be nociceptive pain elicited by damage to the lesion tissue, but long-lasting inflammation in the joint cavity causes subsequent changes in nociceptive neurons, which can induce neuropathic pain [19]. In the present study, we measured the knee bending score and evaluated the PWT. The knee bending test can reflect passive movement-evoked pain, indicating primary hyperalgesia which is directly induced by inflammation [19, 32]. Pro-inflammatory cytokines, such as IL-1 and IL-6, and neuropeptides, such as substance P (SP) and calcitonin gene-related peptide, are secreted at sites of injury or inflammation [33]. These factors play crucial roles in the initiation and persistence of inflammation, which induces nociceptive pain by directly activating nociceptors in sensory neurons [33]. The present results demonstrated that a significantly increased knee-bending score was closely associated with the increased diameter ratio reflecting edema due to inflammation, during the acute phase of the MIA-induced OA (Fig. 1A, C, Fig. 6). The activation of nociceptors by persistent inflammation leads to hyperexcitation of secondary neurons in the spinal cord, called central sensitization, which is related to chronic neuropathic pain development following OA [18, 19]. The hind paw is the distal region of the OA pathological site induced by the MIA injection into the knee joint. The increased sensitivity of this region to mechanical stimuli indicates the development of secondary hyperalgesia through central sensitization [19]. Therefore, the decreased mechanical PWT after the MIA-induced OA (Fig. 1D) could be interpreted as the development of neuropathic pain originating from inflammatory pain caused by central sensitization. A decrease in weight-bearing (Fig. 1B) was also observed throughout the onset and progression of these primary and secondary hyperalgesias. In terms of pain behavior, the weight-bearing test indicated spontaneous-evoked pain from weight-load while freely walking, which is a major inconvenience in patients with chronic OA.
A single OA animal model cannot reflect all the heterogeneity of OA, and pathological progress can differ depending on the animal, age, species, housing conditions, and sex [34–37]. Therefore, it was important to select appropriate models and design conditions for this study. The validity of MIA as a model for clinical OA has been questioned due to its rapid progression of joint structure destruction and extensive histological damage [38, 39,35]. However, it is still the most commonly used model for researches on OA pain-related behaviors and drug efficacy evaluation [10, 32, 40, 41] owing to its high reproducibility and sustained symptoms of OA. Previous studies have shown that MIA sensitizes joint nociceptors in a dose-dependent manner, and structural changes in joints can be induced even with a small dose of MIA for a long period [42, 43]. However, pain behavior might not be distinct [43] and weight-bearing manifesting spontaneously-evoked pain during physical activity, a major symptom of patients with chronic OA in the clinical situation, might be difficult to assess with a low dose of MIA [44]. Based on the previous studies, thus, we chose the dose of 4 mg MIA to evaluate sustained OA pain-related behaviors with distinguishable functional deterioration accompanied by structural destruction which clinical OA patients suffer from [45, 46].
In summary, the present study demonstrated that the pathological progression of MIA-induced OA was initiated by inflammation immediately after the MIA injection, which destroyed the histological structure of a functional knee joint unit, causing OA pain involving spontaneous-evoked pain from physical activity. Although our results were limited to animal models, the integrated pathological characteristics of MIA-induced OA described herein could provide preclinical evidence and basic scientific guidance for the study of therapeutic approaches for clinical OA. Further studies on the mechanisms of each coupled pathological signals are needed to clarify the interaction of the OA pathophysiology.
Acknowledgements
This work was supported by grants from the Korea Health Technology R&D Project through the Korea Health Industry Development Institute (KHIDI) funded by the Ministry of Health & Welfare, Republic of Korea (HI21C0572), the Basic Science Research Program (2019R1I1A2A01060115) funded by the Ministry of Science, and the Korea University College of Health Science (K2120571).
Author’s Contribution
MK: acquisition, interpretation, and analysis of data; drafting the article. DN: acquisition of data. JK: substantial contribution to the conception and design of the study; interpretation, and analysis of data; revising it critically for the important intellectual content; final approval for the version to be published.
Declarations
Conflict of interest
The authors have no financial conflicts of interest.
Ethical statement
This study was approved by the Korea University Institutional Animal Care and Use Committee (KUIACUC-2019–67), and all experimental protocols complied with the relevant guidelines.
Footnotes
Publisher's Note
Springer Nature remains neutral with regard to jurisdictional claims in published maps and institutional affiliations.
References
- 1.Lories RJ, Luyten FP. The bone–cartilage unit in osteoarthritis. Nat Rev Rheumatol. 2011;7:43–49. doi: 10.1038/nrrheum.2010.197. [DOI] [PubMed] [Google Scholar]
- 2.Im HJ, et al. Alteration of sensory neurons and spinal response to an experimental osteoarthritis pain model. Arthritis Rheum. 2010;62:2995–3005. doi: 10.1002/art.27608. [DOI] [PMC free article] [PubMed] [Google Scholar]
- 3.Sharma L, et al. The role of knee alignment in disease progression and functional decline in knee osteoarthritis. JAMA. 2001;286:188–195. doi: 10.1001/jama.286.2.188. [DOI] [PubMed] [Google Scholar]
- 4.Rakel B, et al. Mechanical hyperalgesia and reduced quality of life occur in people with mild knee osteoarthritis pain. Clin J Pain. 2015;31:315–322. doi: 10.1097/AJP.0000000000000116. [DOI] [PubMed] [Google Scholar]
- 5.Guingamp C, Gegout-Pottie P, Philippe L, Terlain B, Netter P, Gillet P. Mono‐iodoacetate‐induced experimental osteoarthritis. A dose‐response study of loss of mobility, morphology, and biochemistry. Arthritis Rheum. 1997;40:1670–9. [DOI] [PubMed]
- 6.Dumond H, et al. Site specific changes in gene expression and cartilage metabolism during early experimental osteoarthritis. Osteoarthritis Cartil. 2004;12:284–295. doi: 10.1016/j.joca.2003.11.008. [DOI] [PubMed] [Google Scholar]
- 7.Marker CL, Pomonis JD. Pain Rresearch. Cham: Springer; 2012. The monosodium iodoacetate model of osteoarthritis pain in the rat; pp. 239–248. [DOI] [PubMed] [Google Scholar]
- 8.Chu CR, Coyle CH, Chu CT, Szczodry M, Seshadri V, Karpie JC, et al. In vivo effects of single intra-articular injection of 0.5% bupivacaine on articular cartilage. J Bone Joint Surg Am. 2010;92:599–608. [DOI] [PMC free article] [PubMed]
- 9.Wang Z-M, Chen Y-C, Wang D-P. Resveratrol, a natural antioxidant, protects monosodium iodoacetate-induced osteoarthritic pain in rats. Biomed Pharmacother. 2016;83:763–770. doi: 10.1016/j.biopha.2016.06.050. [DOI] [PubMed] [Google Scholar]
- 10.Hahm S-C, et al. Transcutaneous electrical nerve stimulation reduces knee osteoarthritic Pain by inhibiting spinal glial cells in rats. Phys Ther. 2019;99:1211–1223. doi: 10.1093/ptj/pzz076. [DOI] [PubMed] [Google Scholar]
- 11.Kapadia RD, et al. Applications of micro-CT and MR microscopy to study pre-clinical models of osteoporosis and osteoarthritis. Technol Health Care. 1998;6:361–372. doi: 10.3233/THC-1998-65-609. [DOI] [PubMed] [Google Scholar]
- 12.Botter SM, van Osch GJ, Waarsing JH, Day JS, Verhaar JA, Pols HA, et al. Quantification of subchondral bone changes in a murine osteoarthritis model using micro-CT. Biorheology. 2006;43:379–88. [PubMed]
- 13.Allen J, et al. Effects of treadmill exercise on advanced osteoarthritis pain in rats. Arthritis Rheumatol. 2017;69:1407–1417. doi: 10.1002/art.40101. [DOI] [PMC free article] [PubMed] [Google Scholar]
- 14.Mohan G, et al. Application of in vivo micro-computed tomography in the temporal characterisation of subchondral bone architecture in a rat model of low-dose monosodium iodoacetate-induced osteoarthritis. Arthritis Res Ther. 2011;13:R210. doi: 10.1186/ar3543. [DOI] [PMC free article] [PubMed] [Google Scholar]
- 15.Kim T, Seol DR, Hahm SC, Ko C, Kim EH, Chun K, et al. Analgesic effect of intra-articular injection of temperature-responsive hydrogel containing bupivacaine on osteoarthritic pain in rats. Biomed Res Int. 2015;2015:812949. [DOI] [PMC free article] [PubMed]
- 16.Min SS, et al. A novel method for convenient assessment of arthritic pain in voluntarily walking rats. Neurosci Lett. 2001;308:95–98. doi: 10.1016/S0304-3940(01)01983-8. [DOI] [PubMed] [Google Scholar]
- 17.Ferreira-Gomes J, Adães S, Castro-Lopes JM. Assessment of movement-evoked pain in osteoarthritis by the knee-bend and CatWalk tests: a clinically relevant study. J Pain. 2008;9:945–954. doi: 10.1016/j.jpain.2008.05.012. [DOI] [PubMed] [Google Scholar]
- 18.Thakur M, Dickenson AH, Baron R. Osteoarthritis pain: nociceptive or neuropathic? Nat Rev Rheumatol. 2014;10:374–380. doi: 10.1038/nrrheum.2014.47. [DOI] [PubMed] [Google Scholar]
- 19.Kim Y, et al. The effects of intra-articular resiniferatoxin on monosodium iodoacetate-induced osteoarthritic pain in rats. Korean J Physiol Pharmacol Official J Korean Physiol Soc Korean Soci Pharmacol. 2016;20:129. doi: 10.4196/kjpp.2016.20.1.129. [DOI] [PMC free article] [PubMed] [Google Scholar]
- 20.Chaplan SR, et al. Quantitative assessment of tactile allodynia in the rat paw. J Neurosci Methods. 1994;53:55–63. doi: 10.1016/0165-0270(94)90144-9. [DOI] [PubMed] [Google Scholar]
- 21.Dixon W. Staircase bioassay: the up-and-down method. Neurosci Biobehav Rev. 1991;15:47–50. doi: 10.1016/S0149-7634(05)80090-9. [DOI] [PubMed] [Google Scholar]
- 22.Ostergaard K, et al. Histologic/histochemical grading system for osteoarthritic articular cartilage. Reproducibility and validity. Arthritis Rheum. 1997;40:1766–1771. doi: 10.1002/art.1780401007. [DOI] [PubMed] [Google Scholar]
- 23.Pauli C, et al. Comparison of cartilage histopathology assessment systems on human knee joints at all stages of osteoarthritis development. Osteoarthritis Cartil. 2012;20:476–485. doi: 10.1016/j.joca.2011.12.018. [DOI] [PMC free article] [PubMed] [Google Scholar]
- 24.Cory E, et al. Compressive axial mechanical properties of rat bone as functions of bone volume fraction, apparent density and micro-ct based mineral density. J Biomech. 2010;43:953–960. doi: 10.1016/j.jbiomech.2009.10.047. [DOI] [PMC free article] [PubMed] [Google Scholar]
- 25.Luyten FP, et al. Contemporary concepts of inflammation, damage and repair in rheumatic diseases. Best Pract Res Clin Rheumatol. 2006;20:829–848. doi: 10.1016/j.berh.2006.06.009. [DOI] [PubMed] [Google Scholar]
- 26.Goldring MB, Goldring SR. Articular cartilage and subchondral bone in the pathogenesis of osteoarthritis. Ann N Y Acad Sci. 2010;1192:230–237. doi: 10.1111/j.1749-6632.2009.05240.x. [DOI] [PubMed] [Google Scholar]
- 27.Sellam J, Berenbaum F. The role of synovitis in pathophysiology and clinical symptoms of osteoarthritis. Nat Rev Rheumatol. 2010;6:625–635. doi: 10.1038/nrrheum.2010.159. [DOI] [PubMed] [Google Scholar]
- 28.Lyons TJ, et al. The normal human chondro-osseous junctional region: evidence for contact of uncalcified cartilage with subchondral bone and marrow spaces. BMC Musculoskelet Disord. 2006;7:1–8. doi: 10.1186/1471-2474-7-52. [DOI] [PMC free article] [PubMed] [Google Scholar]
- 29.Walsh DA, et al. Angiogenesis and nerve growth factor at the osteochondral junction in rheumatoid arthritis and osteoarthritis. Rheumatology. 2010;49:1852–1861. doi: 10.1093/rheumatology/keq188. [DOI] [PMC free article] [PubMed] [Google Scholar]
- 30.Thambyah A, Broom N. On new bone formation in the pre-osteoarthritic joint. Osteoarthritis Cartil. 2009;17:456–463. doi: 10.1016/j.joca.2008.09.005. [DOI] [PubMed] [Google Scholar]
- 31.Currey JD. Effects of differences in mineralization on the mechanical properties of bone. Philos Trans R Soc Lond B Biol Sci. 1984;304:509–18. [DOI] [PubMed]
- 32.Cho H-Y, et al. Kinesio taping improves pain, range of motion, and proprioception in older patients with knee osteoarthritis: a randomized controlled trial. Am J Phys Med Rehabil. 2015;94:192–200. doi: 10.1097/PHM.0000000000000148. [DOI] [PubMed] [Google Scholar]
- 33.Zhang J-M, An J. Cytokines, inflammation and pain. Int Anesthesiol Clin. 2007;45:27. doi: 10.1097/AIA.0b013e318034194e. [DOI] [PMC free article] [PubMed] [Google Scholar]
- 34.McCoy A. Animal models of osteoarthritis: comparisons and key considerations. Vet Pathol. 2015;52:803–818. doi: 10.1177/0300985815588611. [DOI] [PubMed] [Google Scholar]
- 35.Karsdal M, et al. Biochemical markers identify influences on bone and cartilage degradation in osteoarthritis-the effect of sex, Kellgren-Lawrence (KL) score, body mass index (BMI), oral salmon calcitonin (sCT) treatment and diurnal variation. BMC Musculoskelet Disord. 2010;11:1–13. doi: 10.1186/1471-2474-11-125. [DOI] [PMC free article] [PubMed] [Google Scholar]
- 36.Gerwin N, et al. The OARSI histopathology initiative–recommendations for histological assessments of osteoarthritis in the rat. Osteoarthritis Cartil. 2010;18:S24–S34. doi: 10.1016/j.joca.2010.05.030. [DOI] [PubMed] [Google Scholar]
- 37.Ferrándiz ML, et al. Influence of age on osteoarthritis progression after anterior cruciate ligament transection in rats. Exp Gerontol. 2014;55:44–48. doi: 10.1016/j.exger.2014.03.010. [DOI] [PubMed] [Google Scholar]
- 38.Poole R, et al. Recommendations for the use of preclinical models in the study and treatment of osteoarthritis. Osteoarthritis Cartil. 2010;18:S10–S16. doi: 10.1016/j.joca.2010.05.027. [DOI] [PubMed] [Google Scholar]
- 39.Little C, Zaki S. What constitutes an “animal model of osteoarthritis”–the need for consensus? Osteoarthritis Cartil. 2012;20:261–267. doi: 10.1016/j.joca.2012.01.017. [DOI] [PubMed] [Google Scholar]
- 40.Orita S, et al. Pain-related sensory innervation in monoiodoacetate-induced osteoarthritis in rat knees that gradually develops neuronal injury in addition to inflammatory pain. BMC Musculoskelet Disord. 2011;12:1–12. doi: 10.1186/1471-2474-12-134. [DOI] [PMC free article] [PubMed] [Google Scholar]
- 41.Kuyinu EL, et al. Animal models of osteoarthritis: classification, update, and measurement of outcomes. J Orthop Surg Res. 2016;11:1–27. doi: 10.1186/s13018-016-0346-5. [DOI] [PMC free article] [PubMed] [Google Scholar]
- 42.Schuelert N, McDougall JJ. Grading of monosodium iodoacetate-induced osteoarthritis reveals a concentration-dependent sensitization of nociceptors in the knee joint of the rat. Neurosci Lett. 2009;465:184–188. doi: 10.1016/j.neulet.2009.08.063. [DOI] [PubMed] [Google Scholar]
- 43.Udo M, et al. Monoiodoacetic acid induces arthritis and synovitis in rats in a dose-and time-dependent manner: proposed model-specific scoring systems. Osteoarthritis Cartil. 2016;24:1284–1291. doi: 10.1016/j.joca.2016.02.005. [DOI] [PubMed] [Google Scholar]
- 44.Bove S, et al. Weight bearing as a measure of disease progression and efficacy of anti-inflammatory compounds in a model of monosodium iodoacetate-induced osteoarthritis. Osteoarthritis Cartil. 2003;11:821–830. doi: 10.1016/S1063-4584(03)00163-8. [DOI] [PubMed] [Google Scholar]
- 45.Combe R, Bramwell S, Field MJ. The monosodium iodoacetate model of osteoarthritis: a model of chronic nociceptive pain in rats? Neurosci Lett. 2004;370:236–240. doi: 10.1016/j.neulet.2004.08.023. [DOI] [PubMed] [Google Scholar]
- 46.Guzman RE, et al. Mono-iodoacetate-induced histologic changes in subchondral bone and articular cartilage of rat femorotibial joints: an animal model of osteoarthritis. Toxicol Pathol. 2003;31:619–624. doi: 10.1080/01926230390241800. [DOI] [PubMed] [Google Scholar]