Abstract
Background
Ongoing symptoms or the development of new symptoms following a SARS-CoV-2 diagnosis has caused a complex clinical problem known as “long COVID” (LC). This has introduced further pressure on global healthcare systems as there appears to be a need for ongoing clinical management of these patients. LC personifies heterogeneous symptoms at varying frequencies. The most complex symptoms appear to be driven by the neurology and neuropsychiatry spheres.
Methods
A systematic protocol was developed, peer reviewed, and published in PROSPERO. The systematic review included publications from the 1st of December 2019–30th June 2021 published in English. Multiple electronic databases were used. The dataset has been analyzed using a random-effects model and a subgroup analysis based on geographical location. Prevalence and 95% confidence intervals (CIs) were established based on the data identified.
Results
Of the 302 studies, 49 met the inclusion criteria, although 36 studies were included in the meta-analysis. The 36 studies had a collective sample size of 11,598 LC patients. 18 of the 36 studies were designed as cohorts and the remainder were cross-sectional. Symptoms of mental health, gastrointestinal, cardiopulmonary, neurological, and pain were reported.
Conclusions
The quality that differentiates this meta-analysis is that they are cohort and cross-sectional studies with follow-up. It is evident that there is limited knowledge available of LC and current clinical management strategies may be suboptimal as a result. Clinical practice improvements will require more comprehensive clinical research, enabling effective evidence-based approaches to better support patients.
Keywords: Long COVID, Pain, Neuropsychiatry, Neurology, Autonomic dysfunction, Gastrointestinal
Introduction
Global experience with a rapidly evolving and advanced strain of the coronavirus have led to over a million deaths since January 2020. The first case of SARS-CoV-2 was reported in China around December 2019. Healthcare systems have been under immense pressure to support both SARS-CoV-2 patients and survivors who continue to demonstrate various symptomatologies which appear to impact the overall quality of life and wellbeing. A report from the Center for Disease Control and Prevention (CDC) in the USA reported that patients recovered from SARS-CoV-2 have continuous symptoms of shortness of breath, fatigue, brain fog, cough, chest pain, stomach pain and headache. Bin Cao and colleagues reported that these complications appear to last for at least 6 months thus far [1]. Similarly, Carfi and colleagues reported 87.4% of the survivors suffered from a variety of symptoms at post-60 days since the original SARS-CoV-2 diagnosis [2].
As SARS-CoV-2 survivors continue to share their experiences, clinical researchers hypothesize the continuation of complex symptomatologies for a longer period of time than initially anticipated [3]. As are a result, several independent authorities have developed long COVID guidelines, although the consensus continues to change with the changing evidence base from data gathered from patients. Therefore, a universally accepted Long COVID definition is yet to be elaborated, although a general overview is available. One such important guideline set is from the National Institute for Health and Care Excellence (NICE), which stipulates “Long COVID’ (LC) is commonly used to describe symptoms that continue or develop after acute SARS-CoV-2 diagnosis post-4 weeks” [4]. The current research landscape exploring LC is also limited due to the varying reports of symptoms identified in clinical datasets that demonstrates it to be a ‘moving target’ and it is challenging clinical researchers to guide clinicians on the most optimal steps to pursue when managing the clinical care of these patients. The World Health Organization’s (WHO) Novel Coronavirus Pneumonia Emergency Response Epidemiology Team describes LC as a complex course of illness. Therefore, pandemic policymaking itself requires evidence-based clinical research along with patient-reported outcomes and clinician experiences to be reported in an effective manner to channel a more holistic approach to optimise long-term clinical management. A key component appears to be the difference in LC symptoms between men and women, as reported by Mathew et al., who demonstrate that these observations are vital to understand, and that at present this is based particularly on clinician experience with limited pathophysiological and aetiology [5].
In this study, we conducted a meta-analysis of peer-reviewed and published data using a systematic approach to better understand LC from a neurological and neuropsychiatry perspective.
Methods
A systematic methodology was developed, peer reviewed, and published in PROSPERO (CRD42021235351). The primary aim of this systematic review was to determine the prevalence of LC symptomatologies pertaining to neuropsychiatry, neurology, and pain. The secondary aim was to determine any other infrequently reported symptoms that may influence neuropsychiatry and/or neurology and/or pain diagnosis following LC. The Preferred Reporting Items for Systematic Reviews and Meta-Analysis (PRISMA) was used to report this study.
The published PROSPERO protocol in its current state is reflective of a wide study for long COVID as such, our response to your query that this manuscript answers one of the 4 objectives listed in PROSPERO. Furthermore, at the time we conducted this review we did not have much other than symptomatologies and we therefore intend to extend this to a more robust output with our next manuscript which will be an extension of the original. The second manuscript will also cover the remainder of the aims listed in the PROSPERO protocol.
Search strategy
Multiple databases of Embase, Pubmed, Science Direct, and ProQuest were used with multiple MeSH terms such as nervous system diseases, autonomic central nervous system diseases, autonomic diseases, autonomic nervous system disorders, disorders of the autonomic nervous system, autonomic nervous system diseases, peripheral autonomic nervous system diseases, autonomic peripheral nervous system diseases, parasympathetic nervous system diseases, sympathetic nervous system diseases, headaches, migraine, headache after mental exertion, exertional headache, tension headache, cluster headache, intra cranial hypertension, temporal headache, retro-orbital headache, cervicogenic headache, chronic pain, fibromyalgia, back pain, erythromelalgia, endometriosis, intercostal neuralgia, leg pain, neuropathic pain, chronic pelvic pain, sciatica, muscle fatigue, metal fatigue, cognition, apathy, sleep arousal, sleep deprivation, sleep initiation and maintenance, anxiety, depression emotional lability.
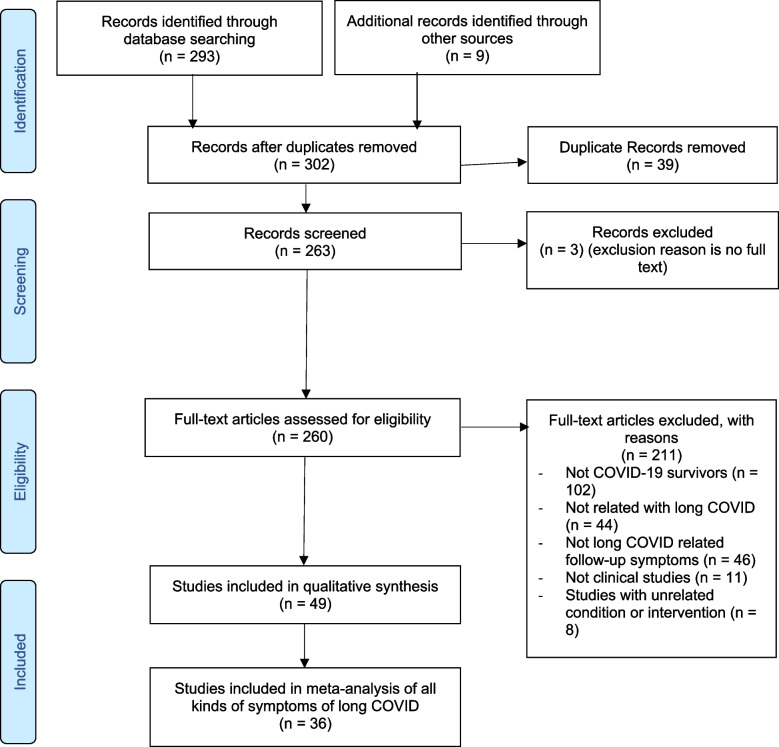
All studies and surveys were included in the Preliminary R1 round. The reviews and metanalysis identified were scrutinized for references that can be included in our meta-analysis. A final set was arrived at looking at the possible relevance of the studies comprising of 302 studies. This was analyzed as per PRISMA diagram in Fig. 1 in the “Results” section.
Fig. 1.
PRISMA flow diagram
Eligibility criteria
In this meta-analysis, we looked at persistent symptoms in COVID patients, including cohort and cross-sectional studies. All studies included were reported in English.
Data extraction and synthesis
Screening and data extraction were performed by four independent reviewers. Any disagreements were discussed and reached a consensus by two reviewers. To fully investigate the impact of LC on the physical health of survivors, we grouped all reported symptoms into five main categories: general symptoms (which includes pain and other infrequently reported symptoms), neurological, mental disorders, cardiopulmonary, and obstetric problems.
Data extractions were made via studies that included SARS-CoV-2 survivors that had either been hospitalized or treated as outpatients. Therefore, these patients had a confirmed positive test for SARS-CoV-2 in addition to relevant symptoms. All studies that did not report on follow-up data were excluded. For studies that reported on a control and patient group, only the patient data was extracted and used. A data extraction sheet specific to the clinical question of this study was developed. This Excel spreadsheet included study type, sample size, country, characteristics, information, outcomes, duration of symptoms, and prevalence.
Risk of bias assessment
A quality assessment was performed using the Newcastle–Ottawa Scale (NOS) (Table 1) to critically appraise the literature included within the systematic review using common variables. Methodological quality and risk of bias was assessed by independent reviewers according to the NOS, which has validity for use in cohort studies [7] and the adapted version [8] for cross-sectional studies. The scale consists of eight items with three quality parameters: (i) selection, (ii) comparability, and (iii) outcome. We scored the quality of the studies (poor, fair, and good) by allocating stars to each domain as stated below:
A poor quality score was allocated 0 or 1 star(s) in selection, 0 stars in comparability, and 0 or 1 star(s) in the outcomes domain
A fair quality score was awarded, 2 stars in selection, 1 or 2 stars in comparability, and 2 or 3 stars in outcomes.
A good quality score was awarded, 3 or 4 stars in selection, 1 or 2 in comparability, and 2 or 3 stars in outcomes [7].
Table 1.
Risk of bias quality assessment
| Selection (S) | Comparability (C) | Exposure/Outcome (E/O) | Sub Total assessment | Quality Assessment | ||||||||||
|---|---|---|---|---|---|---|---|---|---|---|---|---|---|---|
| 1 | 2 | 3 | 4 | 1a | 1b | 1 | 2 | 3 | S+ | C& | E/O& | Conclusion | NOS | |
| Akter et al | * | NO | * | * | * | * | * | * | * | Good | Good | Good | Good | 7 |
| Huang et al | * | NO | * | * | NO | * | * | * | * | Good | Good | Good | Good | 6 |
| Humphreys et al | * | NO | * | NO | * | NO | NO | * | * | Fair | Good | Good | Fair | 5 |
| Simani et al | * | NO | * | * | NO | * | * | * | * | Good | Good | Good | Good | 6 |
| Taylor et al | * | NO | * | * | NO | * | * | * | * | Fair | Good | Fair | Fair | 6 |
| Felipe et al | NO | NO | * | * | * | * | * | * | * | Fair | Good | Good | Good | 6 |
| Hopkins et al | * | NO | * | * | * | * | * | * | * | Good | Good | Good | Good | 7 |
| Petersen et al | * | NO | * | * | * | * | * | * | * | Good | Good | Good | Good | 7 |
| Iqbal et al | * | * | * | * | * | * | * | * | * | Good | Good | Good | Good | 8 |
| Poncet-Megemont et al | * | * | * | * | * | * | * | * | * | Good | Good | Good | Good | 8 |
| Trevisan et al | * | * | * | * | * | * | * | * | * | Good | Good | Good | Good | 7 |
| Klein et al | * | NO | * | NO | * | NO | * | NO | NO | Fair | Good | Poor | Poor | 4 |
| Munro et al | * | NO | NO | * | NO | NO | * | NO | NO | Fair | Poor | Fair | Poor | 4 |
| Chopra et al | * | NO | * | * | NO | NO | * | NO | NO | Good | Poor | Fair | Fair | 5 |
| Putri et al | * | NO | * | * | * | * | * | * | * | Good | Good | Good | Good | 7 |
| Liu et al | * | NO | * | * | * | * | * | NO | NO | Good | Good | Fair | Good | 6 |
| Tenforde et al | * | * | * | * | * | * | * | * | * | Good | Good | Good | Good | 8 |
| Sykes et al | * | NO | * | * | * | * | * | * | * | Good | Good | Good | Good | 6 |
| Townsend et al | * | NO | * | * | NO | * | * | * | * | Good | Fair | Good | Good | 7 |
| Writing Committee for the COMEBAC study group, 2021 [6] | * | NO | * | * | * | * | * | NO | NO | Good | Good | Fair | Fair | 5 |
| Augustin et al | * | NO | * | * | * | * | * | * | * | Good | Good | Good | Good | 6 |
| Duncan et al | * | NO | * | NO | * | * | * | NO | NO | Fair | Good | Fair | Fair | 4 |
| Osikomaiya et al | * | NO | * | * | * | * | * | * | * | Good | Good | Good | Good | 6 |
| Orrù et al | * | * | * | * | * | * | * | * | * | Good | Good | Good | Good | 7 |
| Pujari et al | * | NO | * | NO | * | * | * | * | * | Fair | Good | Good | Good | 6 |
| Frontera et al | * | * | * | * | * | * | * | * | * | Good | Good | Good | Good | 7 |
| Holmes et al | * | * | * | * | * | * | * | * | * | Good | Good | Good | Good | 7 |
| Townsend et al | * | NO | * | NO | * | * | * | NO | NO | Fair | Good | Fair | Fair | 4 |
| Estiri et al | * | NO | * | * | * | * | * | NO | NO | Good | Good | Fair | Fair | 5 |
| Chevinsky et al | * | NO | * | * | * | * | * | NO | * | Good | Good | Good | Good | 6 |
| Pereira et al | * | NO | * | * | * | * | * | NO | NO | Good | Good | Fair | Fair | 6 |
| Romero-Duarte et al | * | NO | * | * | * | NO | * | NO | NO | Good | Fair | Fair | Fair | 5 |
| Graham et al | * | NO | * | * | * | * | * | * | * | Good | Good | Good | Good | 7 |
| Trinkmann et al | * | * | * | * | * | * | * | * | * | Good | Good | Good | Good | 7 |
| Nguyen et al | * | NO | * | * | * | NO | * | NO | NO | Good | Fair | Fair | Fair | 5 |
| Vrillon et al | * | NO | * | * | * | * | * | * | * | Good | Good | Good | Good | 7 |
| Modi et al | * | NO | * | * | * | NO | * | NO | NO | Good | Fair | Fair | Fair | 4 |
| Pasquini et al | * | NO | * | * | * | * | * | NO | NO | Good | Good | Fair | Good | 5 |
| Boscolo-Rizzo et al | * | NO | NO | * | * | * | * | NO | NO | Fair | Good | Fair | Fair | 5 |
| Capelli et al | * | NO | * | * | NO | * | * | NO | NO | Good | Fair | Fair | Fair | 4 |
| Yvonne et al | * | * | * | * | * | * | * | * | * | Good | Good | Good | Good | 7 |
| Raman et al | * | * | * | * | * | * | * | * | * | Good | Good | Good | Good | 7 |
| Swapna Mandal et al | * | * | * | * | * | * | * | * | * | Good | Good | Good | Good | 6 |
| Woo et al | * | NO | * | * | * | * | * | * | * | Good | Good | Good | Good | 6 |
| Puntmann et al | * | NO | * | * | * | NO | * | * | * | Good | Fair | Good | Good | 5 |
| Bellan et al | * | * | * | * | * | * | * | * | * | Good | Good | Good | Good | 7 |
| Stavem et al | * | NO | * | * | * | * | * | * | * | Good | Good | Good | Good | 6 |
| Malek et al | * | NO | * | * | NO | * | * | NO | NO | Good | Fair | Fair | Fair | 5 |
| Printza et al | * | NO | * | NO | * | * | * | NO | NO | Fair | Good | Fair | Fair | 4 |
Data analysis
A random-effects model with an inverse variance method was used for the meta-analysis and the heterogeneity was assessed by I2. A subgroup analysis was conducted in terms of study geographical location on the symptoms that were reported in more than 10 studies. Sensitivity analysis was used to test the robustness of the results. Funnel plots and Egger’s tests for symptoms with more than 10 studies would be analyzed to detect publication bias. All data analysis will be carried out using R and STATA 15.
Results
Of the 302 studies identified, 49 met the inclusion criteria. 36 studies were included in the final meta-analysis. This was reported within the PRISMA document as demonstrated in Fig. 1.
The 36 studies included comprised of a total sample size of 11,598 people. Of the 36, 50% were cohort studies and the remainder cross-sectional. The longest follow-up time among the 36 studies was 8 months, although the most common follow-up time was 4 months. The 36 studies covered multiple geographical locations, where 19 countries reported five primary classifications of symptomatologies of general clinical, neurological, neuropsychiatry, and cardiopulmonary. Primary clinical features within these categories included fatigue, cognitive impairment, joint pain, anxiety, and depression. These appear to align with the present understanding of LC symptomatologies. Study-based characteristics and outcomes are demonstrated in Table 2.
Table 2.
Characteristics of studies included in meta-analysis
| First author | Publication year | Study type | Sample size | Country | Percent of women | Ethnicity | Follow-up time, months | p value |
|---|---|---|---|---|---|---|---|---|
| Akter | 2020 | Cross-sectional study | 734 | Bangladesh | 24% | / | 1 | / |
| Huang | 2021 | Cohort study | 1733 | China | 48% | / | 5 | / |
| Humphreys | 2021 | Qualitative study | 18 | UK | 50% |
55.6% White 16.7% White other 16.7% Asian 5.6% Black 5.6% Mixed |
1 | / |
| Simani | 2021 | Cross-sectional study | 120 | Iran | 33.3% | / | 6 | / |
| Taylor | 2021 | Qualitative study | 13 | UK | 84.6% | 84.6% White British | / | / |
| Felipe | 2020 | Cross-sectional study | 46 | Brazil | 54.3% | / | 4 | / |
| Hopkins | 2020 | Cohort study | 382 | UK | 74.6% | / | 1 | Loss of smell p < 0.001 |
| Petersen | 2020 | Cohort study | 180 | Faroe Islands | 54.4% | / | 4 | / |
| Iqbal | 2021 | Cross-sectional study | 158 | Pakistan | 55.1% | / | 1 | / |
| Poncet-Megemont | 2020 | Cohort study | 139 | France | 62.6% | / | 1 | / |
| Trevisan | 2021 | Observational study | 1618 | Italy, Spain, and Norway | 55% | / | 6 | / |
| Klein | 2021 | Cohort study | 103 | Israel | 37.9% | / | 6 | / |
| Munro | 2020 | Cross-sectional study | 138 | UK | 12.5% | / | / | / |
| Chopra | 2020 | Cohort study | 488 | USA | / |
51.6% Black 37.3% White 11.1%other/unknown 0r 4.4% Hispanic 86.7% Non-Hispanic 9.3% Unknown |
2 | / |
| Putri | 2021 | Survey | 109 | Taiwan | 44.95% | 100% Asian | 0.25 | / |
| Liu | 2020 | Cross-sectional study | 675 | China | 53% | / | 1 | / |
| Tenforde | 2020 | Cross-sectional study | 292 | USA | 52% |
34.8% White, non-Hispanic 17% Black, non-Hispanic 36.3% Hispanic 11.9% other |
0.5 | p = 0.01 |
| Sykes | 2021 | Cross-sectional study | 134 | UK | 34.3% |
91% White 1.5% Black 6% Asian 1.5% Mixed/other |
4 | / |
| Townsend | 2021 | Cohort study | 40 | Ireland | 90% | / | 5 | / |
| Writing Committee for the COMEBAC Study Group, 2021 [6] | 2021 | Cohort study | 478 | France | 42.1% | / | 4 | / |
| Augustin | 2021 | Cohort study | 353 | Germany | 53.5% | / | 7 | / |
| Duncan | 2021 | Survey | NA | Scotland | / | / | / | / |
| Osikomaiya | 2021 | Cohort study | 274 | Nigeria | 33.9% | / | 0.5 | / |
| Orrù | 2021 | Cross-sectional study | 152 | Italy | / | / | 3 + |
Insomnia p < 0.05 quality of life p < 0.05 |
| Pujari | 2021 | Cross-sectional study | 94 | India | 26.6% | / | 0.5 | / |
| Frontera | 2021 | Prospective study | 382 | USA | 35% |
Hispanic 15%/22% Non-Hispanic 62%/59% Prefer not to answer 23%/19% |
6 | / |
| Holmes | 2021 | Cohort study | 27 | Australia | / | / | 6 | / |
| Townsend | 2020 | Longitudinal study | 111 | Ireland | 63% | / | 3 | / |
| Estiri | 2021 | Cohort study | 57,622 | USA | / | / | 3–6, 6–9 | / |
| Chevinsky | 2021 | Cohort study | 148,892 | USA | 57% |
40.9% White 25.2% Black 2.4% Asian 21% Hispanic 10.6% Others |
1–4 | / |
| Pereira | 2021 | Cohort study | 38 | UK | 84% | BAME group 37% | 7 | / |
| Romero-Duarte Á | 2021 | Cross-sectional study | 797 | Spain | 46.3% | / | 6 | / |
| Graham | 2021 | Cohort study | 50 | USA | 66% |
88% White, 4% Black or African American, 4% Asian, 0% American Indian or Alaskan Native, 4% Other Or Hispanic or Latino 12% Not Hispanic or Latino 88% |
4 | / |
| Trinkmann | 2021 | Cross-sectional study | 246 | Germany | 56.1% | / | 2 | p < 0.01 |
| Nguyen | 2021 | Cohort study | 125 | France | 55.2% | / | 7 | / |
| Vrillon | 2021 | Cohort study | 125 | France | 58.4% | / | 0.7 | / |
| Modi | 2021 | Qualitative study | 131 | USA | 47% |
71% White(non-Hispanic) 7% White (Hispanic) 8% Black 2% Asian 1% American Indian 8% Multiracial 4% other (Hispanic) |
6 | / |
| Pasquini | 2021 | Cross-sectional study | 26 | Italy | 65.4% | / | 4 | / |
| Boscolo-Rizzo | 2021 | Cohort study | 183 | Italy | 54.6% | / | 6 | / |
| Capelli | 2021 | Cohort study | 55 | Italy | 64% | / | 8 | / |
| Yvonne | 2020 | Cross-sectional study | 2113 | Netherlands and Belgium | 85% | / | 2 | p < 0.001 |
| Raman | 2021 | Cohort study | 58 | UK | 41.4% | BAME group 22.4% | 2 | p < 0.0001 to 0.044 |
| Swapna Mandal | 2020 | Cross-sectional study | 384 | UK | 38% |
38.8% British Caucasian 17.1% Other Caucasian 6.5% British Asian 10.3% Other Asian 6.8% Black British 7.6% Other black 13.9% Other ethnicity |
2 | p < 0.0001 for all symptoms |
| Marcel S. Woo | 2020 | Cross-sectional study | 18 | Germany | 57.9% | / | 3 | / |
| Puntmann | 2020 | Cohort study | 100 | France | 47% | / | 2.5 | / |
| Bellan | 2021 | Cohort study | 238 | Italy | 59.7% | / | 4 | / |
| Stavem | 2020 | Cross-sectional study | 451 | Norway | 56% | / | 3 | p < 0.001 |
| Małek | 2021 | Cohort study | 26 | Poland | 81% | / | 1.5 | / |
| Printza | 2020 | Cross-sectional study | 90 | Greece | 41.1% | / | 1 | / |
P value (*) P value < 0.05 represents a significant improvement in symptoms at follow-up time compared to onset
Meta-analysis
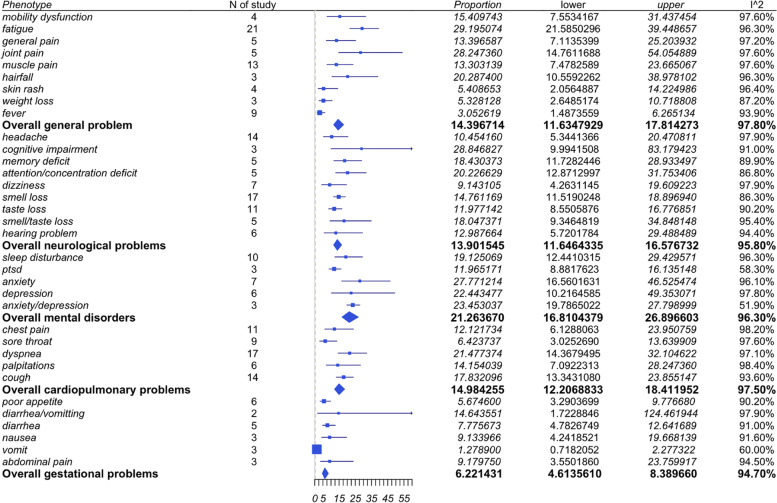
The meta-analysis included 36 studies, which are summarized in Fig. 2.
Fig. 2.
Summary of studies included in meta-analysis
Categorization
General symptoms
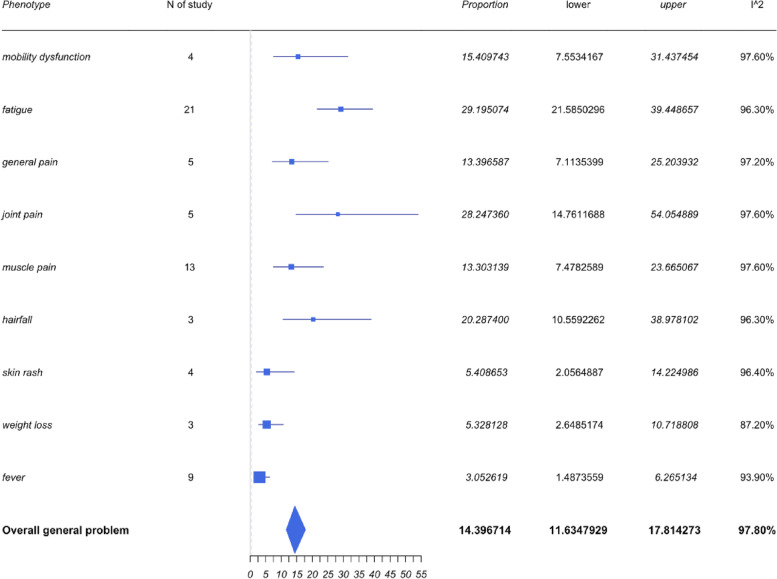
General symptoms included those associated with pain (such as general pain, muscle or joint pain, and mobility dysfunction), fatigue, fever, hair fall, skin rash, and weight loss. The pooled prevalence of the general problem was 14.4% with a 95%CI of 11.63% to 17.81%. A forest plot for general symptoms is shown in Fig. 3.
Fig. 3.
Forest plots for general symptoms
Fatigue was the most frequently reported symptom within the general problem category. Twenty-one of the 36 studies reported fatigue symptoms and the pooled prevalence of fatigue was 29.2% with a 95%CI of 21.59% to 39.45%. Muscle pain was the second most prevalent symptom reported among the 13 studies, which led to a pooled prevalence of 13.30% with a 95%CI of 7.48% to 23.67%. However, the prevalence rate of muscle pain is not as high as some of the other symptoms associated within the generalized category.
The pooled prevalence of joint pain and hair fall were 28.25% (95%CI 14.76% to 54.05%) and 20.29% (95%CI 10.56% to 38.98%) respectively. It appears that the prevalence of these two symptoms were high, but only a few studies mentioned these in comparison to those reporting fatigue and muscle pain. Therefore, it is worth standardizing these variables across all studies to manage a better understanding of the clinical relevance.
Neurological symptoms
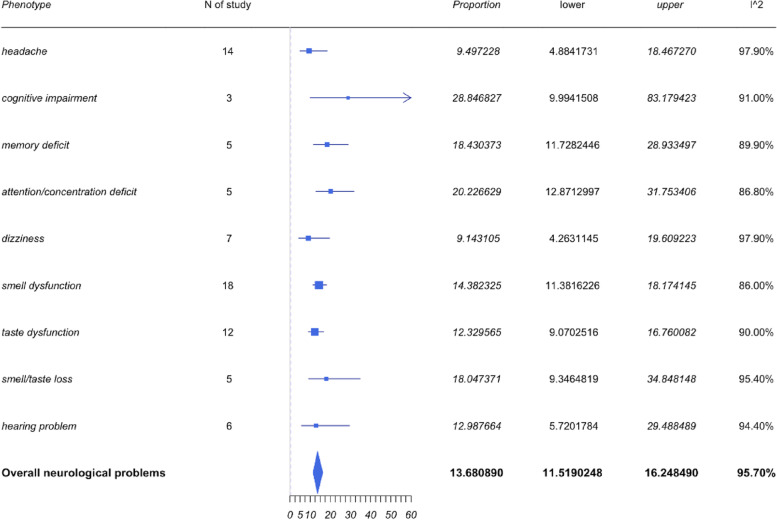
The neurological symptoms included headache, cognitive impairment, and loss of smell, taste, and hearing. As shown in Fig. 4, the most frequently reported neurological problems were loss of smell and taste, and headache. The pooled prevalence for loss of smell or taste and both taste and smell as well as headaches were 14.76%, 11.98%, 18.05%, and 10.45% respectively. However, the most prevalent neurological symptom reported appears to be cognitive impairment with a pooled prevalence of 28.85% with a 95%CI of 9.99% to 83.18%. The 95% CI is wide, and the identified heterogeneity based on I2 was 91%. Despite the high heterogeneity, only 3 studies mentioned the symptoms of cognitive impairment. Further studies and improved sampling would be required to demonstrate a more precise statistical conclusion in regard to cognitive impairment and LC.
Fig. 4.
Forest plots for neurological symptoms
Mental health symptoms
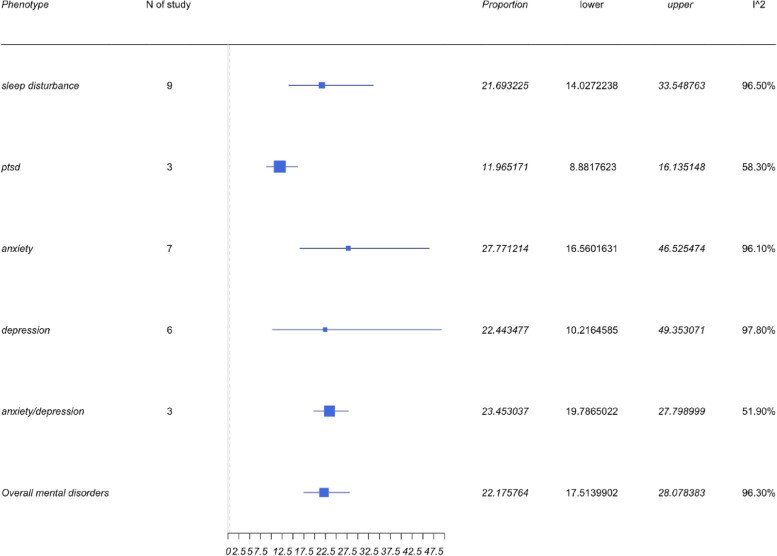
Four symptoms, and mental health (MH) symptoms including depression, anxiety, PTSD, and sleep disturbances, were reported within the neuropsychiatry category. The pooled results can be found in Fig. 5. The collective prevalence of MH symptoms was 21.26% (95%CI 16.81 to 26.9%), while each symptom independently also demonstrated a high prevalence. Anxiety prevalence was identified to be 27.77% with a 95%CI of 16.56 to 46.53%, while the prevalence of depression was 22.44% (95%CI 10.22 to 49.35%). The pooled prevalence of studies reporting patients with both anxiety and depression was 23.45% (95%CI 19.79 to 27.8%). The prevalence of sleep disturbance was identified to be 19.13% with a 95%CI of 12.44 to 29.43%. This is an important facet to demonstrate given that there is a large number of studies demonstrating depression and anxiety to be the most commonly reported MH outcomes among SARS-CoV-2 patients.
Fig. 5.
Forest plots for mental health symptoms
Cardiopulmonary symptoms
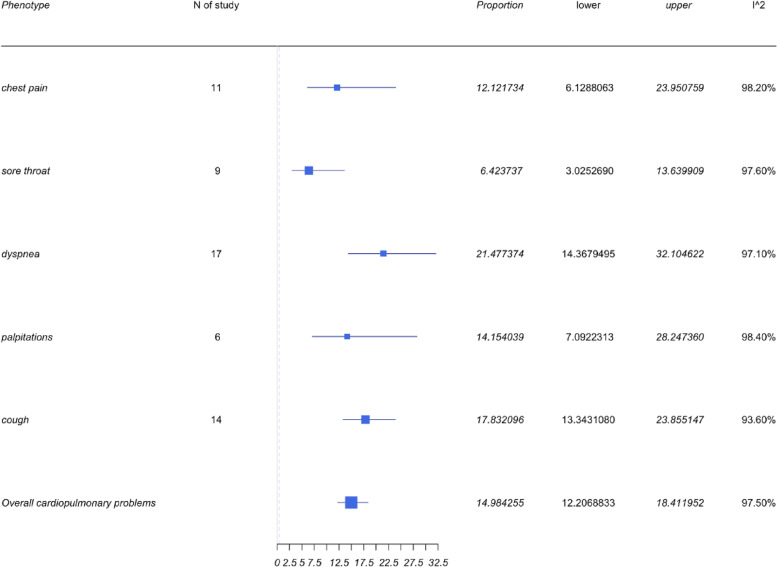
LC patients demonstrated cardiopulmonary symptoms with 5 commonly reported issues of chest pain, sore throat, dyspnea, palpitations, and cough. As can be seen from Fig. 6, dyspnea appeared to have the highest prevalence with 17 of 36 studies reporting it as a primary end point. The pooled prevalence was therefore 21.48% with a 95%CI of 14.37 to 21.2%. Cough was the second most commonly reported symptom across 14 of 36 studies. The pooled prevalence was 17.83% with a 95%CI of 13.34 to 23.86%.
Fig. 6.
Forest plots for cardiopulmonary symptoms
Gastrointestinal symptoms
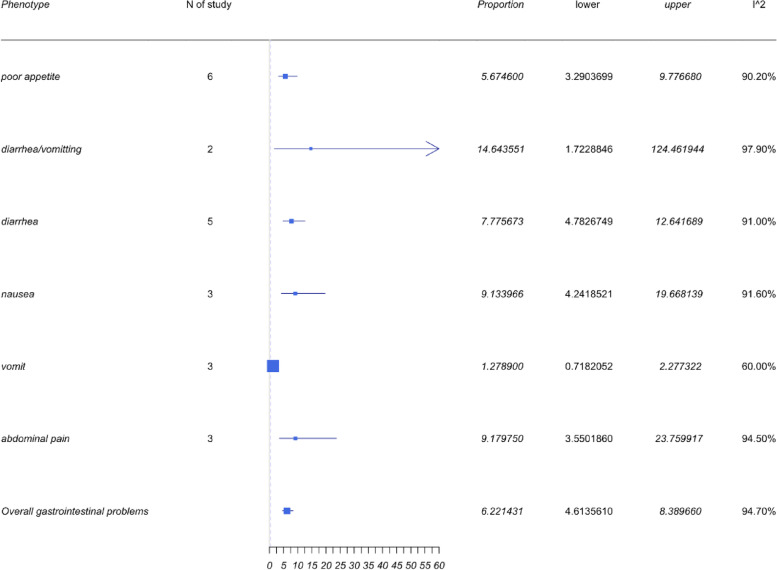
The overall prevalence of gastrointestinal problems, as shown in Fig. 7, was 6.22% with a 95%CI of 4.61 to 8.39% and is comparatively minimal to the other categorical symptoms identified. Commonly reported symptoms reported in this category were poor appetite, diarrhea and emesis, diarrhea or emesis, nausea, and abdominal pain. Diarrhea and emesis had the highest prevalence of 14.64% with a 95%CI of 1.72 to 124.46%. Studies about diarrhea/emesis were too small. Only two studies mentioned diarrhea and emesis, which also indicated a high heterogeneity with an I2 = 97.9%.
Fig. 7.
Forest plots for gastrointestinal symptoms
Subgroup analysis
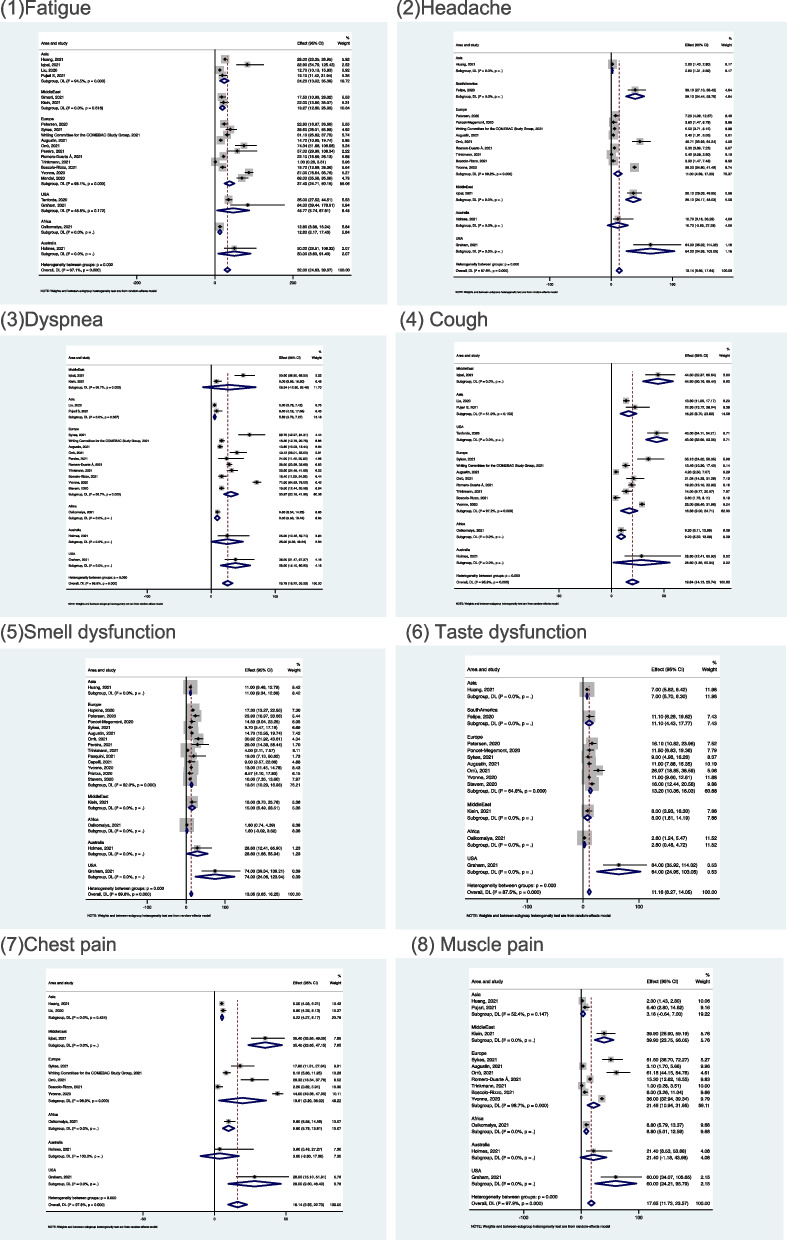
A subgroup analysis was conducted based on geographical regions correlated with the 8 symptoms of fatigue, headache, cough, loss of smell and taste, dyspnoea, chest, and muscle pain (see Fig. 8).
Fig. 8.
Forest plots of subgroup analysis
High prevalence of each symptom was reported by the studies from North America (mainly USA), followed by the Middle East and Australia. Most of the symptoms had a lower prevalence in Africa and Asia. Due to the small number of studies in the subgroup, the conclusions may have bias; for this reason, data from one subgroup was of concern to us. Ten studies from Europe reported dyspnoea in this subgroup and the pooled prevalence of this subgroup was 30.87% with 95%CI of 20.18 to 41.55%, which was the second highest prevalence among different regions. This suggested that dyspnoea was a highly prevalent symptom in European countries and should be addressed by the healthcare system to improve post-discharge care.
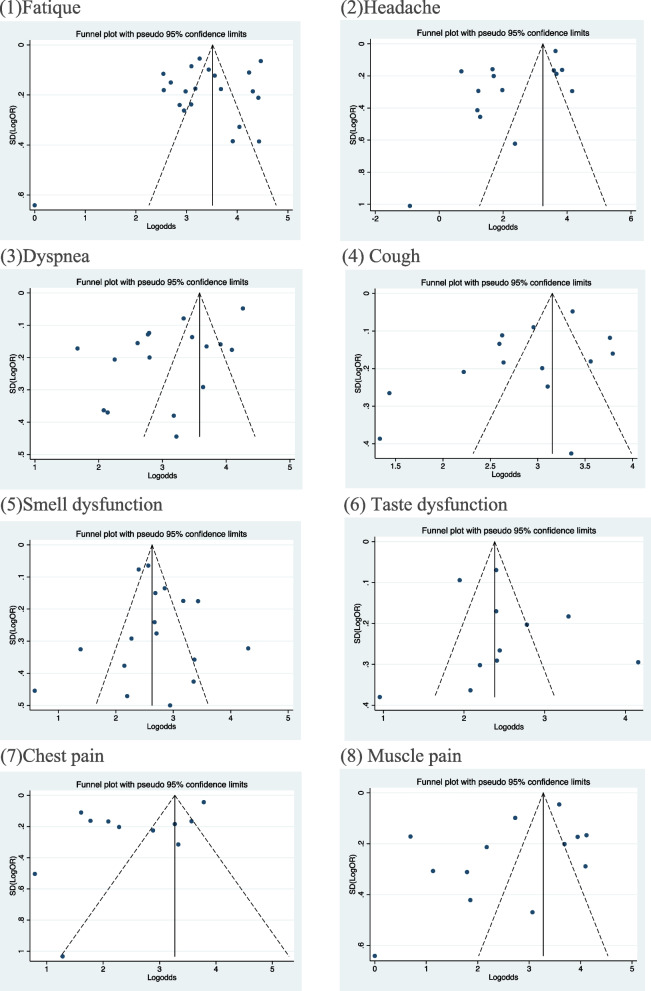
Funnel plots of the eight symptoms identified were reported in Fig. 9. It is apparent, based on the funnel plots, there is the presence of high heterogeneity. Many studies were outside the scope of 95% CI, so it was difficult to intuitively detect the bias. Therefore, Egger’s test was used to determine publication bias.
Fig. 9.
Funnel plots of eight symptoms (reported in more than 10 studies)
Sensitivity analysis
Many studies were outside the 95% confidence interval as demonstrated within the funnel plots, which could impact the overall conclusions of this study. Therefore, a sensitivity analysis was conducted to determine the consensus of the overall conclusion of the study. A Copas selection model was used [9, 10] to adjust the pooled prevalence, as demonstrated in Table 3.
Table 3.
Summarized results of sensitivity analysis
| Phenotype | N of study | Model | Probability of publishing study with largest standard error | Proportion(%) | Lower(%) | Upper(%) | p value for differences between two conclusions |
|---|---|---|---|---|---|---|---|
| Headache | 14 | Copas selection model | 49.55% | 13.4637 | 10.0332 | 18.0672 | 0.1135 |
| Random effects model | 9.4972 | 4.8842 | 18.4673 | ||||
| Smell dysfunction | 18 | Copas selection model | 100.00% | 14.1682 | 10.1188 | 19.8380 | 0.5006 |
| Random effects model | 14.3823 | 11.3816 | 18.1741 | ||||
| Taste dysfunction | 12 | Copas selection model | 100.00% | 12.2338 | 8.2962 | 18.0402 | 0.5495 |
| Random effects model | 12.3296 | 9.0703 | 16.7601 | ||||
| Chest pain | 11 | Copas selection model | 100.00% | 12.4236 | 7.2232 | 21.3681 | 0.103 |
| Random effects model | 12.1217 | 6.1288 | 23.9508 | ||||
| Dyspnea | 17 | Copas selection model | 100.00% | 21.5591 | 15.1515 | 30.6797 | 0.1819 |
| Random effects model | 21.4774 | 14.368 | 32.1046 | ||||
| Cough | 14 | Copas selection model | 91.11% | 18.176 | 12.8109 | 25.7852 | 0.1238 |
| Random effects model | 17.8321 | 13.3431 | 23.8551 | ||||
| Fatigue | 21 | Copas selection model | 92.46% | 29.1951 | 21.5850 | 39.4487 | 0.1478 |
| Random effects model | 28.9161 | 20.3158 | 41.1531 | ||||
| Muscle pain | 13 | Copas selection model | 67.65% | 15.6426 | 9.1963 | 26.6103 | 0.1038 |
| Random effects model | 13.3031 | 7.4783 | 23.6651 |
In Table 3, the proportion of selected studies varied, and the changes in the P value of the residual selection bias are depicted in Fig. 10 (1–8). The Copas model (CSM) was used to determine bias within studies based on P values exceeding 0.1. The proportion of studies used within the CSM are listed within Table 3. It is evident the CSM selected 49.55% studies with headache as a symptom, while the remaining 50.45% indicated a significant standard error, demonstrating poor quality and high heterogeneity, thus were excluded.
Fig. 10.
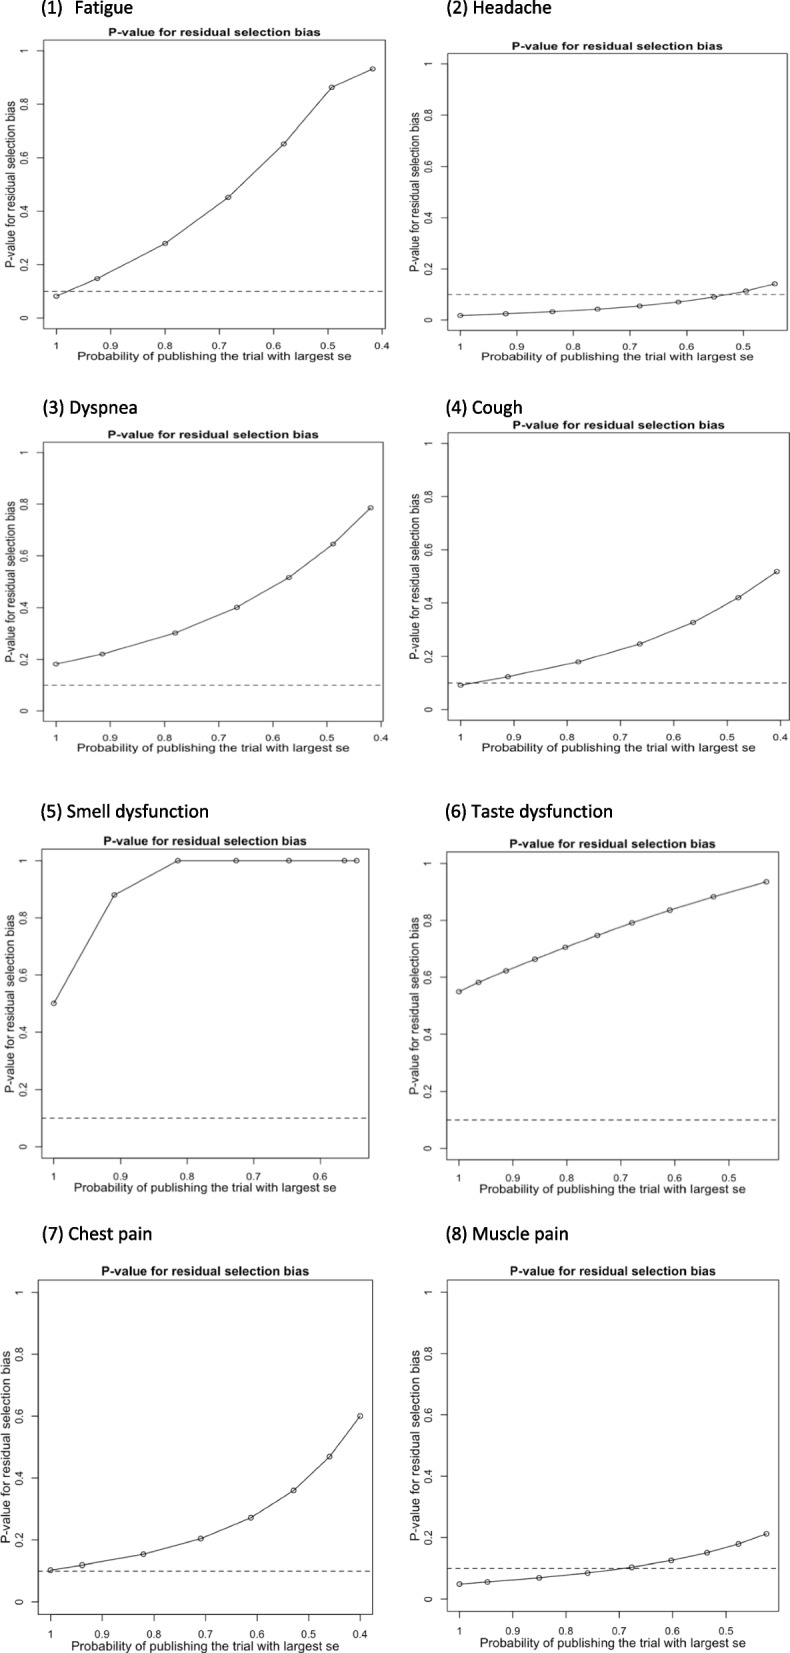
P values for residual selection bias
The result from the CSM was compared to a random effects model (REM), indicating P values exceeding 0.05, which demonstrates a lack of statistical significance. Therefore, the results of this study are consistent and provide robust conclusions.
Publication bias
Egger’s test was used to determine publication bias. The P values were calculated based on Egger’s test.
As shown in Table 4, studies reporting symptoms of headache and dyspnea have significant bias, with P values of 0.022 and 0.007 respectively. Therefore, the pooled prevalence of headache and dyspnea were 9.5% and 21.48%. In Fig. 9(2) and (3), the prevalence of headache and dyspnea may have been underestimated, and more studies should be found to further confirm the conclusions.
Table 4.
Summarized P values of Egger’s tests for symptoms with more than 10 studies
| Phenotype | Number of studies | P value of Egger’s test |
|---|---|---|
| General problems | ||
| Fatigue | 21 | 0.14 |
| Muscle pain | 13 | 0.093 |
| Neurological problems | ||
| Smell loss | 18 | 0.616 |
| Taste loss | 12 | 0.517 |
| Headache | 14 | 0.022* |
| Cardiopulmonary problems | ||
| Chest pain | 11 | 0.048 |
| Dyspnea | 17 | 0.007* |
| Cough | 14 | 0.085 |
*p < 0.05 indicates significance
Limitations
There are strengths and weaknesses to our study given that comparing patients with maximum symptoms risks bias reporting. Studies that reported on neuropsychiatry symptoms of depression and anxiety, for example, did not demonstrate a clinical diagnosis. The identified and reported features cannot be deemed to be LC as these patients could have underlying conditions that may not have been reported. Patients who may have had critical respiratory illness, for example, may have been part of these studies, but this data was not captured within the original peer-reviewed publications. This would influence the analysis conducted within our study; therefore, an underrepresentation and/or overrepresentation of some of these symptoms is a point to consider.
Discussion
This meta-analysis demonstrates the most recent studies identified with possible long COVID symptoms. The pooled data indicate both self-reported and clinically reported symptoms. This initial step is vital to design and develop comprehensive research in the future, especially since SARS-CoV-2 appears to be reporting a varying degree of symptoms.
The evidence identified demonstrates that long COVID appears to have multiple symptoms, without clear aetiology similar to fibromyalgia and chronic fatigue syndrome. The aforementioned conditions also have an association with postviral illness which appear to last longer than previously anticipated. As a result, healthcare systems endeavour challenges with draining resources and souring costs in addition to wellbeing concerns for staff. Another direct result of long COVID disease will be the added burden on waiting times for patients requiring other clinical care and elective procedures created by the pandemic.
The population prevalence of long COVID identified here could be used to determine symptom-based models to evaluate the requirement for healthcare system resources, and possible disease sequalae which may require care. Presently, instituting effective therapies is based upon present clinical knowledge than evidence-based practices. Repurposing drugs is another common theme among clinicians, and these raise concerns around long COVID potentially becoming a chronic condition in the near future, especially for patients who had significant issues with COVID. With a growing number of variants of SARS-Cov-2 virus, this further exacerbates the present unknowns of managing these patients in an optimal manner. However, this meta-analysis does provide an opportunity to plan early intervention strategies and target therapies in the future.
As it is an evolving pathology, further studies are being reported and published swiftly, which has its own challenges. Therefore, to consistently report the latest evidence, there is a requirement for a living systematic review and meta-analysis as well as better methodologies should be developed. It is interesting to note that developed countries appear to have a higher incidence of long COVID based on the geographical data identified within this study. There is a possibility of over- and under reporting, as well as validation of self-reported data. The lack of accurate validated measurements for reported long COVID symptoms similar to other fundamental clinical measures such as blood pressure and temperature causes further problems.
In addition to these factors, ethical and moral implications to patients, the public, and healthcare professionals continue to augment debates as the pandemic has forced all stakeholders to rethink access to healthcare and treatment.
It is evident from this study that there are post-COVID symptoms that patients continue to report. It might be beneficial to reduce the severity of the disease. A useful method to reduce these of course would be to increase the vaccination program outputs globally. With mass migration also attributed to the spread of COVID-19, an important facet to consider would be to understand the barriers and potential issues around vaccine acceptability, especially for those returning to work or their education in countries of residence.
The COVAX Facility is an international collaborative effort shared between the Coalition for Epidemic Preparedness Innovations (CEPI), the Global Alliance for Vaccines and immunizations (GAVI), the World Health Organization, supporting governments and international organizations [11]. The COVAX Facility is meant to facilitate the development and production of diagnostics, therapeutics, and vaccines to combat the COVID-19 pandemic and to make them accessible to LMIC governments [12, 13]. The COVAX Facility does not have a legal entity, therefore cannot enter into binding agreements, and relies upon agreements between its constituent partners (e.g., GAVI, WHO) procuring government, and the vaccine manufacturers [14]. Therefore, the law of contract governs access to vaccines, data related to vaccine procurement and distribution, and related matters.
Similarly, sharing of data to better assess the mental and physical health sequalae has been hampered by the lack of an international coordinating mechanism to do so or a uniform set of guidelines that governments, public health officials, private companies, and others may use to share such data [15]. As a result, COVID data related to incidence, disease burden, and long COVID as well as a potential disease sequalae may not be fully understood by the global healthcare community. This is a particular a problem for assessing both COVID and long COVID syndrome impact on differing ethnicities, age groups, and overall health status. Even within academic and clinical research, only open access publications provide insight into evidence.
The justification of resources being reallocated to non-life-threatening sequelae of long COVID could be a contentious topic. This further raises legal implications for policymakers.
The research on nociplastic and immunological explanations for pain symptoms could throw more light in future on the development of pain with long COVID. Genetic studies may also throw some light into the development of long-standing chronic pain or even long COVID, although this requires bio-sampling at a high frequency. The role of nutritional status and activity levels also needs to be established and its association with long COVID needs further study.
Conclusions
A key finding of this study is that the speed at which SARS-CoV-2 research is being conducted has meant epistemic authority consolidates around particular clinical areas. Therefore, it is vital to synthesise the evidence without any background noise. However, as demonstrated in this study, the gathering of LC data has been limited. The identified data could be associated with autonomic dysfunction, although to confirm this, further investigations would be required. Mapping LC outcomes would be a long-term commitment; therefore, future systematic reviews and meta-analysis should be reported in a living format, combining both clinical and research data to allow a more comprehensive synthesis of evidence with a view to using surveillance data.
Acknowledgements
The authors acknowledge initial contributions made by Dr. M Sam Chong, Dr Robert Shane Delamont and Dr. Mayur Bodani. We would like to acknowledge Professor Balakrishna Shetty for providing us his thoughts on COVID and long COVID as a practicing physician managing the ongoing care of patients.
This paper is part of the multifaceted EPIC project, sponsored by Southern Health NHS Foundation Trust and in collaboration with the University of Oxford, University College London, University College London NHS Foundation Trust and Southern University of Science and Technology (China).
Abbreviations
- CI
Confidence interval
- CSM
Copas selection model
- GAVI
Global Alliance for Vaccines and Immunizations
- LC
Long COVID
- MH
Mental health
- NOS
Newcastle-Ottawa Scale
- PRISMA
Preferred Reporting Items for Systematic Reviews and Meta-Analysis
- REM
Random effects model
- WHO
World Health Organization
Authors’ contributions
PP and GD developed study design and GD wrote the first draft of the manuscript. AN conducted database searches and study selection and data extraction. YZ, JQS, and GD performed statistical analyses and contributed to the “Results” section. AN, AS, GD, YE, YZ, DK, VR, SR, SH, KE, JQS, and PP critically reviewed and revised the manuscript. All authors read and approved the final version of the manuscript.
Funding
KE and GD are supported by National Institute for Health Research (NIHR) Research Capability Funding (RCF) and by Southern Health NHS Foundation Trust. All study sponsors had no further role in the study design, data collection, analysis, and interpretation of data; in the writing of the report and in the decision to submit the paper for publication.
Availability of data and materials
All data used within this study have been publicly available. The authors will consider sharing the dataset gathered upon request.
Declarations
Ethics approval and consent to participate
Not applicable
Consent for publication
Not applicable
Competing interests
PP has received a research grant from Novo Nordisk, and the other, educational from Queen Mary University of London, from John Wiley & Sons, and other from Otsuka, outside the submitted work. SR reports research funding associated with other studies from Janssen, Otsuka, and Lundbeck. AS reports funding associated with other projects from Medtronic. GD reports research funding associated with NIHR RCF. VR reports funding associated with other studies from the Medical Research Council. This research is based on evidence gathered systematically and has not been influenced unduly by expertise. All other authors declare that they have no competing interests.
The views expressed are those of the authors and not necessarily those of the NHS, the National Institute for Health Research, Department of Health and Social Care or Academic institutions.
Footnotes
Publisher's Note
Springer Nature remains neutral with regard to jurisdictional claims in published maps and institutional affiliations.
Arun Natarajan, Ashish Shetty, and Gayathri Delanerolle are co-first authors.
Yutian Zeng and Yingzhe Zhang are co-second authors.
Sam Halabi, Kathryn Elliot, and Jian Qing Shi are co-third authors.
References
- 1.Centers for Disease Control and Prevention . Post-COVID Conditions. 2021. [Google Scholar]
- 2.Lancet T. Facing up to long COVID. Lancet. 2020;396:1861. doi: 10.1016/S0140-6736(20)32662-3. [DOI] [PMC free article] [PubMed] [Google Scholar]
- 3.Carfì A, Bernabei R, Landi F, for the Gemelli Against COVID-19 Post-Acute Care Study Group Persistent symptoms in patients after acute COVID-19. JAMA. 2020;324:603–605. doi: 10.1001/jama.2020.12603. [DOI] [PMC free article] [PubMed] [Google Scholar]
- 4.National Institute for Health and Care Excellence (NICE) OVID-19 rapid guideline: managing the long-term effects of COVID-19. 2020. [PubMed] [Google Scholar]
- 5.Darley DR, Dore GJ, Byrne AL, et al. Limited recovery from post-acute sequelae of SARS-CoV-2 at 8 months in a prospective cohort. ERJ Open Res. 2021;7:00384–2021. doi: 10.1183/23120541.00384-2021. [DOI] [PMC free article] [PubMed] [Google Scholar]
- 6.Writing Committee for the COMEBAC Study Group; Morin L, Savale L, Pham T, Colle R, Figueiredo S, Harrois A, et al. Four-Month Clinical Status of a Cohort of Patients After Hospitalization for COVID-19. JAMA. 2021;325(15):1525–34. 10.1001/jama.2021.3331. Erratum in: JAMA. 2021;326(18):1874. [DOI] [PMC free article] [PubMed]
- 7.Wells G, Shea B, O’Connel D, Peterson J, Welch V, Loso M, Tugwell P. The Newcastle-Ottawa Scale (Nos) for assessing the quality of nonrandomised studies in meta-analyses. Ottawa: Ottawa Hospital Research Institute; 2000. [Google Scholar]
- 8.Modesti PA, Reboldi G, Cappuccio FP, Agyemang C, Remuzzi G, Rapi S, Perruolo E, Parati G, ESH Working Group on CV Risk in Low Resource Settings Panethnic differences in bloody pressure in europe: a systematic review and meta-analysis. PLoS One. 2016;11:e0147601. doi: 10.1371/journal.pone.0147601. [DOI] [PMC free article] [PubMed] [Google Scholar]
- 9.Copas J, Shi JQ. Meta-analysis, funnel plots and sensitivity analysis. Biostat. 2000;1:247–262. doi: 10.1093/biostatistics/1.3.247. [DOI] [PubMed] [Google Scholar]
- 10.Copas JB, Shi JQ. A sensitivity analysis for publication bias in systematic reviews. Stat Methods Med Res. 2001;10:251–265. doi: 10.1177/096228020101000402. [DOI] [PubMed] [Google Scholar]
- 11.Berkley S. COVAX explained. 2020. [Google Scholar]
- 12.Lurie N, Gilbert N, Hamburg M, Hoyt K, Morrison JS. The Scramble for Vaccines and the COVAX Facility. [Online event] Center for Strategic and International Studies. 2020. [Google Scholar]
- 13.Gavi. Donor profiles. 2020. Donor profiles (gavi.org).
- 14.Halabi S. Solving the pandemic vaccine product liability problem. Irvine: UC Irvine Law Rev; 2021.
- 15.Fegan G, Cheah PY, Data sharing working group Solutions to COVID-19 data sharing. Lancet Digital Health. 2021;3:e6. doi: 10.1016/S2589-7500(20)30273-9. [DOI] [PMC free article] [PubMed] [Google Scholar]
Associated Data
This section collects any data citations, data availability statements, or supplementary materials included in this article.
Data Availability Statement
All data used within this study have been publicly available. The authors will consider sharing the dataset gathered upon request.


