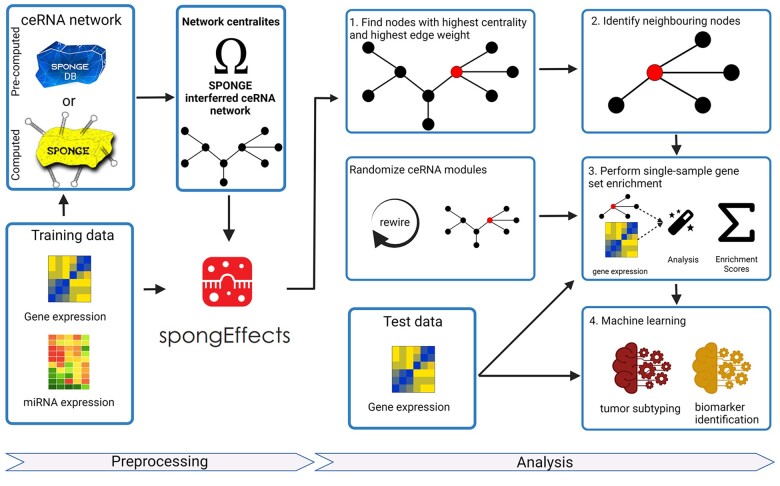
Figure 1.
The workflow of spongEffects. spongEffects accepts a gene expression matrix and a ceRNA network as input. Subsequently, it (a) filters the network and calculates weighted centrality scores to identify important nodes, (b) identifies first neighbors, (c) runs single-sample gene set enrichment, and (d) prepares the output for further downstream tasks (e.g. machine learning-based classification and extraction of mechanistic biomarkers).

