

Key Points
Question
What are the psychometric properties of a Substance Use Symptom Checklist used routinely in primary care among patients reporting high-risk cannabis and/or other drug use?
Findings
In this cross-sectional study of 23 304 positive screens for daily cannabis or any other drug use, the 11-item checklist provided scaled, unidimensional information on the presence and severity of substance use disorder. The checklist performed well across patient age, sex, race, and ethnicity.
Meaning
The findings of this study support the use of the checklist in primary care as a tool to aid clinicians in eliciting patient symptoms, identifying a spectrum of substance use disorder severity, and clinical decision-making based on diagnostic criteria.
This cross-sectional study evaluates the psychometric properties of the Substance Use Symptom Checklist to assess substance use disorder in a primary care setting among adult patients reporting daily cannabis and/or other drug use.
Abstract
Importance
Substance use disorders (SUDs) are underrecognized in primary care, where structured clinical interviews are often infeasible. A brief, standardized substance use symptom checklist could help clinicians assess SUD.
Objective
To evaluate the psychometric properties of the Substance Use Symptom Checklist (hereafter symptom checklist) used in primary care among patients reporting daily cannabis use and/or other drug use as part of population-based screening and assessment.
Design, Setting, and Participants
This cross-sectional study was conducted among adult primary care patients who completed the symptom checklist during routine care between March 1, 2015, and March 1, 2020, at an integrated health care system. Data analysis was conducted from June 1, 2021, to May 1, 2022.
Main Outcomes and Measures
The symptom checklist included 11 items corresponding to SUD criteria in the Diagnostic and Statistical Manual for Mental Disorders (Fifth Edition) (DSM-5). Item response theory (IRT) analyses tested whether the symptom checklist was unidimensional and reflected a continuum of SUD severity and evaluated item characteristics (discrimination and severity). Differential item functioning analyses examined whether the symptom checklist performed similarly across age, sex, race, and ethnicity. Analyses were stratified by cannabis and/or other drug use.
Results
A total of 23 304 screens were included (mean [SD] age, 38.2 [5.6] years; 12 554 [53.9%] male patients; 17 439 [78.8%] White patients; 20 393 [87.5%] non-Hispanic patients). Overall, 16 140 patients reported daily cannabis use only, 4791 patients reported other drug use only, and 2373 patients reported both daily cannabis and other drug use. Among patients with daily cannabis use only, other drug use only, or both daily cannabis and other drug use, 4242 (26.3%), 1446 (30.2%), and 1229 (51.8%), respectively, endorsed 2 or more items on the symptom checklist, consistent with DSM-5 SUD. For all cannabis and drug subsamples, IRT models supported the unidimensionality of the symptom checklist, and all items discriminated between higher and lower levels of SUD severity. Differential item functioning was observed for some items across sociodemographic subgroups but did not result in meaningful change (<1 point difference) in the overall score (0-11).
Conclusions and Relevance
In this cross-sectional study, a symptom checklist, administered to primary care patients who reported daily cannabis and/or other drug use during routine screening, discriminated SUD severity as expected and performed well across subgroups. Findings support the clinical utility of the symptom checklist for standardized and more complete SUD symptom assessment to help clinicians make diagnostic and treatment decisions in primary care.
Introduction
More than 55 million adults in the United States use cannabis or other drugs, with cannabis being most common.1 The health and addictive risks vary by substance but generally increase with the frequency and quantity of use.2 Overall, 7% of US adults meet diagnostic criteria for substance use disorder (SUD),3 defined as having 2 or more of 11 criteria by the Diagnostic and Statistical Manual of Mental Disorders (Fifth Edition) (DSM-5).4 However, the proportion of patients who receive an SUD diagnosis is much lower (0.8%-4.6%).5,6,7,8,9 Low rates of diagnosis decrease opportunities for patients to receive treatment10,11 despite evidence-based options (eg, pharmacotherapy for opioid use disorder, behavioral treatments for cannabis and stimulant use disorders).12,13,14
Brief, validated substance use screens, recommended in primary care by the US Preventive Services Task Force,15 typically ask about frequency of cannabis and other drug use and are useful for screening for SUDs. While these brief screens have been validated for SUDs generally,16 they do not provide information on DSM-5 SUD symptoms. Clinicians need to assess consequences or symptoms resulting from substance use to identify the presence and severity of an SUD. However, clinicians may lack time and training to do so consistently. Brief, standardized assessments offer clinicians a way to assess SUDs and are preferable in general medical settings to full diagnostic interviews,17 which are time-consuming (10-45 minutes) and have specific training and supervision requirements.18 Brief, standardized assessments balance patient and clinician burden while offering a way to help clinicians diagnose SUDs and assess patient treatment needs.19,20 While brief SUD assessments have been validated in research and specialty settings,21,22 their performance when used in general medical settings, with responses documented in electronic health records (EHRs), has not been psychometrically evaluated.
As part of behavioral health integration, Kaiser Permanente Washington began routinely screening patients for past-year cannabis and other drug use followed by Substance Use Symptom Checklist assessment when patients reported daily cannabis or any other drug use on screens.5,23,24,25,26,27,28 This effort provided a unique opportunity to evaluate the clinical application of the Substance Use Symptom Checklist using data collected as part of routine care. Although clinically informative and practical for use in primary care to engage patients in discussions of problems they are experiencing due to cannabis or other drug use,5,27 its psychometric performance as a tool to assess SUD severity is untested. The objective of this study was to evaluate the psychometric properties of the Substance Use Symptom Checklist (ie, symptom checklist) when used routinely among primary care patients reporting daily cannabis use, other drug use, or both to support its use in general medical settings.
Methods
Design, Data, and Setting
This cross-sectional study used EHR data from Kaiser Permanente Washington. Kaiser Permanente Washington is a large integrated health care system providing primary care across 32 clinics in Washington state. This study received approval, waivers of consent, and HIPAA authorization to use existing EHR data from the Kaiser Permanente Washington Health Research Institute institutional review board. Researchers followed the Strengthening the Reporting of Observational Studies in Epidemiology (STROBE) checklist.
Behavioral Health Screening Procedures
Beginning in 2015, adult patients (≥18 years) were asked to complete a 7-item behavioral health screen (on paper or via the patient EHR portal) (eFigure 1 in Supplement 1) as part of routine care, prompted annually with EHR reminders. The screen included separate questions for cannabis (“How often in the past year have you used marijuana?”) and other drug use (“How often in the past year have you used an illegal drug (not marijuana) or used a prescription medication for non-medical reasons?”).28 For both cannabis and other drug use questions, response options were: “never,” “less than monthly,” “monthly,” “weekly,” and “daily or almost daily” use.29 Staff entered screen results into the EHR prior to clinician visits. More than 90% of primary care patients completed annual cannabis and/or other drug screening.
Substance Use Symptom Checklist Procedures
The EHR prompted staff to ask patients to complete the symptom checklist on paper when patients reported cannabis use “daily or almost daily” or any drug use (ie, response other than “never”) and enter responses into the EHR. The decision to use “daily or almost daily” as the threshold for a positive cannabis screen came directly from the health system—based on who might be most likely to have an SUD as well as health system capacity to respond to positive screens—and is consistent with a validation study demonstrating that a threshold of daily cannabis use had high specificity.30
The symptom checklist (eFigure 2 in Supplement 1) was based on 11 DSM-5 criteria4 to elicit SUD symptoms in primary care. It was developed in partnership with frontline clinicians and implemented with behavioral health screening as a tool to facilitate conversations between clinicians and their patients who reported high-risk substance use.5 Approximately 73% to 78% of patients who reported high-risk substance use completed the symptom checklist.28
Sample
Adult patients (≥18 years) were included if they had at least 1 primary care visit from March 1, 2015, to March 1, 2020, and completed 1 or more eligible symptom checklists. Symptom checklists (N = 42 650) were eligible if prompted by daily cannabis use and/or any other drug use screens (39 135 [91.8%]) and completed on the same day as screening (32 872 [84.0%]). We excluded incomplete symptom checklists (1667 [5.1%]) and those linked to a virtual encounter due to differences in workflow (199 [0.6%]). Each symptom checklist fell into 1 of 3 mutually exclusive subsamples, those triggered by (1) daily cannabis use only (n = 22 497); (2) other drug use only (n = 5706); or (3) both daily cannabis and other drug use (n = 2803). However, patients could have completed more than 1 symptom checklist over the study period and thereby be included in more than 1 symptom checklist subsample or in 1 subsample multiple times. Within each symptom checklist subsample, we randomly selected 1 symptom checklist per patient (Figure 1).
Figure 1. Process of Selecting Diagnostic and Statistical Manual of Mental Disorders (Fifth Edition) (DSM-5) Substance Use Symptom Checklists for Inclusion in Analyses.

DSM-5 Substance Use Symptom Checklists are typically administered after a positive cannabis and/or other drug use screen, as part of routine primary care. Positive cannabis and/or other drug use screens were used to define subsamples in which to test the psychometric properties of the checklist. A single, random checklist for each subsample was selected.
aCannabis screens were considered positive if a patient indicated daily or almost daily cannabis use in the past year.
bOther drug screens were considered positive if a patient indicated any other drug use in the past year.
Measures
Substance Use Symptom Checklist
Patients self-reported the presence or absence of 11 DSM-5 symptom criteria on the symptom checklist. The symptom checklist had a past-year timeframe, consistent with diagnostic standards.4 The symptom checklist was scored by summing symptom criteria counts (0-11).31 DSM-5 considers 2 to 3 criteria mild; 4 to 5, moderate; and 6 to 11, severe SUD.
Demographic Characteristics
Demographic characteristics collected from patients and documented in the EHR by the health system were used to approximate patients’ lived identities and experiences. This included age (18-24, 25-44, 45-64, and ≥65 years), sex (female or male) listed on legal forms of identification, self-identified race (American Indian or Alaska Native, Asian, Black, Native Hawaiian or Pacific Islander, or White), and ethnicity (Hispanic or non-Hispanic).32 Participants reporting other or unknown race or unknown ethnicity were included in descriptive tables and full sample analyses but excluded from race- and ethnicity-stratified analyses.
Statistical Analysis
Patient characteristics were described across the 3 symptom checklist subsamples: daily cannabis use only, other drug use only, and both daily cannabis and other drug use. Psychometric analyses of the symptom checklist were conducted using item response theory (IRT) in each of the symptom checklist subsamples. IRT aims to model the relationships that an observable set of measures (eg, SUD criteria reported on symptom checklists) have with an unobservable or latent trait (eg, SUD severity).33 A 2-parameter logistic IRT model using maximum likelihood was fit with the mirt package in R version 4.2.3 (R Project for Statistical Computing) (eAppendix 7 in Supplement 1).34 We performed 3 IRT analyses, 1 for each symptom checklist subsample.
Unidimensionality
IRT assumes that the latent variable (SUD severity) exists along a unidimensional continuum. This unidimensionality is consistent with current diagnosing standards characterizing SUD as a single brain disorder with varying severity.4,31,35 Using a confirmatory approach, we examined the fit of unidimensional IRT models by comparing model fit indices (range, 0-1) to standard cutoffs for acceptable fit: comparative fit index (CFI) greater than 0.95, root mean square error of approximation (RMSEA) less than 0.05, and standardized root mean square residual (SRMSR) less than 0.05.36,37 Standardized factor loadings (λ) characterized the relationship between each item and latent SUD severity38; loadings (range, −1 to 1) with absolute value of 0.40 or greater were considered substantive.39 We examined residual correlation between items after fitting the unidimensional model to identify potential item clusters violating the IRT assumption of local independence and may indicate an unmodeled second factor. If correlations were small (absolute values <0.10),40 a unidimensional model was considered appropriate.40,41
Item Characteristics
IRT models used 2 parameters, discrimination (a) and severity (b) to characterize the association between how patients responded to items on the symptom checklist and their latent SUD severity. Discrimination characterized how well an item differentiated patients with higher vs lower SUD severity; values could range from −∞ to ∞ (but typically range from 0 to 2)42 with higher values indicative of better discrimination. Severity (also known as difficulty) characterized the value along the continuum of latent SUD severity at which an item best discriminated, which was also the level of latent SUD severity needed for patients to have a 50% chance of endorsing the item; values could range from −∞ to ∞ (but typically range from −3 to 3), with higher values endorsed at higher levels of SUD severity.41 IRT parameters were plotted graphically as item characteristic curves (with discrimination and severity corresponding to an item’s slope and location, respectively) to illustrate how the probability of endorsing each of the 11 items (y-axis) was associated with one’s latent SUD severity (x-axis).41,42
Differential Item Functioning and Expected Clinical Impact
Differential item functioning (DIF) could occur if the probabilities of endorsing specific symptom checklist items were influenced by a patient’s broader lived experiences rather than their latent level of SUD severity.42,43 A high degree of DIF could be clinically problematic, suggesting, for example, that some items measured SUD differently for different demographic subgroups. For each demographic subgroup (age, sex, race, and ethnicity) within each symptom checklist subsample, we used a likelihood ratio test to statistically test for DIF by comparing a more complex IRT model in which item parameters could vary by demographic subgroup to a simpler model that constrained item parameters to be the same for subgroups (eAppendix 2 in Supplement 1).43,44
However, DIF could be present without meaningfully changing clinical interpretation of scores.43 Because SUD severity was determined by the number of SUD criteria (0-11), knowing whether DIF led to differences in criteria count may be more clinically meaningful than knowing whether DIF was present for individual items.44 We examined differences in the total expected number of criteria (0-11) endorsed by patients with the same level of latent SUD severity to understand whether the test as a whole performed differently across demographic subgroups. We also examined differences in CFIs between models with and without correction for DIF for each demographic subgroup (eAppendix 2 in Supplement 1).45
Results
Descriptive
A total of 23 304 screens were included (mean [SD] age, 38.2 [5.6] years; 12 554 [53.9%] male patients; 17 439 [78.8%] White patients; 20 393 [87.5%] non-Hispanic patients). Symptom checklist subsamples included 16 140 patients who reported daily cannabis use only, 4791 patients who reported other drug use only, and 2373 patients who reported both daily cannabis and other drug use (Figure 1). All 3 subsamples were predominantly male (8386 [52.0%]; 2693 [56.2%]; and 1475 [62.2%]), aged 25 to 44 years (7576 [46.9%]; 2470 [51.6%]; and 1257 [53.0%]), non-Hispanic (14 252 [88.3%]; 4113 [85.9%]; and 2028 [85.5%]), and White (12 397 [76.8%]; 3391 [70.8%]; and 1734 [73.1%]) (Table 1).
Table 1. Sample Characteristics Among Primary Care Patients Who Reported Daily Cannabis Use Only, Other Drug Use Only, and Both Daily Cannabis and Other Drug Use on Routine Screening From March 1, 2015, to March 1, 2020.
| Characteristic | Patients, No. (%) | ||
|---|---|---|---|
| Daily cannabis use only (n = 16 140) | Other drug use only (n = 4791) | Daily cannabis and other drug use (n = 2373) | |
| Age group, y | |||
| 18-24 | 2813 (17.4) | 1245 (26.0) | 787 (33.2) |
| 25-44 | 7576 (46.9) | 2470 (51.6) | 1257 (53.0) |
| 45-64 | 4150 (25.7) | 842 (17.6) | 273 (11.5) |
| ≥65 | 1601 (9.9) | 233 (4.9) | 55 (2.3) |
| Sex | |||
| Female | 7754 (48.0) | 2097 (43.8) | 897 (37.8) |
| Male | 8386 (52.0) | 2693 (56.2) | 1475 (62.2) |
| Race | |||
| American Indian or Alaska Native | 397 (2.5) | 99 (2.1) | 60 (2.5) |
| Asian | 544 (3.4) | 425 (8.9) | 116 (4.9) |
| Black or African American | 1145 (7.1) | 286 (6.0) | 177 (7.5) |
| Native Hawaiian or Pacific Islander | 247 (1.5) | 92 (1.9) | 41 (1.7) |
| White | 12 397 (76.8) | 3391 (70.8) | 1734 (73.1) |
| Other or unknown | 1400 (8.7) | 497 (10.4) | 244 (10.3) |
| Ethnicity | |||
| Hispanic | 1045 (6.5) | 390 (8.1) | 195 (8.2) |
| Not Hispanic | 14 252 (88.3) | 4113 (85.9) | 2028 (85.5) |
| Unknown | 843 (5.2) | 287 (6.0) | 149 (6.3) |
Prevalence of SUD Criteria
Among patients with daily cannabis use only, other drug use only, or both daily cannabis and other drug use, 4242 (26.3%), 1446 (30.2%), and 1229 (51.8%), respectively, reported symptoms consistent with SUD (Table 2).4 For patients with daily cannabis use only, prevalence of each SUD criterion varied from 4.4% (705 patients) for the item neglect roles to 21.9% (3536 patients) for the item tolerance. For patients with other drug use only, they ranged from 11.9% (570 patients) for the item hazardous use to 25.2% (1207 patients) for the item physical or psychological problems. For patients with daily cannabis use and other drug use, they ranged from 18.7% (444 patients) for the item neglect roles to 41.5% (985 patients) for the item tolerance (Table 2).
Table 2. Prevalence of SUD Criteria Assessed on the Substance Use Symptom Checklist Among Primary Care Patients Who Reported Daily Cannabis Use Only, Other Drug Use Only, and Both Daily Cannabis and Other Drug Use on Routine Screening From March 1, 2015, to March 1, 2020.
| Substance Use Symptom Checklist item | Patients, No. (%) | ||
|---|---|---|---|
| Daily cannabis use only (n = 16 140) | Other drug use only (n = 4791) | Daily cannabis and other drug use (n = 2373) | |
| Tolerance | 3536 (21.9) | 944 (19.7) | 985 (41.5) |
| Withdrawal | 1248 (7.7) | 760 (15.9) | 495 (20.9) |
| Larger/longer | 1501 (9.3) | 984 (20.5) | 622 (26.2) |
| Quit/control | 1662 (10.3) | 828 (17.3) | 565 (23.8) |
| Time spent | 774 (4.8) | 666 (13.9) | 483 (20.4) |
| Physical or psychological problems | 3139 (19.4) | 1207 (25.2) | 899 (37.9) |
| Neglect roles | 705 (4.4) | 728 (15.2) | 444 (18.7) |
| Hazardous use | 919 (5.7) | 570 (11.9) | 494 (20.8) |
| Social or interpersonal problems | 1571 (9.7) | 1009 (21.1) | 651 (27.4) |
| Craving | 2693 (16.7) | 989 (20.6) | 876 (36.9) |
| Activities given up | 1043 (6.5) | 726 (15.2) | 493 (20.8) |
| Total DSM-5 SUD criteria | |||
| 0-1 Criteria, no SUD | 11 898 (73.7) | 3345 (69.8) | 1144 (48.2) |
| 2-3 Criteria, mild SUD | 2585 (16.0) | 468 (9.8) | 478 (20.1) |
| 4-5 Criteria, moderate SUD | 934 (5.8) | 237 (4.9) | 252 (10.6) |
| ≥6 Criteria, severe SUD | 723 (4.5) | 741 (15.5) | 499 (21.0) |
Abbreviations: DSM-5, Diagnostic and Statistical Manual of Mental Disorders (Fifth Edition); SUD, substance use disorder.
Unidimensionality
Unidimensional factor models demonstrated excellent fit to the symptom checklist’s 11 items (CFI >0.95; RMSEA <0.05; SRMSR <0.05) (Table 3), indicating they measured latent SUD severity along a unidimensional continuum. Standardized factor loadings ranged from 0.64 to 0.96 (Table 3), and residual correlations were small (absolute value <0.09).
Table 3. Item Response Theory Parameter Estimates for the 11 Substance Use Disorder Criteria Assessed on the Substance Use Symptom Checklist Among Primary Care Patients Who Reported Daily Cannabis Use Only, Other Drug Use Only, and Both Daily Cannabis and Other Drug Use on Routine Screening From March 1, 2015, to March 1, 2020a.
| Substance Use Symptom Checklist item | Daily cannabis use only (n = 16 140) | Other drug use only (n = 4791) | Daily cannabis & other drug use (n = 2373) | ||||||
|---|---|---|---|---|---|---|---|---|---|
| Loading, λ | Discrimination, a (95% CI) | Severity, b (95% CI) | Loading, λ | Discrimination, a (95% CI) | Severity, b (95% CI) | Loading, λ | Discrimination, a (95% CI) | Severity, b (95% CI) | |
| Tolerance | 0.64 | 1.42 (1.35-1.50) | 1.21 (1.17-1.30) | 0.85 | 2.79 (2.57-3.00) | 1.00 (0.93-1.10) | 0.67 | 1.55 (1.39-1.70) | 0.31 (0.23-0.40) |
| Withdrawal | 0.78 | 2.09 (1.96-2.20) | 1.86 (1.79-1.90) | 0.94 | 4.72 (4.29-5.20) | 1.06 (0.97-1.20) | 0.83 | 2.57 (2.30-2.90) | 0.96 (0.87-1.10) |
| Larger/longer | 0.83 | 2.57 (2.42-2.70) | 1.60 (1.53-1.70) | 0.93 | 4.46 (4.07-4.90) | 0.88 (0.80-1.00) | 0.87 | 3.02 (2.69-3.40) | 0.72 (0.64-0.80) |
| Quit/control | 0.81 | 2.37 (2.24-2.50) | 1.57 (1.51-1.60) | 0.92 | 4.02 (3.68-4.40) | 1.02 (0.94-1.10) | 0.85 | 2.70 (2.41-3.00) | 0.83 (0.75-0.90) |
| Time spent | 0.83 | 2.57 (2.40-2.80) | 2.03 (1.93-2.10) | 0.96 | 5.72 (5.13-6.40) | 1.13 (1.02-1.30) | 0.88 | 3.07 (2.73-3.50) | 0.94 (0.84-1.00) |
| Physical or psychological problems | 0.73 | 1.81 (1.71-1.90) | 1.19 (1.15-1.20) | 0.90 | 3.46 (3.18-3.80) | 0.74 (0.68-0.80) | 0.82 | 2.41 (2.16-2.70) | 0.37 (0.30-0.40) |
| Neglect roles | 0.86 | 2.84 (2.64-3.10) | 2.02 (1.91-2.10) | 0.94 | 4.67 (4.24-5.10) | 1.09 (1.00-1.20) | 0.91 | 3.61 (3.19-4.10) | 0.97 (0.86-1.10) |
| Hazardous use | 0.68 | 1.56 (1.46-1.70) | 2.40 (2.31-2.50) | 0.87 | 3.01 (2.75-3.30) | 1.37 (1.27-1.50) | 0.72 | 1.75 (1.56-2.00) | 1.13 (1.03-1.20) |
| Social or interpersonal problems | 0.77 | 2.05 (1.93-2.20) | 1.71 (1.64-1.80) | 0.93 | 4.41 (4.02-4.80) | 0.86 (0.79-0.90) | 0.85 | 2.78 (2.49-3.10) | 0.69 (0.61-0.80) |
| Craving | 0.78 | 2.09 (1.98-2.20) | 1.26 (1.21-1.30) | 0.94 | 4.47 (4.08-4.90) | 0.87 (0.80-1.00) | 0.81 | 2.32 (2.08-2.60) | 0.40 (0.34-0.50) |
| Activities given up | 0.84 | 2.64 (2.48-2.80) | 1.82 (1.74-1.90) | 0.95 | 5.13 (4.64-5.70) | 1.08 (0.99-1.20) | 0.88 | 3.09 (2.74-3.50) | 0.92 (0.82-1.00) |
| Model fit indices | |||||||||
| CFIb | 0.989 | 0.998 | 0.995 | ||||||
| RMSEAc | 0.034 | 0.031 | 0.035 | ||||||
| SRMSRc | 0.034 | 0.021 | 0.026 | ||||||
Abbreviations: CFI, comparative fit index; RMSEA, root mean standard error of approximation; SRMSR, standardized root mean square residual.
Standardized factor loadings (λ) characterize the strength of the association between an item and latent substance use disorder; values can range from 0 to 1 with loadings of 0.40 or greater considered substantive. Discrimination (a) characterizes how well an item differentiates patients with higher vs lower substance use disorder severity; values can range from −∞ to ∞, but typically range from 0 to 2, with higher values indicative of better discrimination. Severity (b) characterizes the value along the continuum of latent substance use disorder severity at which an item best discriminates, which is also the level of latent substance use disorder severity needed for patients to have a 50% chance of endorsing the item; values can range from −∞ to ∞ but typically range from −3 to 3, with higher values endorsed at higher levels of substance use disorder severity.
A value greater than 0.95 indicates acceptable model fit.
A value less than 0.05 indicates acceptable model fit.
Item Characteristics
For all symptom checklist subsamples, symptom checklist items discriminated higher vs lower SUD severity as expected (discrimination parameters all positive and significant) with the probability of endorsing each item increasing as SUD severity increased. While discrimination was higher than typical33 (illustrated by steep slopes in Figure 2), 1 item (tolerance) consistently did not discriminate as strongly as other items. Across subsamples, some items had lower severity parameters (eg, tolerance, physical or psychological problems, craving) and discriminated best when SUD severity was mild (illustrated by curves shifted further to the left in Figure 2). Other items had higher severity parameters (eg, hazardous use, time spent, neglect roles) and discriminated best when SUD was severe (illustrated by curves shifted further to the right in Figure 2).
Figure 2. Item Characteristic Curves for 11 Substance Use Disorder (SUD) Criteria on the Substance Use Symptom Checklist.
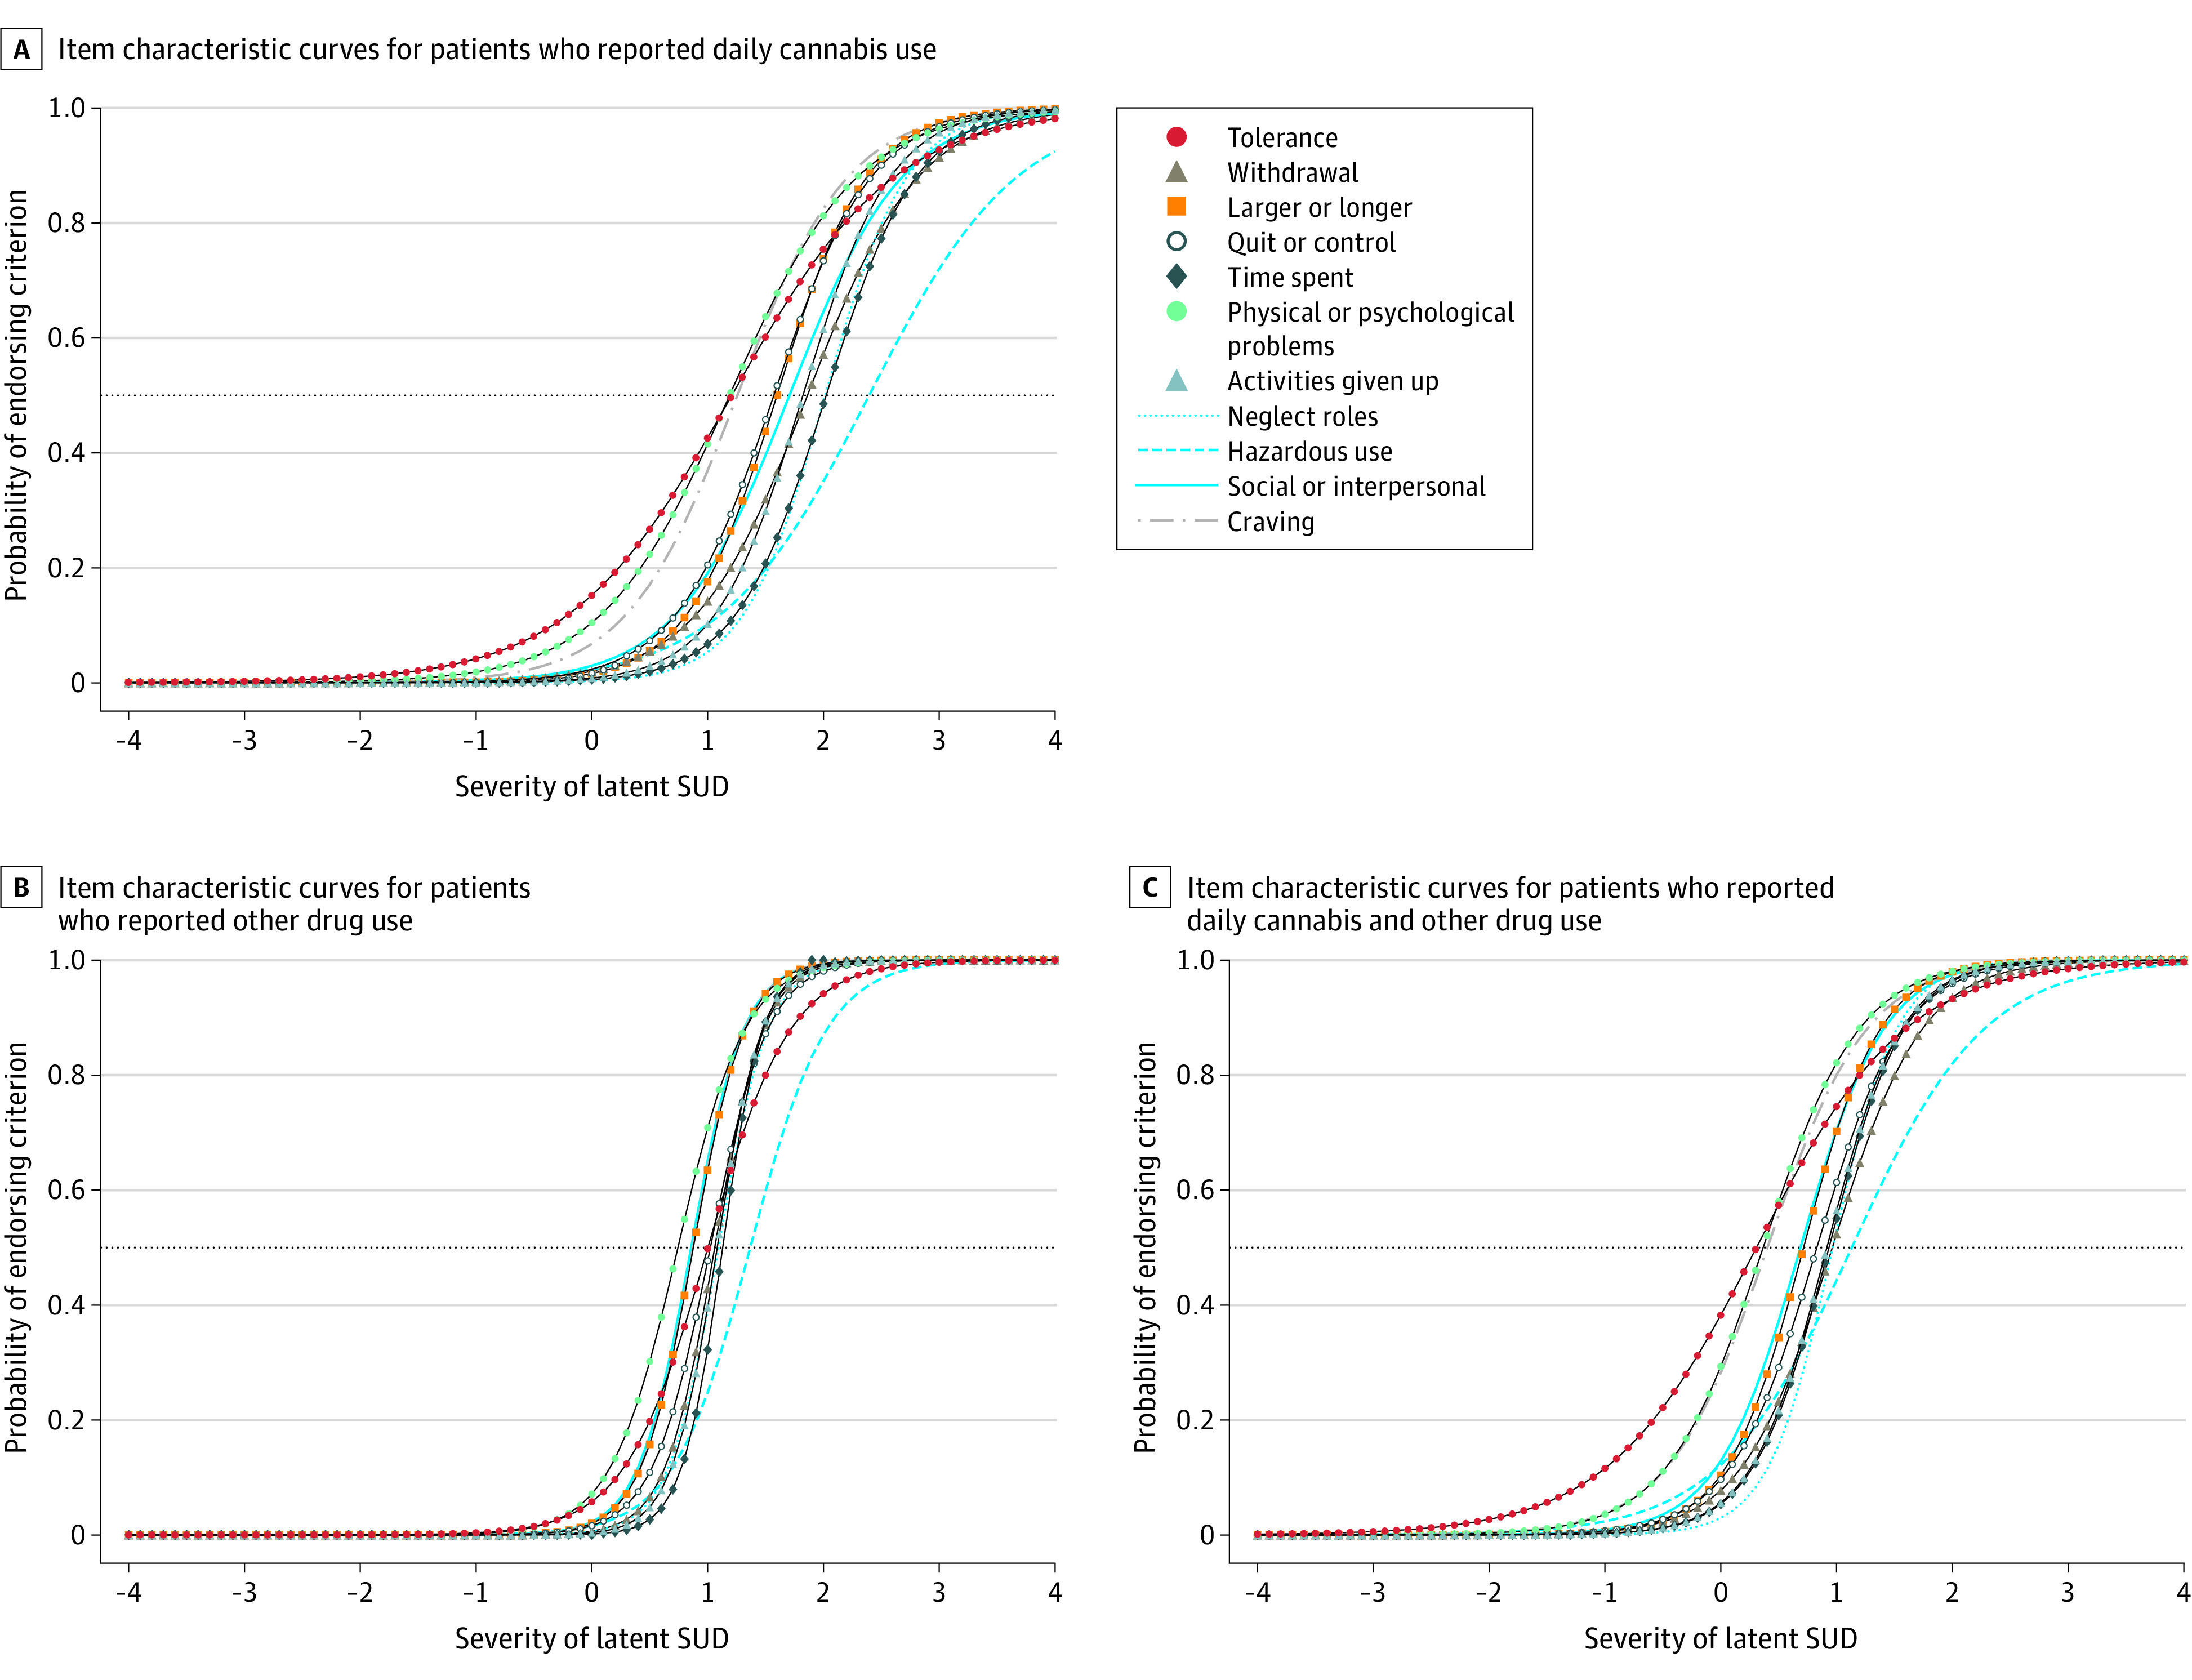
Item characteristic curves among primary care patients who reported daily cannabis use only (n = 16 140) (A), other drug use only (n = 4791) (B), and both daily cannabis and other drug use (n = 2373) (C) on routine screening from March 1, 2015, to March 1, 2020. Each of the 11 criteria is represented as a separate curve. The slope of the curve corresponds to the discrimination parameter a. The point where each line intersects the dashed horizontal line indicates the level of latent SUD severity where patients have a 50% probability of endorsing the criterion, which corresponds to the severity parameter b.
DIF and Clinical Impact
Several items had significant DIF by age and sex for all 3 symptom checklist subsamples. Additionally, there was significant DIF by race for patients who reported daily cannabis use only and by ethnicity for patients who reported other drug use only (eAppendices 3-5 in Supplement 1). However, correcting for item-level DIF changed expected SUD criteria counts by less than 0.5 criteria for patients with daily cannabis use only and less than 1 criterion for patients with other drug use or both daily cannabis and other drug use (eAppendix 6 in Supplement 1), indicating it was unlikely to significantly alter criteria counts that indicate SUD severity. Differences in comparative fit indices from models with and without correction for DIF suggested minimal impact (change in CFI <0.01) (eTable 10 in eAppendix 6 in Supplement 1).
Discussion
This study evaluated the psychometric performance of a Substance Use Symptom Checklist used routinely among primary care patients reporting daily cannabis use, other drug use, or both. Consistent with DSM-5 conceptualization of SUD, the symptom checklist measured SUD along a unidimensional continuum with items that discriminated SUD severity in each subsample. DIF analyses indicated that patient age, sex, race, and ethnicity did not meaningfully affect total criteria counts, suggesting minimal impact of DIF on accurately assessing SUD severity. Findings support use of the symptom checklist as a tool to aid clinicians in eliciting patient symptoms, identifying a spectrum of SUD severity, and supporting clinical decision-making based on DSM-5 criteria.
To our knowledge, this is the first study to evaluate a Substance Use symptom checklist of DSM-5 criteria when used routinely in primary care; however, findings are consistent with psychometric studies of SUD criteria in epidemiology studies31,46,47,48,49,50,51,52,53,54,55,56,57 and clinical trials.31,58,59,60,61,62,63,64,65,66,67,68,69,70 Psychometric studies were instrumental in the decision to revise DSM criteria, from abuse and dependence (DSM-IV) to a single SUD represented by a continuum of severity from 2 to 11 symptoms (DSM-5).4,31 Our findings build on this work to support use of the symptom checklist as a tool for assessing the spectrum of DSM-5 SUD in primary care. While beyond the scope of this study, exploratory psychometric studies71 could improve on DSM-5 conceptualization of SUD.
SUD symptoms represent negative consequences of use, which can be used in clinical conversations to help patients identify reasons for reducing substance use. Consistent with prior studies, tolerance was less discriminating than other criteria,31 particularly for patients who use cannabis only. This may reflect physiological adaptation to regular but not necessarily harmful use, and in the absence of 2 additional criteria, experts consider tolerance less likely to indicate SUD.31 Consistent with a previous study evaluating the psychometric performance of an Alcohol Symptom Checklist used in routine care,44 more discriminating items included neglect roles, time spent, and activities given up, which may reflect life domains that are important to patients.
Measurement is essential for improving care for patients using cannabis and other drugs.25 Implementation of symptom checklists for patients who self-report daily cannabis and/or other drug use, is affordable,27 feasible,23,24,26 and acceptable to patients in primary care.5,25 The ability to measure SUD symptoms can help with SUD identification, symptom management, and treatment planning for patients.72 Study findings support the symptom checklist’s construct validity73 as a scaled measure of SUD severity. The strong psychometric performance identified may help clinicians feel confident in measurement-based tools to support SUD identification and care in general medical settings where they are underrecognized and undertreated.6,8,9 A lack of clinically meaningful difference between expected total scores on the symptom checklist for patients of different ages, sexes, races, and ethnicities supports its use in diverse patient populations. Future studies are needed to evaluate test-retest reliability of the symptom checklist and discriminative validity compared with a confidential interview comparison standard for SUD.
Limitations
The use of routinely collected assessment data documented in EHRs is a unique strength of this study; it also introduced important limitations. Symptom checklists were only routinely administered to those reporting “daily or almost daily” cannabis or any other drug use. Nevertheless, we identified a spectrum of SUDs in this patient population. For patients who reported daily cannabis and other drug use, it was unclear which substance predominantly contributed to symptoms. Similarly, among patients who reported other drug use, it was unknown what class of drugs (eg, opioids, stimulants) contributed to symptoms. However, for the symptom checklist to be practical in primary care, it was not possible to use different checklists for specific substances. Some patients may have underestimated or underreported substance use on behavioral health screens and/or symptoms on symptom checklists, although many patients were willing to report substance use and multiple SUD symptoms. Dichotomous endorsement of symptoms may not reflect the reality of how patients experience an SUD, and the symptom checklist did not assess the frequency of criteria; clinicians must use clinical judgment and confirm symptoms are recurrent to diagnose SUD. Nevertheless, the symptom checklist can prompt a patient-clinician conversation leading to diagnosis of specific SUDs. Additionally, this study was conducted in a predominantly non-Hispanic, White patient population insured by an integrated health care system in a US state where adult cannabis use is legal. Analyses of DIF by race may have been underpowered,74 and findings may not generalize to other patient populations, health systems, and settings. Despite these limitations, the use of data collected as part of routine care is an important and novel strength that lends external validity to findings.
Conclusions
This cross-sectional study supports the Substance Use Symptom Checklist as a measure of SUD severity when used routinely in primary care. Specifically, the 11-item symptom checklist provided scaled, unidimensional information to help clinicians assess SUD symptoms and severity among patients with high-risk cannabis and other drug use. The symptom checklist was brief, feasible to administer in primary care, and performed equitably across age, sex, race, and ethnicity. These findings support the clinical utility of the symptom checklist as a tool for primary care.
eFigure 1. Routine Behavioral Health Screen With Single Items for Cannabis and Other Drugs
eFigure 2. The Substance Use Symptom Checklist (Symptom Checklist): A DSM-5 SUD Symptom Assessment Tool
eAppendix 1. Detailed Description of Item Characteristics
eAppendix 2. Detailed Description of Differential Item Functioning (DIF) Analyses
eAppendix 3. DIF Findings for Patients Who Reported Daily Cannabis Use Only
eAppendix 4. DIF Findings for Patients Who Reported Other Drug Use Only
eAppendix 5. DIF Findings for Patients Who Reported Both Daily Cannabis and Other Drug Use
eAppendix 6. Detailed Description of the Clinical Impact DIF Has on Estimated SUD Severity
eAppendix 7. R Code for IRT and DIF Analyses
eReferences.
Data Sharing Statement
References
- 1.Substance Abuse and Mental Health Services Administration . Key substance use and mental health indicators in the United States: results from the 2020 National Survey on Drug Use and Health. 2021. Accessed April 26, 2023. https://www.samhsa.gov/data/sites/default/files/reports/rpt35325/NSDUHFFRPDFWHTMLFiles2020/2020NSDUHFFR1PDFW102121.pdf
- 2.Degenhardt L, Hall W. Extent of illicit drug use and dependence, and their contribution to the global burden of disease. Lancet. 2012;379(9810):55-70. doi: 10.1016/S0140-6736(11)61138-0 [DOI] [PubMed] [Google Scholar]
- 3.Substance Abuse and Mental Health Services Administration . Results from the 2020 National Survey on Drug Use and Health: detailed tables. 2021. Accessed April 26, 2023. https://www.samhsa.gov/data/report/2020-nsduh-detailed-tables
- 4.American Psychiatric Association . Diagnostic and Statistical Manual of Mental Disorders. 5th ed. American Psychiatric Association; 2013. [Google Scholar]
- 5.Sayre M, Lapham GT, Lee AK, et al. Routine assessment of symptoms of substance use disorders in primary care: prevalence and severity of reported symptoms. J Gen Intern Med. 2020;35(4):1111-1119. doi: 10.1007/s11606-020-05650-3 [DOI] [PMC free article] [PubMed] [Google Scholar]
- 6.Bonn-Miller MO, Bucossi MM, Trafton JA. The underdiagnosis of cannabis use disorders and other axis-I disorders among military veterans within VHA. Mil Med. 2012;177(7):786-788. doi: 10.7205/MILMED-D-12-00052 [DOI] [PubMed] [Google Scholar]
- 7.Bonn-Miller MO, Harris AHS, Trafton JA. Prevalence of cannabis use disorder diagnoses among veterans in 2002, 2008, and 2009. Psychol Serv. 2012;9(4):404-416. doi: 10.1037/a0027622 [DOI] [PubMed] [Google Scholar]
- 8.Hallgren KA, Witwer E, West I, et al. Prevalence of documented alcohol and opioid use disorder diagnoses and treatments in a regional primary care practice-based research network. J Subst Abuse Treat. 2020;110:18-27. doi: 10.1016/j.jsat.2019.11.008 [DOI] [PMC free article] [PubMed] [Google Scholar]
- 9.Williams EC, Fletcher OV, Frost MC, Harris AHS, Washington DL, Hoggatt KJ. Comparison of substance use disorder diagnosis rates from electronic health record data with substance use disorder prevalence rates reported in surveys across sociodemographic groups in the Veterans Health Administration. JAMA Netw Open. 2022;5(6):e2219651-e2219651. doi: 10.1001/jamanetworkopen.2022.19651 [DOI] [PMC free article] [PubMed] [Google Scholar]
- 10.Grant BF, Saha TD, Ruan WJ, et al. Epidemiology of DSM-5 drug use disorder: results from the National Epidemiologic Survey on Alcohol and Related Conditions-III. JAMA Psychiatry. 2016;73(1):39-47. doi: 10.1001/jamapsychiatry.2015.2132 [DOI] [PMC free article] [PubMed] [Google Scholar]
- 11.Hasin DS, Kerridge BT, Saha TD, et al. Prevalence and correlates of DSM-5 cannabis use disorder, 2012-2013: findings from the National Epidemiologic Survey on Alcohol and Related Conditions-III. Am J Psychiatry. 2016;173(6):588-599. doi: 10.1176/appi.ajp.2015.15070907 [DOI] [PMC free article] [PubMed] [Google Scholar]
- 12.Sherman BJ, McRae-Clark AL. Treatment of cannabis use disorder: current science and future outlook. Pharmacotherapy. 2016;36(5):511-535. doi: 10.1002/phar.1747 [DOI] [PMC free article] [PubMed] [Google Scholar]
- 13.Ronsley C, Nolan S, Knight R, et al. Treatment of stimulant use disorder: a systematic review of reviews. PLoS One. 2020;15(6):e0234809. doi: 10.1371/journal.pone.0234809 [DOI] [PMC free article] [PubMed] [Google Scholar]
- 14.Korthuis PT, McCarty D, Weimer M, et al. Primary care-based models for the treatment of opioid use disorder: a scoping review. Ann Intern Med. 2017;166(4):268-278. doi: 10.7326/M16-2149 [DOI] [PMC free article] [PubMed] [Google Scholar]
- 15.Krist AH, Davidson KW, Mangione CM, et al. ; US Preventive Services Task Force . Screening for unhealthy drug use: US Preventive Services Task Force recommendation statement. JAMA. 2020;323(22):2301-2309. doi: 10.1001/jama.2020.8020 [DOI] [PubMed] [Google Scholar]
- 16.McNeely J, Wu LT, Subramaniam G, et al. Performance of the Tobacco, Alcohol, Prescription Medication, and Other Substance Use (TAPS) tool for substance use screening in primary care patients. Ann Intern Med. 2016;165(10):690-699. doi: 10.7326/M16-0317 [DOI] [PMC free article] [PubMed] [Google Scholar]
- 17.Saxon AJ. Screening for unhealthy use of alcohol and other drugs in primary care. UpToDate. February 16, 2022. Accessed April 26, 2023. https://www.uptodate.com/contents/screening-for-unhealthy-use-of-alcohol-and-other-drugs-in-primary-care
- 18.Forman RF, Svikis D, Montoya ID, Blaine J. Selection of a substance use disorder diagnostic instrument by the National Drug Abuse Treatment Clinical Trials Network. J Subst Abuse Treat. 2004;27(1):1-8. doi: 10.1016/j.jsat.2004.03.012 [DOI] [PMC free article] [PubMed] [Google Scholar]
- 19.Scott K, Lewis CC. Using measurement-based care to enhance any treatment. Cogn Behav Pract. 2015;22(1):49-59. doi: 10.1016/j.cbpra.2014.01.010 [DOI] [PMC free article] [PubMed] [Google Scholar]
- 20.Marsden J, Tai B, Ali R, Hu L, Rush AJ, Volkow N. Measurement-based care using DSM-5 for opioid use disorder: can we make opioid medication treatment more effective? Addiction. 2019;114(8):1346-1353. doi: 10.1111/add.14546 [DOI] [PMC free article] [PubMed] [Google Scholar]
- 21.Hildebrand M. The psychometric properties of the Drug Use Disorders Identification Test (DUDIT): a review of recent research. J Subst Abuse Treat. 2015;53:52-59. doi: 10.1016/j.jsat.2015.01.008 [DOI] [PubMed] [Google Scholar]
- 22.Yudko E, Lozhkina O, Fouts A. A comprehensive review of the psychometric properties of the Drug Abuse Screening Test. J Subst Abuse Treat. 2007;32(2):189-198. doi: 10.1016/j.jsat.2006.08.002 [DOI] [PubMed] [Google Scholar]
- 23.Richards JE, Bobb JF, Lee AK, et al. Integration of screening, assessment, and treatment for cannabis and other drug use disorders in primary care: an evaluation in three pilot sites. Drug Alcohol Depend. 2019;201:134-141. doi: 10.1016/j.drugalcdep.2019.04.015 [DOI] [PMC free article] [PubMed] [Google Scholar]
- 24.Glass JE, Bobb JF, Lee AK, et al. Study protocol: a cluster-randomized trial implementing Sustained Patient-Centered Alcohol-Related Care (SPARC trial). Implement Sci. 2018;13(1):108. doi: 10.1186/s13012-018-0795-9 [DOI] [PMC free article] [PubMed] [Google Scholar]
- 25.Bradley KA, Caldeiro RM, Hallgren KA, Kivlahan DR. Making measurement-based care for addictions a reality in primary care. Addiction. 2019;114(8):1355-1356. doi: 10.1111/add.14605 [DOI] [PMC free article] [PubMed] [Google Scholar]
- 26.Bobb JF, Lee AK, Lapham GT, et al. Evaluation of a pilot implementation to integrate alcohol-related care within primary care. Int J Environ Res Public Health. 2017;14(9):1030. doi: 10.3390/ijerph14091030 [DOI] [PMC free article] [PubMed] [Google Scholar]
- 27.Yeung K, Richards J, Goemer E, et al. Costs of using evidence-based implementation strategies for behavioral health integration in a large primary care system. Health Serv Res. 2020;55(6):913-923. doi: 10.1111/1475-6773.13592 [DOI] [PMC free article] [PubMed] [Google Scholar]
- 28.Bradley KA, Lapham GT, Lee AK. Screening for drug use in primary care: practical implications of the new USPSTF recommendation. JAMA Intern Med. 2020;180(8):1050-1051. doi: 10.1001/jamainternmed.2019.7335 [DOI] [PMC free article] [PubMed] [Google Scholar]
- 29.WHO ASSIST Working Group . The Alcohol, Smoking and Substance Involvement Screening Test (ASSIST): development, reliability and feasibility. Addiction. 2002;97(9):1183-1194. doi: 10.1046/j.1360-0443.2002.00185.x [DOI] [PubMed] [Google Scholar]
- 30.Matson TE, Lapham GT, Bobb JF, et al. Validity of the Single-Item Screen-Cannabis (SIS-C) for cannabis use disorder screening in routine care. JAMA Netw Open. 2022;5(11):e2239772. doi: 10.1001/jamanetworkopen.2022.39772 [DOI] [PMC free article] [PubMed] [Google Scholar]
- 31.Hasin DS, O’Brien CP, Auriacombe M, et al. DSM-5 criteria for substance use disorders: recommendations and rationale. Am J Psychiatry. 2013;170(8):834-851. doi: 10.1176/appi.ajp.2013.12060782 [DOI] [PMC free article] [PubMed] [Google Scholar]
- 32.NIH Style Guide. Race and national origin. National Institutes of Health. Accessed April 28, 2023. https://www.nih.gov/nih-style-guide/race-national-origin
- 33.Baker FB. The Basics of Item Response Theory. ERIC Clearinghouse on Assessment and Evaluation; 2001. [Google Scholar]
- 34.Chalmers R. mirt: A multidimensional item response theory package for the R environment. J Stat Softw. 2012;48(6):1-29. doi: 10.18637/jss.v048.i06 [DOI] [Google Scholar]
- 35.Heilig M, MacKillop J, Martinez D, Rehm J, Leggio L, Vanderschuren LJMJ. Addiction as a brain disease revised: why it still matters, and the need for consilience. Neuropsychopharmacology. 2021;46(10):1715-1723. doi: 10.1038/s41386-020-00950-y [DOI] [PMC free article] [PubMed] [Google Scholar]
- 36.Iacobucci D. Structural equations modeling: fit indices, sample size, and advanced topics. J Consum Psychol. 2010;20(1):90-98. doi: 10.1016/j.jcps.2009.09.003 [DOI] [Google Scholar]
- 37.Jöreskog KG, Moustaki I. Factor analysis of ordinal variables: a comparison of three approaches. Multivariate Behav Res. 2001;36(3):347-387. doi: 10.1207/S15327906347-387 [DOI] [PubMed] [Google Scholar]
- 38.Bean GJ, Bowen NK. Item response theory and confirmatory factor analysis: complementary approaches for scale development. J Evid Based Soc Work. 2021;18(6):597-618. [Google Scholar]
- 39.Stevens JP. Applied Multivariate Statistics for the Social Sciences. Routledge; 2012. doi: 10.4324/9780203843130 [DOI] [Google Scholar]
- 40.Toland MD. Practical guide to conducting an item response theory analysis. J Early Adolesc. 2014;34(1):120-151. doi: 10.1177/0272431613511332 [DOI] [Google Scholar]
- 41.Nguyen TH, Han HR, Kim MT, Chan KS. An introduction to item response theory for patient-reported outcome measurement. Patient. 2014;7(1):23-35. doi: 10.1007/s40271-013-0041-0 [DOI] [PMC free article] [PubMed] [Google Scholar]
- 42.Hays RD, Morales LS, Reise SP. Item response theory and health outcomes measurement in the 21st century. Med Care. 2000;38(9)(suppl):II28-II42. doi: 10.1097/00005650-200009002-00007 [DOI] [PMC free article] [PubMed] [Google Scholar]
- 43.Chalmers RP, Counsell A, Flora DB. It might not make a big DIF: improved differential test functioning statistics that account for sampling variability. Educ Psychol Meas. 2016;76(1):114-140. doi: 10.1177/0013164415584576 [DOI] [PMC free article] [PubMed] [Google Scholar]
- 44.Hallgren KA, Matson TE, Oliver M, et al. Practical assessment of alcohol use disorder in routine primary care: performance of an alcohol symptom checklist. J Gen Intern Med. 2022;37(8):1885-1893. doi: 10.1007/s11606-021-07038-3 [DOI] [PMC free article] [PubMed] [Google Scholar]
- 45.Cheung GW, Rensvold RB. Evaluating goodness-of-fit indexes for testing measurement invariance. Struct Equ Modeling. 2002;9(2):233-255. doi: 10.1207/S15328007SEM0902_5 [DOI] [Google Scholar]
- 46.Clark SL, Gillespie NA, Adkins DE, Kendler KS, Neale MC. Psychometric modeling of abuse and dependence symptoms across six illicit substances indicates novel dimensions of misuse. Addict Behav. 2016;53:132-140. doi: 10.1016/j.addbeh.2015.10.015 [DOI] [PMC free article] [PubMed] [Google Scholar]
- 47.Compton WM, Saha TD, Conway KP, Grant BF. The role of cannabis use within a dimensional approach to cannabis use disorders. Drug Alcohol Depend. 2009;100(3):221-227. doi: 10.1016/j.drugalcdep.2008.10.009 [DOI] [PMC free article] [PubMed] [Google Scholar]
- 48.Derringer J, Krueger RF, Dick DM, et al. Measurement invariance of DSM-IV alcohol, marijuana and cocaine dependence between community-sampled and clinically overselected studies. Addiction. 2013;108(10):1767-1776. doi: 10.1111/add.12187 [DOI] [PMC free article] [PubMed] [Google Scholar]
- 49.Gillespie NA, Neale MC, Prescott CA, Aggen SH, Kendler KS. Factor and item-response analysis DSM-IV criteria for abuse of and dependence on cannabis, cocaine, hallucinogens, sedatives, stimulants and opioids. Addiction. 2007;102(6):920-930. doi: 10.1111/j.1360-0443.2007.01804.x [DOI] [PubMed] [Google Scholar]
- 50.Lynskey MT, Agrawal A. Psychometric properties of DSM assessments of illicit drug abuse and dependence: results from the National Epidemiologic Survey on Alcohol and Related Conditions (NESARC). Psychol Med. 2007;37(9):1345-1355. doi: 10.1017/S0033291707000396 [DOI] [PubMed] [Google Scholar]
- 51.Piontek D, Kraus L, Legleye S, Bühringer G. The validity of DSM-IV cannabis abuse and dependence criteria in adolescents and the value of additional cannabis use indicators. Addiction. 2011;106(6):1137-1145. doi: 10.1111/j.1360-0443.2010.03359.x [DOI] [PubMed] [Google Scholar]
- 52.Saha TD, Compton WM, Chou SP, et al. Analyses related to the development of DSM-5 criteria for substance use related disorders: 1. toward amphetamine, cocaine and prescription drug use disorder continua using item response theory. Drug Alcohol Depend. 2012;122(1-2):38-46. doi: 10.1016/j.drugalcdep.2011.09.004 [DOI] [PMC free article] [PubMed] [Google Scholar]
- 53.Wu LT, Woody GE, Yang C, Pan JJ, Reeve BB, Blazer DG. A dimensional approach to understanding severity estimates and risk correlates of marijuana abuse and dependence in adults. Int J Methods Psychiatr Res. 2012;21(2):117-133. doi: 10.1002/mpr.1354 [DOI] [PMC free article] [PubMed] [Google Scholar]
- 54.Castaldelli-Maia JM, Andrade LH, Keyes KM, Cerdá M, Pilowsky DJ, Martins SS. Exploring the latent trait of opioid use disorder criteria among frequent nonmedical prescription opioid users. J Psychiatr Res. 2016;80:79-86. doi: 10.1016/j.jpsychires.2016.05.007 [DOI] [PMC free article] [PubMed] [Google Scholar]
- 55.Tarrahi MJ, Rahimi-Movaghar A, Zeraati H, et al. Latent class analysis of DSM-5 criteria for opioid use disorders: results from the Iranian National Survey on Mental Health. Eur Addict Res. 2015;21(3):144-152. doi: 10.1159/000369338 [DOI] [PubMed] [Google Scholar]
- 56.Wu LT, Pan JJ, Yang C, Reeve BB, Blazer DG. An item response theory analysis of DSM-IV criteria for hallucinogen abuse and dependence in adolescents. Addict Behav. 2010;35(3):273-277. doi: 10.1016/j.addbeh.2009.10.009 [DOI] [PMC free article] [PubMed] [Google Scholar]
- 57.Kerridge BT, Saha TD, Smith S, et al. Dimensionality of hallucinogen and inhalant/solvent abuse and dependence criteria: implications for the Diagnostic and Statistical Manual of Mental Disorders Fifth Edition. Addict Behav. 2011;36(9):912-918. doi: 10.1016/j.addbeh.2011.04.006 [DOI] [PMC free article] [PubMed] [Google Scholar]
- 58.Kirisci L, Tarter RE, Reynolds M, Vanyukov MM. Item response theory analysis to assess dimensionality of substance use disorder abuse and dependence symptoms. Int J Pers Cent Med. 2016;6(4):260-273. [PMC free article] [PubMed] [Google Scholar]
- 59.Perron BE, Vaughn MG, Howard MO, Bohnert A, Guerrero E. Item response theory analysis of DSM-IV criteria for inhalant-use disorders in adolescents. J Stud Alcohol Drugs. 2010;71(4):607-614. doi: 10.15288/jsad.2010.71.607 [DOI] [PMC free article] [PubMed] [Google Scholar]
- 60.Yang H, Chen F, Liu X, Xin T. An item response theory analysis of DSM-5 heroin use disorder in a clinical sample of Chinese adolescents. Front Psychol. 2019;10:2209. doi: 10.3389/fpsyg.2019.02209 [DOI] [PMC free article] [PubMed] [Google Scholar]
- 61.Hartman CA, Gelhorn H, Crowley TJ, et al. Item response theory analysis of DSM-IV cannabis abuse and dependence criteria in adolescents. J Am Acad Child Adolesc Psychiatry. 2008;47(2):165-173. doi: 10.1097/chi.0b013e31815cd9f2 [DOI] [PMC free article] [PubMed] [Google Scholar]
- 62.Martin CS, Chung T, Kirisci L, Langenbucher JW. Item response theory analysis of diagnostic criteria for alcohol and cannabis use disorders in adolescents: implications for DSM-V. J Abnorm Psychol. 2006;115(4):807-814. doi: 10.1037/0021-843X.115.4.807 [DOI] [PubMed] [Google Scholar]
- 63.Duresso SW, Matthews AJ, Ferguson SG, Bruno R. Is khat use disorder a valid diagnostic entity? Addiction. 2016;111(9):1666-1676. doi: 10.1111/add.13421 [DOI] [PubMed] [Google Scholar]
- 64.Gilder DA, Gizer IR, Lau P, Ehlers CL. Item response theory analyses of DSM-IV and DSM-5 stimulant use disorder criteria in an American Indian community sample. Drug Alcohol Depend. 2014;135:29-36. doi: 10.1016/j.drugalcdep.2013.10.010 [DOI] [PMC free article] [PubMed] [Google Scholar]
- 65.Kervran C, Shmulewitz D, Serre F, et al. Item response theory analyses of DSM-5 substance use disorder criteria in French outpatient addiction clinic participants: how much is craving special? Drug Alcohol Depend. 2020;212:108036. doi: 10.1016/j.drugalcdep.2020.108036 [DOI] [PubMed] [Google Scholar]
- 66.Wu LT, Blazer DG, Woody GE, et al. Alcohol and drug dependence symptom items as brief screeners for substance use disorders: results from the Clinical Trials Network. J Psychiatr Res. 2012;46(3):360-369. doi: 10.1016/j.jpsychires.2011.12.002 [DOI] [PMC free article] [PubMed] [Google Scholar]
- 67.Wu LT, Pan JJ, Blazer DG, et al. An item response theory modeling of alcohol and marijuana dependences: a National Drug Abuse Treatment Clinical Trials Network study. J Stud Alcohol Drugs. 2009;70(3):414-425. doi: 10.15288/jsad.2009.70.414 [DOI] [PMC free article] [PubMed] [Google Scholar]
- 68.Wu LT, Pan JJ, Blazer DG, et al. The construct and measurement equivalence of cocaine and opioid dependences: a National Drug Abuse Treatment Clinical Trials Network (CTN) study. Drug Alcohol Depend. 2009;103(3):114-123. doi: 10.1016/j.drugalcdep.2009.01.018 [DOI] [PMC free article] [PubMed] [Google Scholar]
- 69.Langenbucher JW, Labouvie E, Martin CS, et al. An application of item response theory analysis to alcohol, cannabis, and cocaine criteria in DSM-IV. J Abnorm Psychol. 2004;113(1):72-80. doi: 10.1037/0021-843X.113.1.72 [DOI] [PubMed] [Google Scholar]
- 70.Hasin DS, Fenton MC, Beseler C, Park JY, Wall MM. Analyses related to the development of DSM-5 criteria for substance use related disorders: 2. proposed DSM-5 criteria for alcohol, cannabis, cocaine and heroin disorders in 663 substance abuse patients. Drug Alcohol Depend. 2012;122(1-2):28-37. doi: 10.1016/j.drugalcdep.2011.09.005 [DOI] [PMC free article] [PubMed] [Google Scholar]
- 71.Watts AL, Boness CL, Loeffelman JE, Steinley D, Sher KJ. Does crude measurement contribute to observed unidimensionality of psychological constructs? a demonstration with DSM-5 alcohol use disorder. J Abnorm Psychol. 2021;130(5):512-524. doi: 10.1037/abn0000678 [DOI] [PMC free article] [PubMed] [Google Scholar]
- 72.Tiet QQ, Finney JW, Moos RH. Screening psychiatric patients for illicit drug use disorders and problems. Clin Psychol Rev. 2008;28(4):578-591. doi: 10.1016/j.cpr.2007.08.002 [DOI] [PubMed] [Google Scholar]
- 73.Yang FM, Kao ST. Item response theory for measurement validity. Shanghai Arch Psychiatry. 2014;26(3):171-177. [DOI] [PMC free article] [PubMed] [Google Scholar]
- 74.Flora DB, Curran PJ. An empirical evaluation of alternative methods of estimation for confirmatory factor analysis with ordinal data. Psychol Methods. 2004;9(4):466-491. doi: 10.1037/1082-989X.9.4.466 [DOI] [PMC free article] [PubMed] [Google Scholar]
Associated Data
This section collects any data citations, data availability statements, or supplementary materials included in this article.
Supplementary Materials
eFigure 1. Routine Behavioral Health Screen With Single Items for Cannabis and Other Drugs
eFigure 2. The Substance Use Symptom Checklist (Symptom Checklist): A DSM-5 SUD Symptom Assessment Tool
eAppendix 1. Detailed Description of Item Characteristics
eAppendix 2. Detailed Description of Differential Item Functioning (DIF) Analyses
eAppendix 3. DIF Findings for Patients Who Reported Daily Cannabis Use Only
eAppendix 4. DIF Findings for Patients Who Reported Other Drug Use Only
eAppendix 5. DIF Findings for Patients Who Reported Both Daily Cannabis and Other Drug Use
eAppendix 6. Detailed Description of the Clinical Impact DIF Has on Estimated SUD Severity
eAppendix 7. R Code for IRT and DIF Analyses
eReferences.
Data Sharing Statement