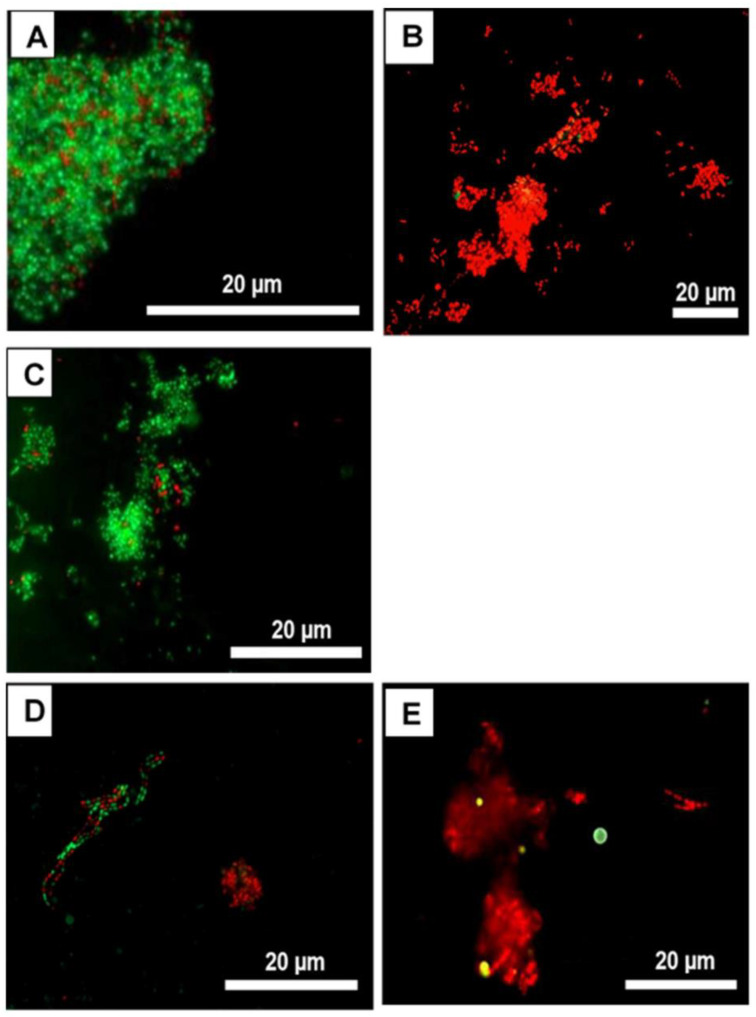
Figure 8.
Live/dead bacLight® fluorescent microscopy images. Avital fluoresces are in red, while vital bacteria are in green. (A) NaCl treatment as negative control, (B) CHX treatment as positive control, and (C) DMSO treatment as toxicity control, I. viscosa groups in concentrations: 10 mg/mL (D) and 30 mg/mL (E) [283].

