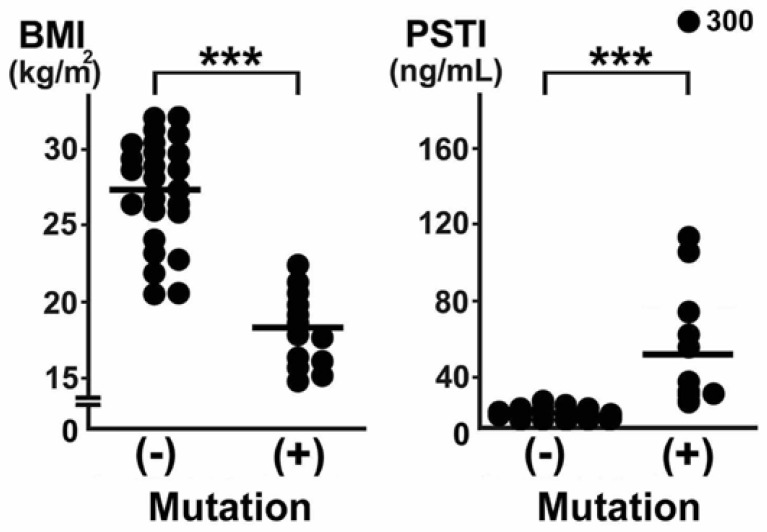
Figure 2.
Comparison of BMI and serum PSTI between fatty liver patients without (−) and with (+) SLC25A13 gene mutations. (−), conventional NAFLD/NASH; (+), CD-associated fatty liver disease. Each value is plotted, and median values are indicated in the lines. The cut-off values of BMI and serum PSTI were calculated as 20 kg/m2 and 29 ng/mL, respectively. ***, p < 0.001. This figure is reprinted/adapted with permission from Ref. [26]. 2008 European Association for the Study of the Liver. Published by Elsevier Ireland Ltd. All rights reserved.

