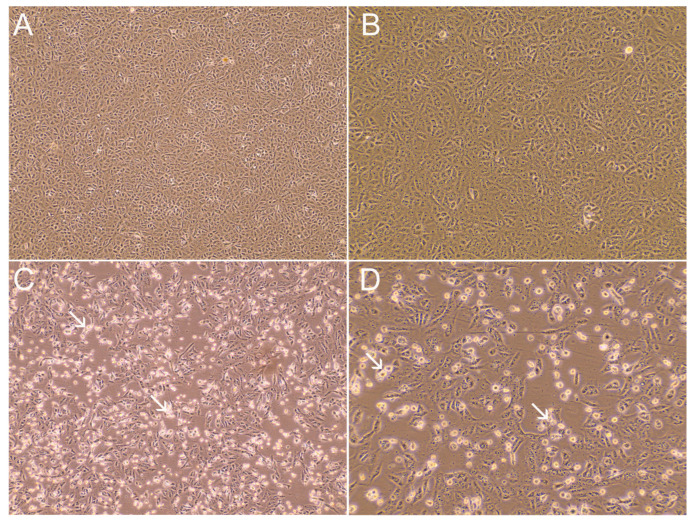
Figure 3.
SARS-CoV-2 cytopathic effect (CPE) in Vero cells observed following virus infection MOI 0.02 at 48 hpi. (A) Mock-infected Vero cells. (B) Positive rectal swab without visible CPE (sample id_31386). (C) Positive rectal swab sample with CPE (sample id_30771). (D) SARS-CoV-2 passage 2 from sample id_30771. Representative areas of CPE are indicated by white arrows. Panels (A,C) are shown with 100× magnification; panels (B,D) are shown with 200× magnification.

