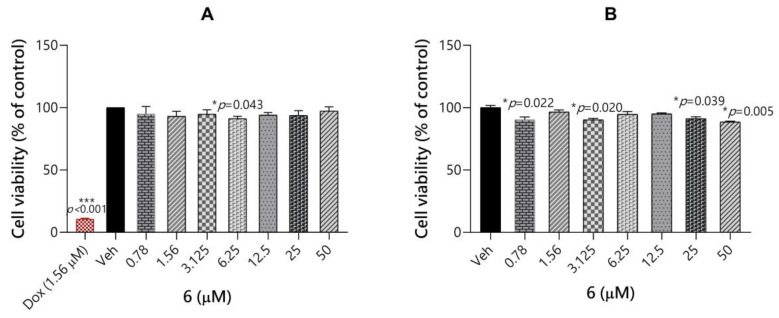
Figure 6.
Toxicity evaluation of compound 6 and cytostatic drug doxorubicin (Dox) in HepG2 (A) and SH-SY5Y cells (B). Each point represents the mean ± SEM of two independent experiments, each of which consisted of three replicates per treatment group. Statistical analyses were performed using GraphPad Prism software 8.0. Statistical significance was evaluated by one-way ANOVA with post-hoc Dunnett test at significance level α = 0.05; p-values are detailed in the figure.

