Figure 3.
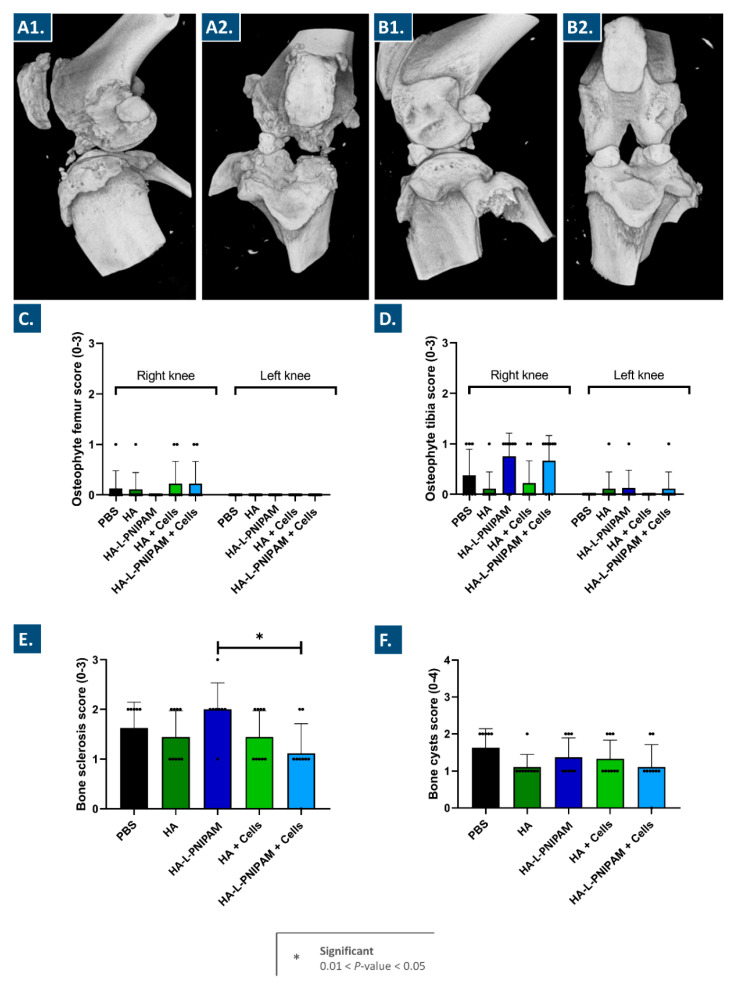
Illustrative 3D CT images of right knees (i.e., operated joints) (A1,A2) and left knees (i.e., non-operated joints) (B1,B2) from one animal of the treatment control group. Micro-CT images were blindly scored to evaluate osteophyte presence in the femur from right and left knees (C), osteophyte presence in the tibia from right and left knees (D), subchondral bone sclerosis in right knees (E), and bone cyst presence in right knees (F). Dot symbols represent individual scores per animal. Results are expressed as means with standard deviations as error bars for eight or nine animals per group. Significant statistical differences (i.e., * or 0.01 < p-value < 0.05) were found between presented mean values. HA, hyaluronic acid; PNIPAM, poly(N-isopropylacrylamide).

