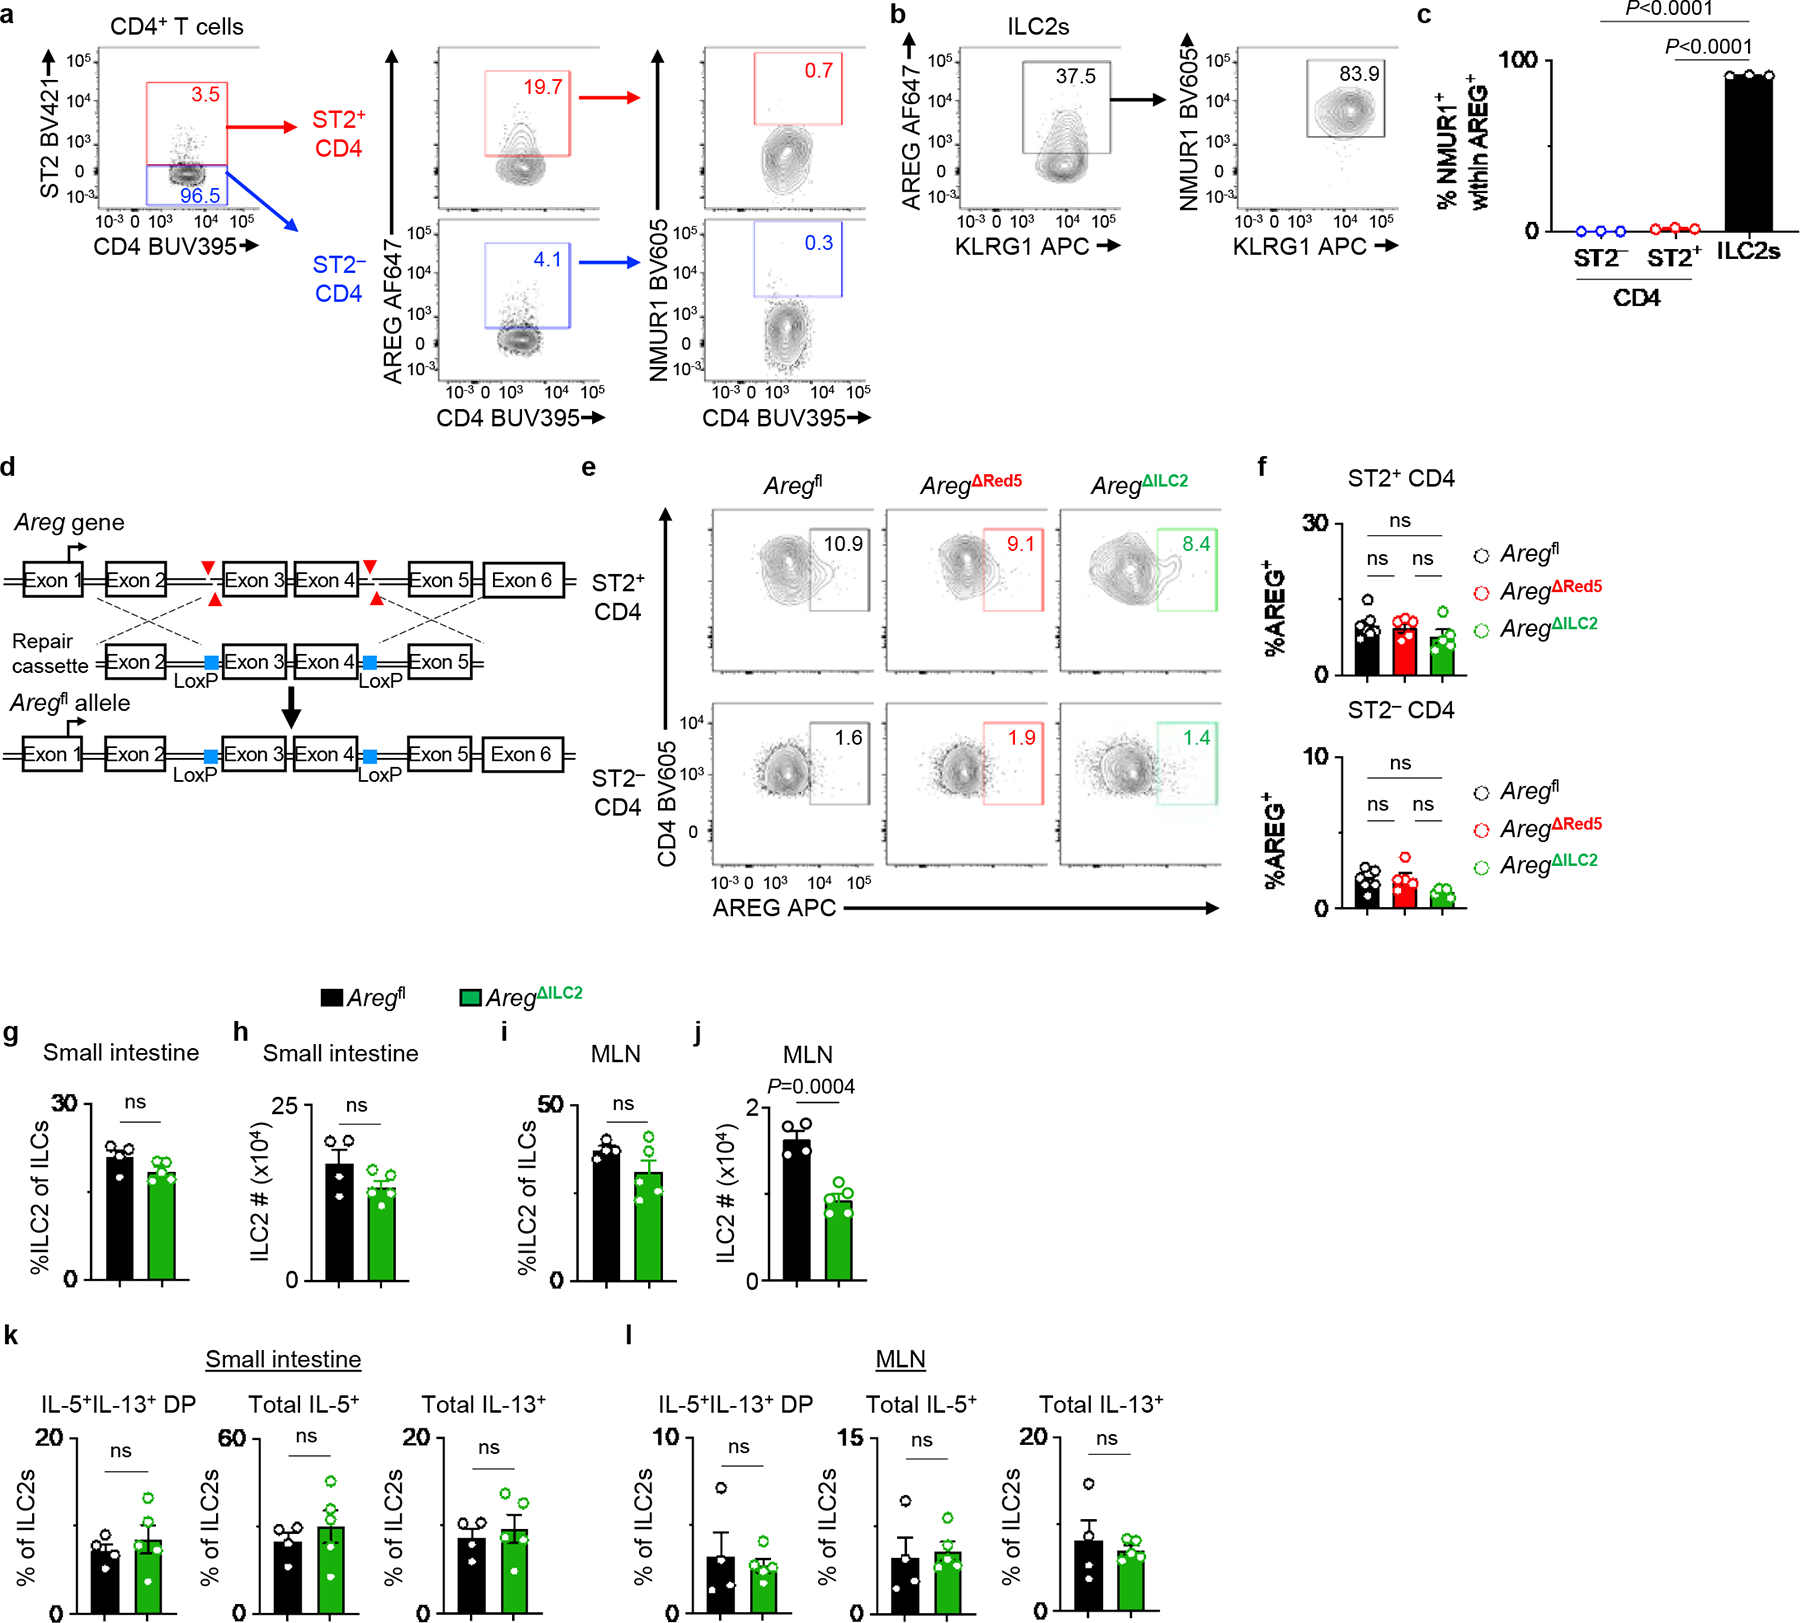
Extended Data Figure 4 |. Nmur1iCre-eGFP-mediated AREG deletion does not impact AREG production in CD4+ T cells or intrinsic ILC2 homeostasis.

a-c, Representative flow cytometry analysis of AREG and NMUR1 co-expression within ST2− and ST2+ CD4+ T cells (a) and ILC2s (b) at steady state in the MLN of WT mice. Percentages of NMUR1+ cells within AREG-producing cells isolated from WT mice (n=3 mice) (c). d, Schematic of Aregfl mouse generation using CRISPR/Cas9n. e, f, Representative flow cytometry analysis of ST2− and ST2+ CD4+ T cells (e) and percentages of AREG-producing cells (f) in the MLN of Aregfl (n=7 mice), AregΔRed5 (n=5 mice), and AregΔILC2 (n=5 mice). g-l, Small intestine and MLN from Aregfl (n=4 mice) and AregΔILC2 (n=5 mice) were analyzed at steady state for ILC2 abundance and their cytokine production capacity. Percentages of ILC2s within total ILCs in the small intestine (g) and MLN (i). Absolute cell numbers of ILC2s in the small intestine (h) and MLN (j). Percentages of IL-5+IL-13+ DP, total IL-5+ and total IL-13+ ILC2s isolated from the small intestine (k) and MLN (l). Data in c, f, g-l are representative of two independent experiments. One-way ANOVA with Tukey multiple comparisons test (c, f). Unpaired two-sided t-test (g-l). P values are presented where appropriate. ns, not significant. Data are represented as means ± S.E.M. MLN – mesenteric lymph node. DP – double positive.
