Abstract
Objective:
In MRI-based radiation therapy planning, mitigating patient-specific distortion with standard high bandwidth scans can result in unnecessary sacrifices of signal to noise ratio (SNR). This study investigates a technique for distortion detection and mitigation on a patient specific basis.
Approach:
Fast B0 mapping was performed using a previously developed technique for high-resolution, large dynamic range field mapping without the need for phase unwrapping algorithms. A phantom study was performed to validate the method. Distortion mitigation was validated by reducing geometric distortion with increased acquisition bandwidth (BW) and confirmed by both the B0 mapping technique and manual measurements. Images and contours from 25 brain stereotactic radiosurgery (SRS) patients and 95 targets were analyzed to estimate the range of geometric distortions expected in the brain and to estimate bandwidth required to keep all treatment targets within the ± 0.5 mm iso-distortion contour.
Main Results:
The phantom study showed, at 3T, the technique can measure distortions with a mean absolute error of 0.12 mm (0.18 ppm), and a maximum error of 0.37 mm (0.6 ppm). For image acquisition at 3T and 1.0 mm resolution, mean absolute distortion under 0.5 mm in patients required bandwidths from 109 to 200 Hz/px for patients with the least and most distortion, respectively. Maximum absolute distortion under 0.5 mm required bandwidths from 120 to 390 Hz/px.
Significance:
The method for B0 mapping was shown to be valid and may be applied to assess distortion clinically. Future work will adapt the readout bandwidth to prospectively mitigate distortion with the goal to improve radiosurgery treatment outcomes by reducing healthy tissue exposure.
1. Introduction
Magnetic resonance imaging (MRI) is used routinely in radiation therapy (RT) for delineating treatment targets [1], [2] and organs at risk (OARS) [3], [4]. Unfortunately, geometric distortion, commonly seen in MRI scans, may cause clinically relevant uncertainties in the transfer of information between MR and computed tomography (CT) reference frames [5]–[7]. Geometric distortions are of particular concern for stereotactic radiosurgery, which uses high doses of radiation in a single treatment with a steep gradient beyond the target with little to no planning target volume (PTV) margin to account for uncertainties. Accordingly, even small errors relating to the accuracy of radiation delivery can translate to a local recurrence for which salvage options are typically limited. There are several common sources of MR geometric distortion including residual uncorrected gradient non-linearities [7], chemical shift artifacts [8], and static magnetic field (B0) inhomogeneities caused by system imperfections [9] and local susceptibility variations. While MRI gradient non-linearities and chemical shift may be estimated a priori, B0-inhomogeneities would, ideally, be measured and accounted for on a patient-specific basis because local susceptibility distributions are patient dependent. This paper focuses on a method for the detection and mitigation of patient specific B0 field inhomogeneity-induced geometric distortion.
The most straightforward method for reducing B0 inhomogeneity-induced distortion is to increase pixel bandwidth (BW) [10], resulting in a proportionate reduction in these types of distortions. Unfortunately, increasing BW causes a reduction in signal to noise ratio (SNR) proportional to the BW increase, which may obscure target or OAR boundaries due to lower contrast to noise ratio (CNR). Once CNR has dropped below a value of 3 – 5 as given by the Rose Criterion [11], the ability to detect an object becomes compromised. SNR may be recovered by increasing the number of signal averages, at the cost of increasing imaging time. As SNR increases at the square root of scan time, the trade-off between distortions and SNR may quickly become untenable for patient scans. Thus, the aim of most MR protocols is to find an optimal tradeoff between geometric distortion and imaging time as recommended in American Association of Physicists in Medicine (AAPM) Task Group 284 [12]. This process involves selecting the maximum acceptable image distortion based on the treatment type and estimating the B0 inhomogeneity for the body site of interest. For example, Stanescu et. al. numerically estimated B0 inhomogeneity at several body sites and validated these simulations against phantom measurements [13], allowing for bandwidths to be recommended for each body site. Such theoretical estimations, however, are based on anticipated B0 variations for a large area, which may be inaccurate or not directly relevant to the treatment target. Alternatively, since B0 inhomogeneity is a patient specific phenomenon, the issue may be better addressed with patient specific solutions.
Several patient specific B0 inhomogeneity estimation techniques have been characterized previously. In the works of Wang et. al. and Tyagi et. al., a dual-echo gradient echo pulse sequence was used to detect phase evolution within individual patients [6], [14]. Dual echo techniques, such as these, generally require complex phase unwrapping algorithms to resolve true B0 values, which are potentially unreliable at discontinuities. Matakos et. al. used a fast 3-echo sequence to map the B0 field that could be acquired during a single breath hold [15]. In their work, two of the three echoes need to be narrowly spaced to provide a wrap-free phase image, which was used as the initial guess in an iterative phase unwrapping algorithm [16]. The dynamic range of reliable B0 estimation was thus limited by the shortest echo spacing achievable with the sequence, and the spatial-smoothness constraints used in the iterative algorithm reduces the resolution of the B0 maps. Other techniques involve collecting two full images with opposed read-out gradients [17]–[21] to remove B0 inhomogeneity distortion. These techniques require doubling the acquisition time and have the potential to increase uncertainty in target boundary identification. In this study, a previously proposed method [22], [23] was used that measures the B0 field inhomogeneity over a wide dynamic range without the need for phase unwrapping. A phantom study of the B0 field inhomogeneity estimation process was performed and target position distortions were evaluated from a cohort of 25 stereotactic radiosurgery patients. These data were also used to explore a distortion mitigation workflow involving measurement of the distortion caused by B0 inhomogeneity and adjusting the MR readout BW to set all treatment targets to be within a tolerable distortion limit. With this patient specific method, the optimal trade-off between SNR and geometric distortion may be achieved for all treatment targets.
2. Methods
2.1. MRI Pulse sequences and processing
All MRI imaging was performed on a 3T MRI scanner (MAGNETOM Vida, Siemens Healthcare, Erlangen, Germany) with software version syngo MR XA20A. A clinically implemented magnetization-prepared rapid gradient-echo (MPRAGE) sequence was acquired in all phantom and patient studies (details listed in table 1). Phantom scans included a repetition of this sequence with BW 500 Hz/px. For all images used in this study, standard 3D gradient non-linearity distortion correction was applied.
Table 1.
Acquisition parameters for each of the pulse sequences used in this study. For MPRAGE images, phantom studies used both 210 and 500 Hz/px bandwidth while patient studies used only 210 Hz/px.
| Sequence | MPRAGE | B0 Mapping |
|---|---|---|
| Axial voxel size (mm) | 0.97 | 2.3 |
| Slice Thickness (mm) | 1 | 3 |
| Field of View (mm) | 250×250×176 | 300×300×270 |
| TE (ms) | 3.71 | 2.44, 4.66, 7.16 |
| TR (ms) | 1980 | 10 |
| Flip Angle (deg) | 9 | 15 |
| BW (Hz/pixel) | 210 | 880 |
| Grappa factor | 2 | 2 |
| Acquisition Time (s) | 150 | 60 |
Inhomogeneity-induced off-resonance frequency (ΔB0) maps were measured using a standard 3D three-echo GRE sequence (details listed in table 1). A prototype algorithm for ΔB0 estimation was used. Details of the method were previously described in [22] and [23]. Briefly, the technique optimizes echo times of a standard three-echo GRE sequence, such that the error distributions from each pair of echoes are maximally distinct and that the overlap of the distributions can be used to identify the real frequency offset value. No post-process phase unwrapping or spatial-smoothness constraints were used. Frequency offsets in fat-dominated regions were also corrected in this algorithm [24]. Pixels with signal magnitude below 5% of maximum were excluded and bilinear interpolation was performed to fill in gaps in the ΔB0 map. The resulting ΔB0 map was stored as a DICOM image and served as the basis of the geometric distortion calculation:
| (1) |
where pixel BW and pixel size were the sequence parameters used in the post contrast MPRAGE scan, 210 Hz/px and 0.97 mm, respectively. ΔB0-induced spatial distortion was in the readout direction, which corresponded to the left-right direction in the patient reference frame.
2.2. Phantom study - ΔB0 Map Validation
The spatial distortion estimation process described above was validated in a phantom. The test object used was the Magphan RT 820 (Phantom Lab, Salem, NY), which contains 513 spherical fiducials each 1 cm in diameter, placed at specified locations throughout a 35 × 27 × 21 cm3 volume. The center of the symmetric fiducials within the phantom can be located within an image with sub-voxel accuracy to within approximately one tenth the voxel size [25], [26].
After placement of the Magphan at magnet isocenter, an MPRAGE scan was performed using standard 2nd-order shimming and the clinical sequence parameters listed in Table 1. This MPRAGE scan, noted as MR_ref, was used as the reference for fiducial locations. A linearly varying B0 field was then created by changing one of the shim gradients. A ΔB0 scan, an MPRAGE scan with BW set to 210 Hz/px (MR_dist), and finally an MPRAGE scan with BW set to 500 Hz/px (MR_dist500) were acquired. The BW of 210 Hz/px matched the clinical protocol, and the BW of 500 Hz/px was selected for comparison. In summary, the imaging steps in this phantom experiment were:
Standard 2nd-order object specific shim measured and applied
MPRAGE scan with BW = 210 Hz/px (MR_ref)
Custom shim applied (causes distortion in one direction)
ΔB0 mapping scan (measures distortion)
MPRAGE with BW = 210 Hz/px (MR_dist)
MPRAGE with BW = 500 Hz/px (MR_dist500)
The same experiment was repeated 3 times with different custom shim settings. The purpose was to create three kinds of ΔB0 field distributions having linear variation in the right-left direction, anterior-posterior direction and superior-inferior direction, respectively. These ΔB0 field distributions were achieved by manually adjusting the shim settings.
Distortion was evaluated by two methods to compare their results. First, the ΔB0 mapping scan estimated the B0 inhomogeneity-induced distortion at each voxel in the image using equation 1. Second, distortion was estimated by manually locating 31 corresponding fiducial centroids in the MR_ref and MR_dist images using MIM Software (MIM Software Inc, Cleveland, OH). Sub-voxel accuracy was achieved in these manual measurements by fitting a sphere to the surface of the imaged fiducial and using the center of the sphere as the fiducial centroid position. Distortion was calculated as the distance between the centroids in these two images. To validate that changing BW predictably impacts distortion, the sphere centroid positions were also compared between MR_ref and MR_dist500 using the same method described above.
2.3. Patient Study
The B0 mapping scan used in this study employed an FDA approved multi-echo gradient echo sequence and was included as a standard sequence in our clinical MRI imaging protocol. The retrospective study presented here was performed under institutional review board approval, protocol #2020P001557. Images from 25 consecutive patients simulated for single fraction, stereotactic radiosurgery were evaluated between December 2020 and March 2021. Between the 25 patients, 95 treatment targets were evaluated. All targets were treated to 20Gy using 1mm PTV margins.
Patients were immobilized with the QFix Encompass system (QFix, Avondale, PA) and two 18 channel Siemens Ultraflex MR coils were mounted surrounding the mask. The patient setup and imaging protocol was previously optimized for maximizing image quality while keeping the patient immobilized in the treatment position. Patients were scanned with the standard clinical protocol which included a post-contrast MPRAGE image, immediately followed by a ΔB0 mapping scan (parameters for both are listed in Table 1). No separate shim procedure was performed in between to ensure the MPRAGE and B0 mapping scan were under the same shimming condition. Gross tumor volumes (GTV) were contoured by an attending physician on the MPRAGE image and these GTV contours were transferred onto the ΔB0 mapping scan using MIM Software. It was assumed that there was negligible patient motion between the MPRAGE and ΔB0 mapping scan since these scans were spaced close together in time and the patient was well immobilized. This assumption was validated by comparing the outer body contour of the MPRAGE and ΔB0 mapping scan and determined to be matched to within 1 mm for all cases.
All ΔB0 values within each of the treatment targets were accumulated and evaluated with respect to each patient and with respect to each target using inhouse software developed in Python. The corresponding distortions were calculated based on the ΔB0 values within each target using equation 1. Finally, the required BW to achieve 0.5 mm distortion for each target was computed by rearranging equation 1 as suggested by TG 284 [12]:
| (2) |
The above procedure computed a patient-specific BW that allows all treatment targets to fall within the 0.5 mm iso-distortion contour.
3. Results
3.1. Phantom Study
The reference MR image acquired after the standard 2nd order shimming process is shown in Figure 1(a). This image was then intentionally distorted with a customized shim and a B0 mapping scan was acquired, shown in Figure 1(b), where a ΔB0 distribution ranging from −500 to 500 Hz was detected without any visible phase-wrap artifact. With the custom shim preserved, two new MPRAGE images were acquired, MR_dist and MR_dist500, with BW of 210 and 500 Hz/px, respectively. These images are shown subtracted from MR_ref in Figure 1(c) and (d). The difference between MR_ref and MR_dist is greater near the left and right edges of the images where the custom shim caused larger geometric distortion. Note that, as expected, the difference between MR_ref and MR_dist (Figure 1(c)) is larger than the difference between MR_ref and MR_dist500 (Figure 1(d)). Figure 1(e) shows one sphere within the phantom in the MR_ref image. The pink, yellow and blue crosses represent the centroids of the sphere in the MR_ref, MR_dist500, and MR_dist images. The shift of the sphere centroids in the MR_dist and MR_dist500 images should be predictable using the ΔB0 map shown in Figure 1(b). A comparison of sphere displacement estimated using the ΔB0 map and using the manual method is shown in Figure 2.
Figure 1.
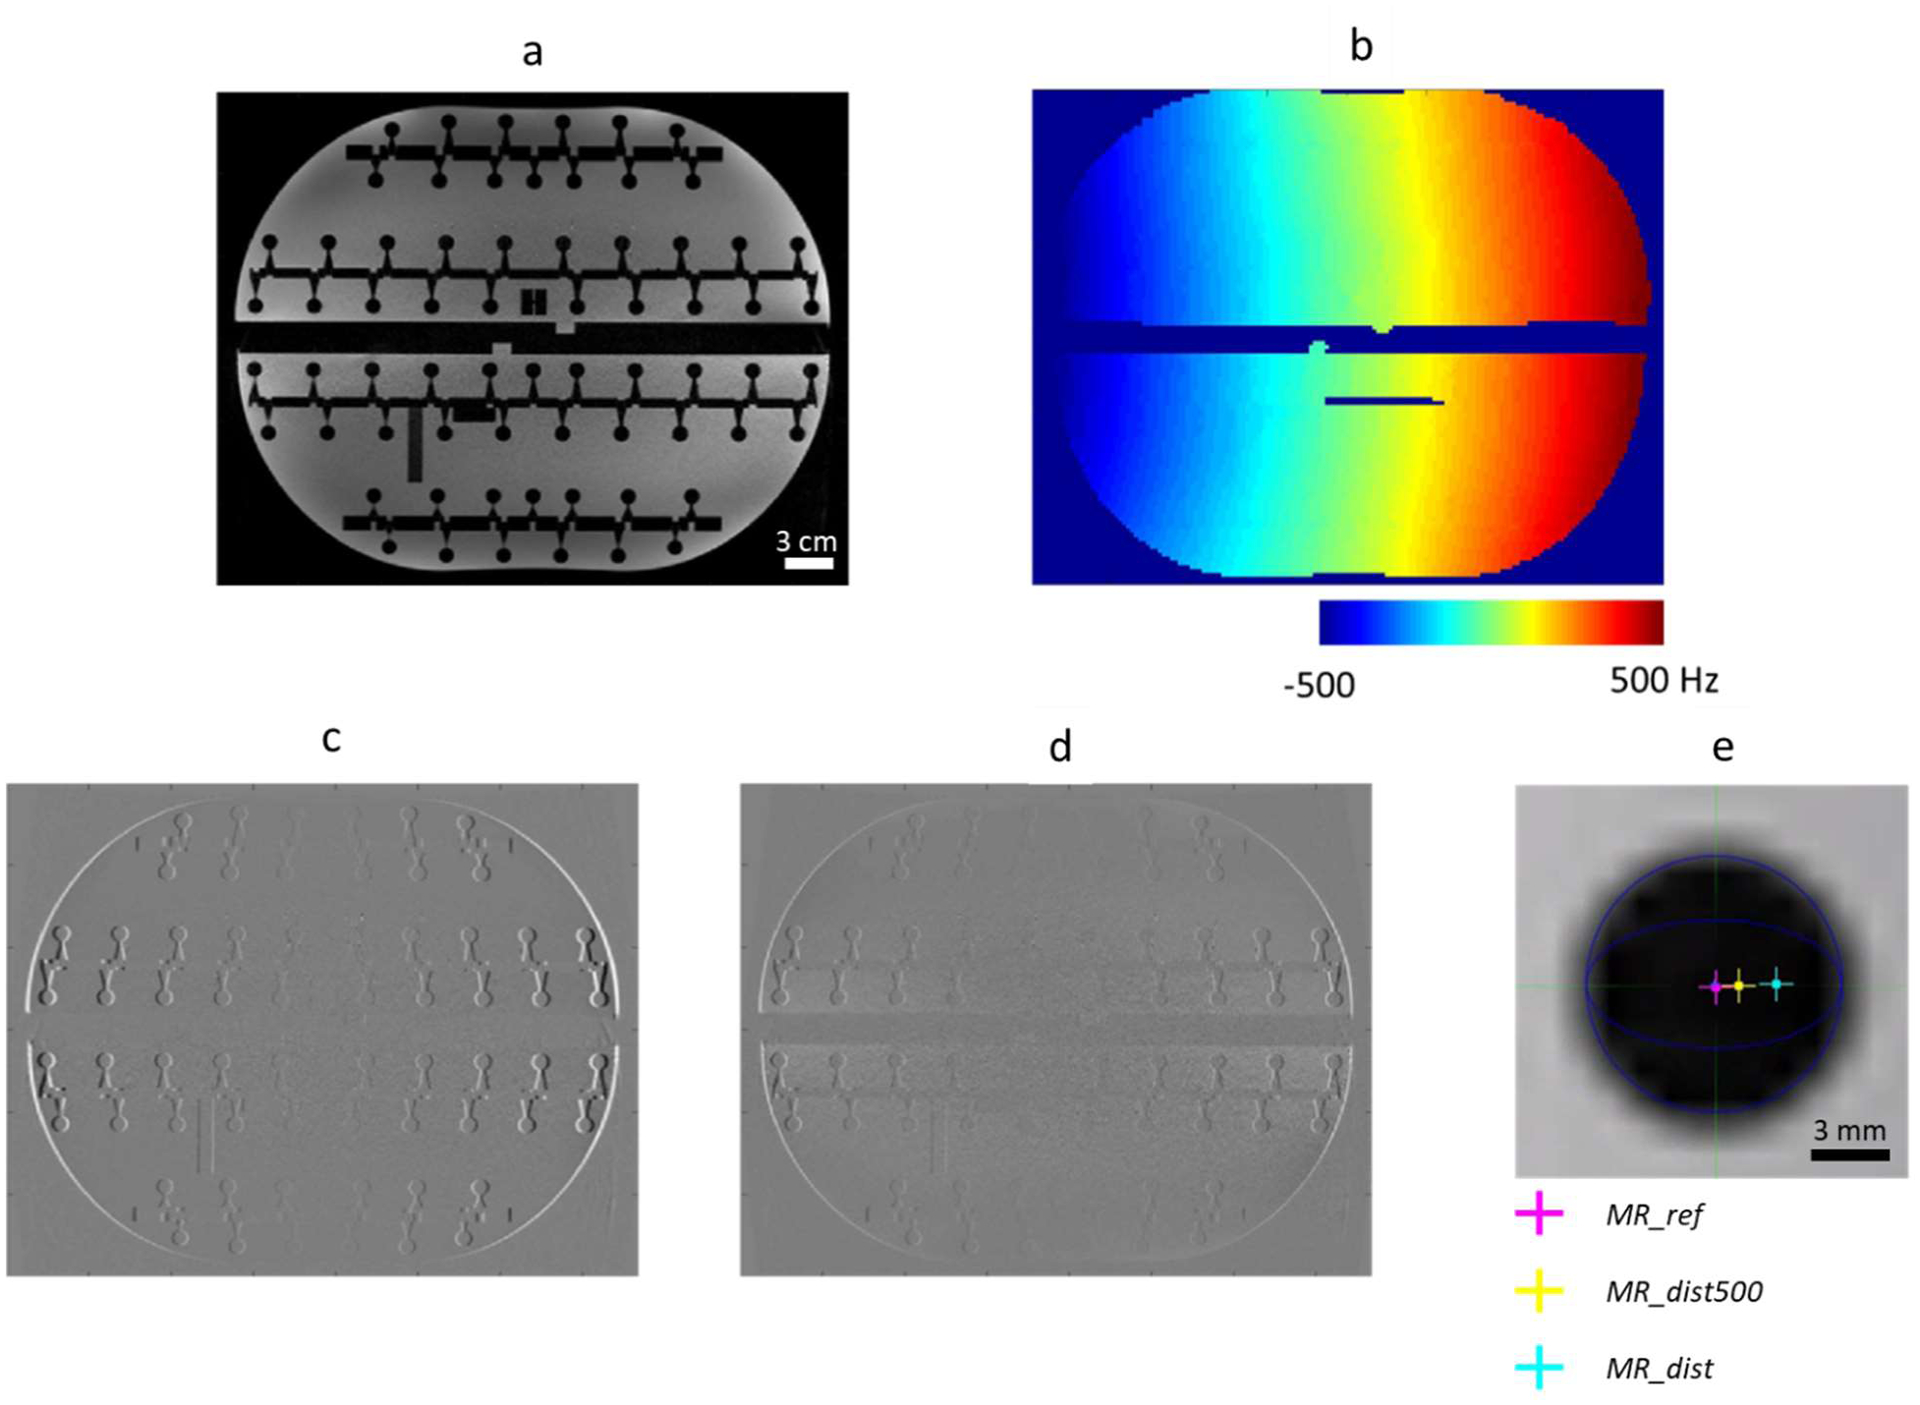
Phantom experiment. An MPRAGE scan (noted as MR_ref) was performed using standard 2nd-order shimming (a). By changing the shim gradients, an inhomogeneous B0 field was created and preserved for three scans: a B0 mapping scan (b), and two MPRAGE scans, one with BW = 210 Hz/px (noted as MR_dist) and one with BW = 500 Hz/px (MR_dist500). ΔB0-induced distortions in these two MPRAGE scans can be seen from the subtraction images: (c) “MR_ref - MR_dist” and (d) “MR_ref - MR_dist500”. Manual localization of spherical structures was performed to provide reference distortion values (e). Scale bar in a = 3 cm and in e = 3 mm.
Figure 2.
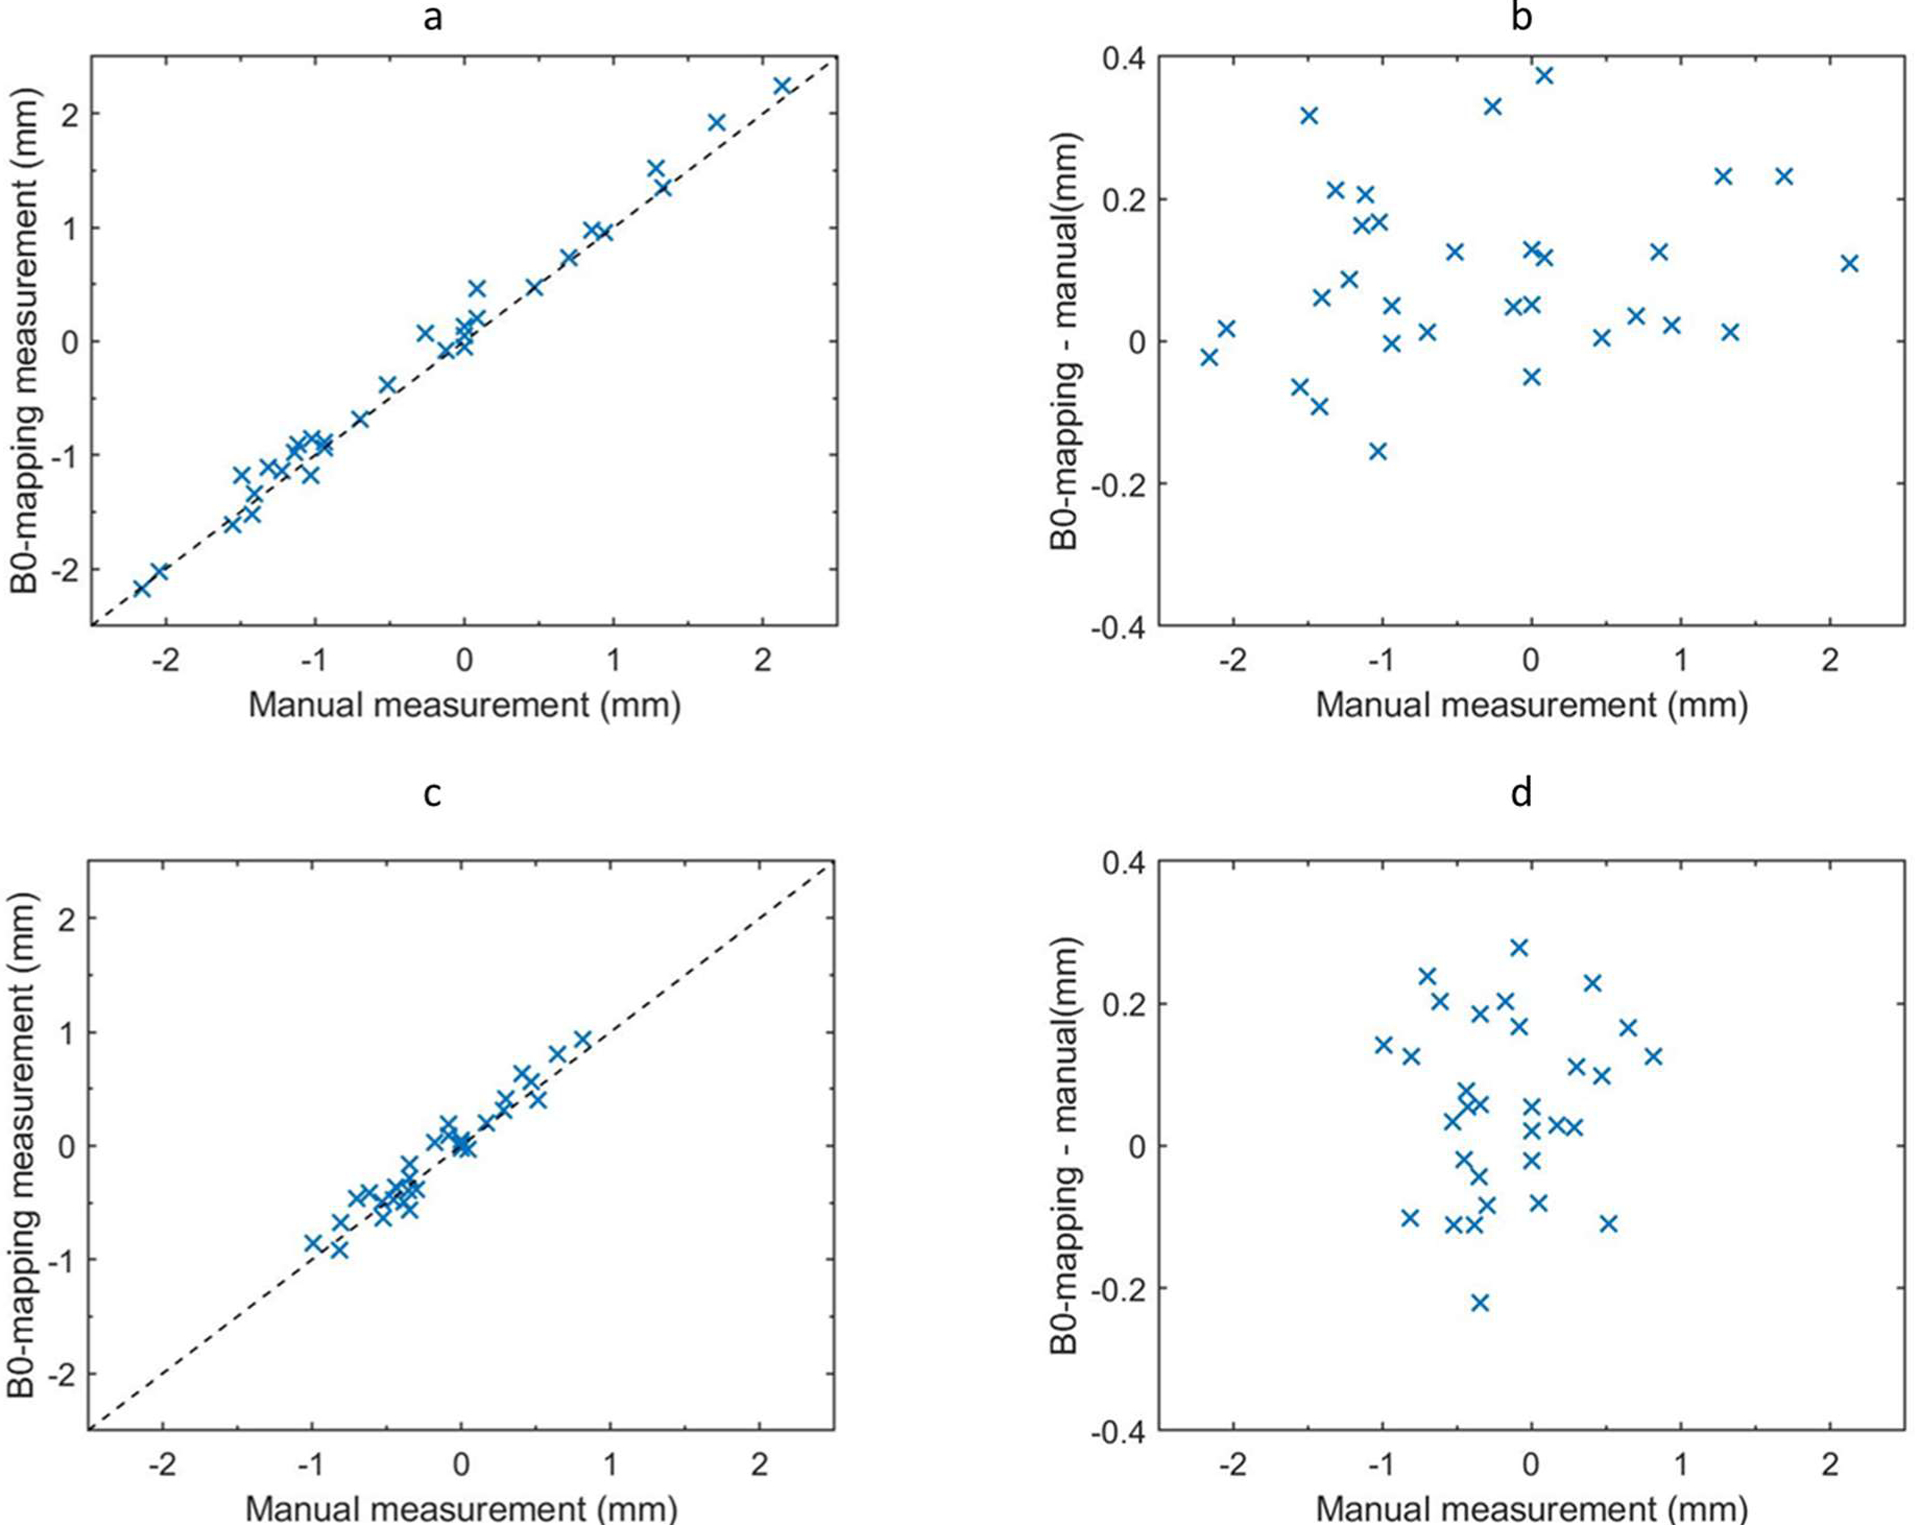
Comparison of B0-mapping based distortion measurement with manual measurement in MR_dist (a, b) and MR_dist500 (c, d). Distortion values measured from the ΔB0 map were plotted against the reference provided by manual localization (a, c). The dashed line is the identity line. The difference between B0-based and reference distortion was also plotted (b, d). Each x represents one of N = 31 fiducials.
Figure 2(a) shows the distortion in the position of the sphere centroids, estimated by the ΔB0 scan, in relation to the sphere centroid distortion manually measured in the MR_dist image. These measurements correlate well with each other with an R-squared value of 0.99, residual mean absolute error (MAE) of 0.12 mm (0.18 ppm), and a maximum of 0.37 mm (0.6 ppm) as shown in Figure 2(b). Similar measurements in the MR_dist500 image resulted in an R-squared value of 0.93, residual MAE of 0.11 mm (0.18 ppm), with a maximum of 0.28 mm (0.45 ppm) as shown in Figure 2(c) and (d). This experiment demonstrated that the ΔB0 scan reliably predicted distortions at multiple bandwidths. It also showed that sub voxel sized distortions were measurable with this method. Furthermore, this method had a mean absolute variation, over the 31 manual samples, of less than 0.2 mm when the same task was repeated manually by 2 different people.
The bandwidth change from 210 Hz/px to 500 Hz/px should have reduced distortion of each fiducial by 210/500 = 42%. Thus, the distortion measured by the ΔB0 scan at 210 Hz/px, multiplied by 0.42, should equal the manually measured distortion at 500 Hz/px. This is graphically depicted in Figure 3 and was verified to be true to within an MAE of 0.11 mm (0.18 ppm) with an R-squared value of 0.93. This result confirmed that bandwidth increases precisely reduced distortion and that the amount of reduction was accurately estimated using this B0 mapping technique.
Figure 3.
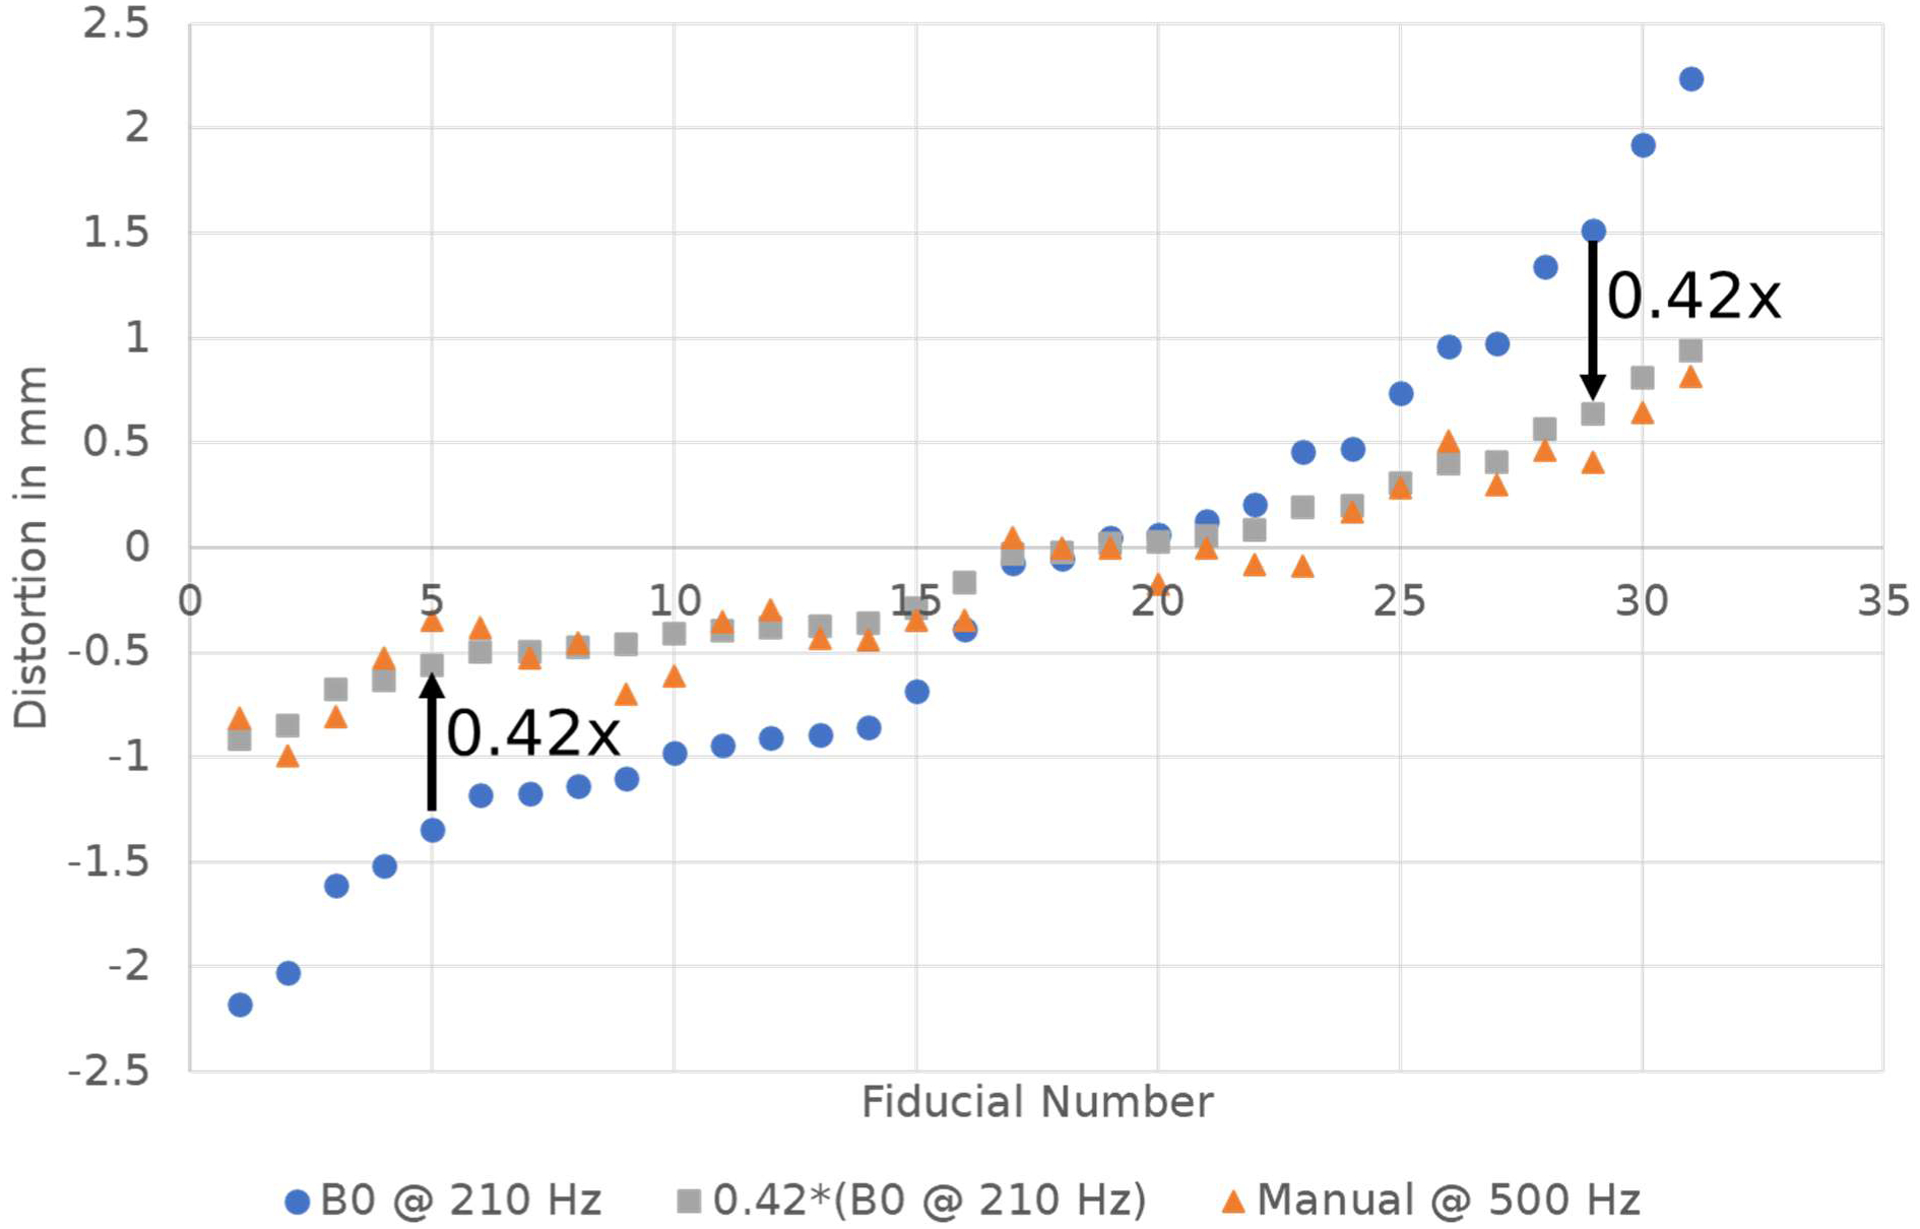
Distortion measured in the phantom using the B0 mapping technique at BW=210 Hz (blue circles), the same curve scaled by 0.42 (grey squares), and the distortion measured manually at BW=500 Hz (orange triangles). This data shows that increasing bandwidth will accurately reduce distortion by a predictable amount.
In addition, the manually measured distortion at 210 Hz/px, multiplied by 0.42, should equal the manually measured distortion at 500 Hz/px. The results confirmed this to within an MAE of 0.08 mm (0.14 ppm) and an R-squared value of 0.95. This effectively compared independent manual position measurements from 2 different images, further validating the accuracy of the manual measurement technique used here.
3.2. Patient Study
Mid-sagittal distortion maps of the brain contour for 9 representative example cases are shown in Figure 4. The color map used shows a gradient between blue and red for voxels with distortions between −0.75 mm and 0.75 mm, respectively. Regions with absolute distortion >0.5 mm are outlined in black. Note the smooth variation in ΔB0 throughout the brain for all cases. Although there are similarities in the distortion patterns, there are also variations between patients. For example, all cases show a region of positive distortion superior to the sinuses and distortions are reduced moving towards the cerebellum. In contrast, some cases contain regions of significant positive distortions in the anterior region of the frontal lobe while some do not, highlighting some patient specific differences. Across these 9 cases, the anterior portion of the frontal lobe shows distortions in the range of less than 0.1 to greater than 0.5 mm. Cases c, d, and f show the largest distortions in portions of the frontal lobe. Overall, case c had larger distortions than the other cases, likely due to this patient’s larger stature.
Figure 4.
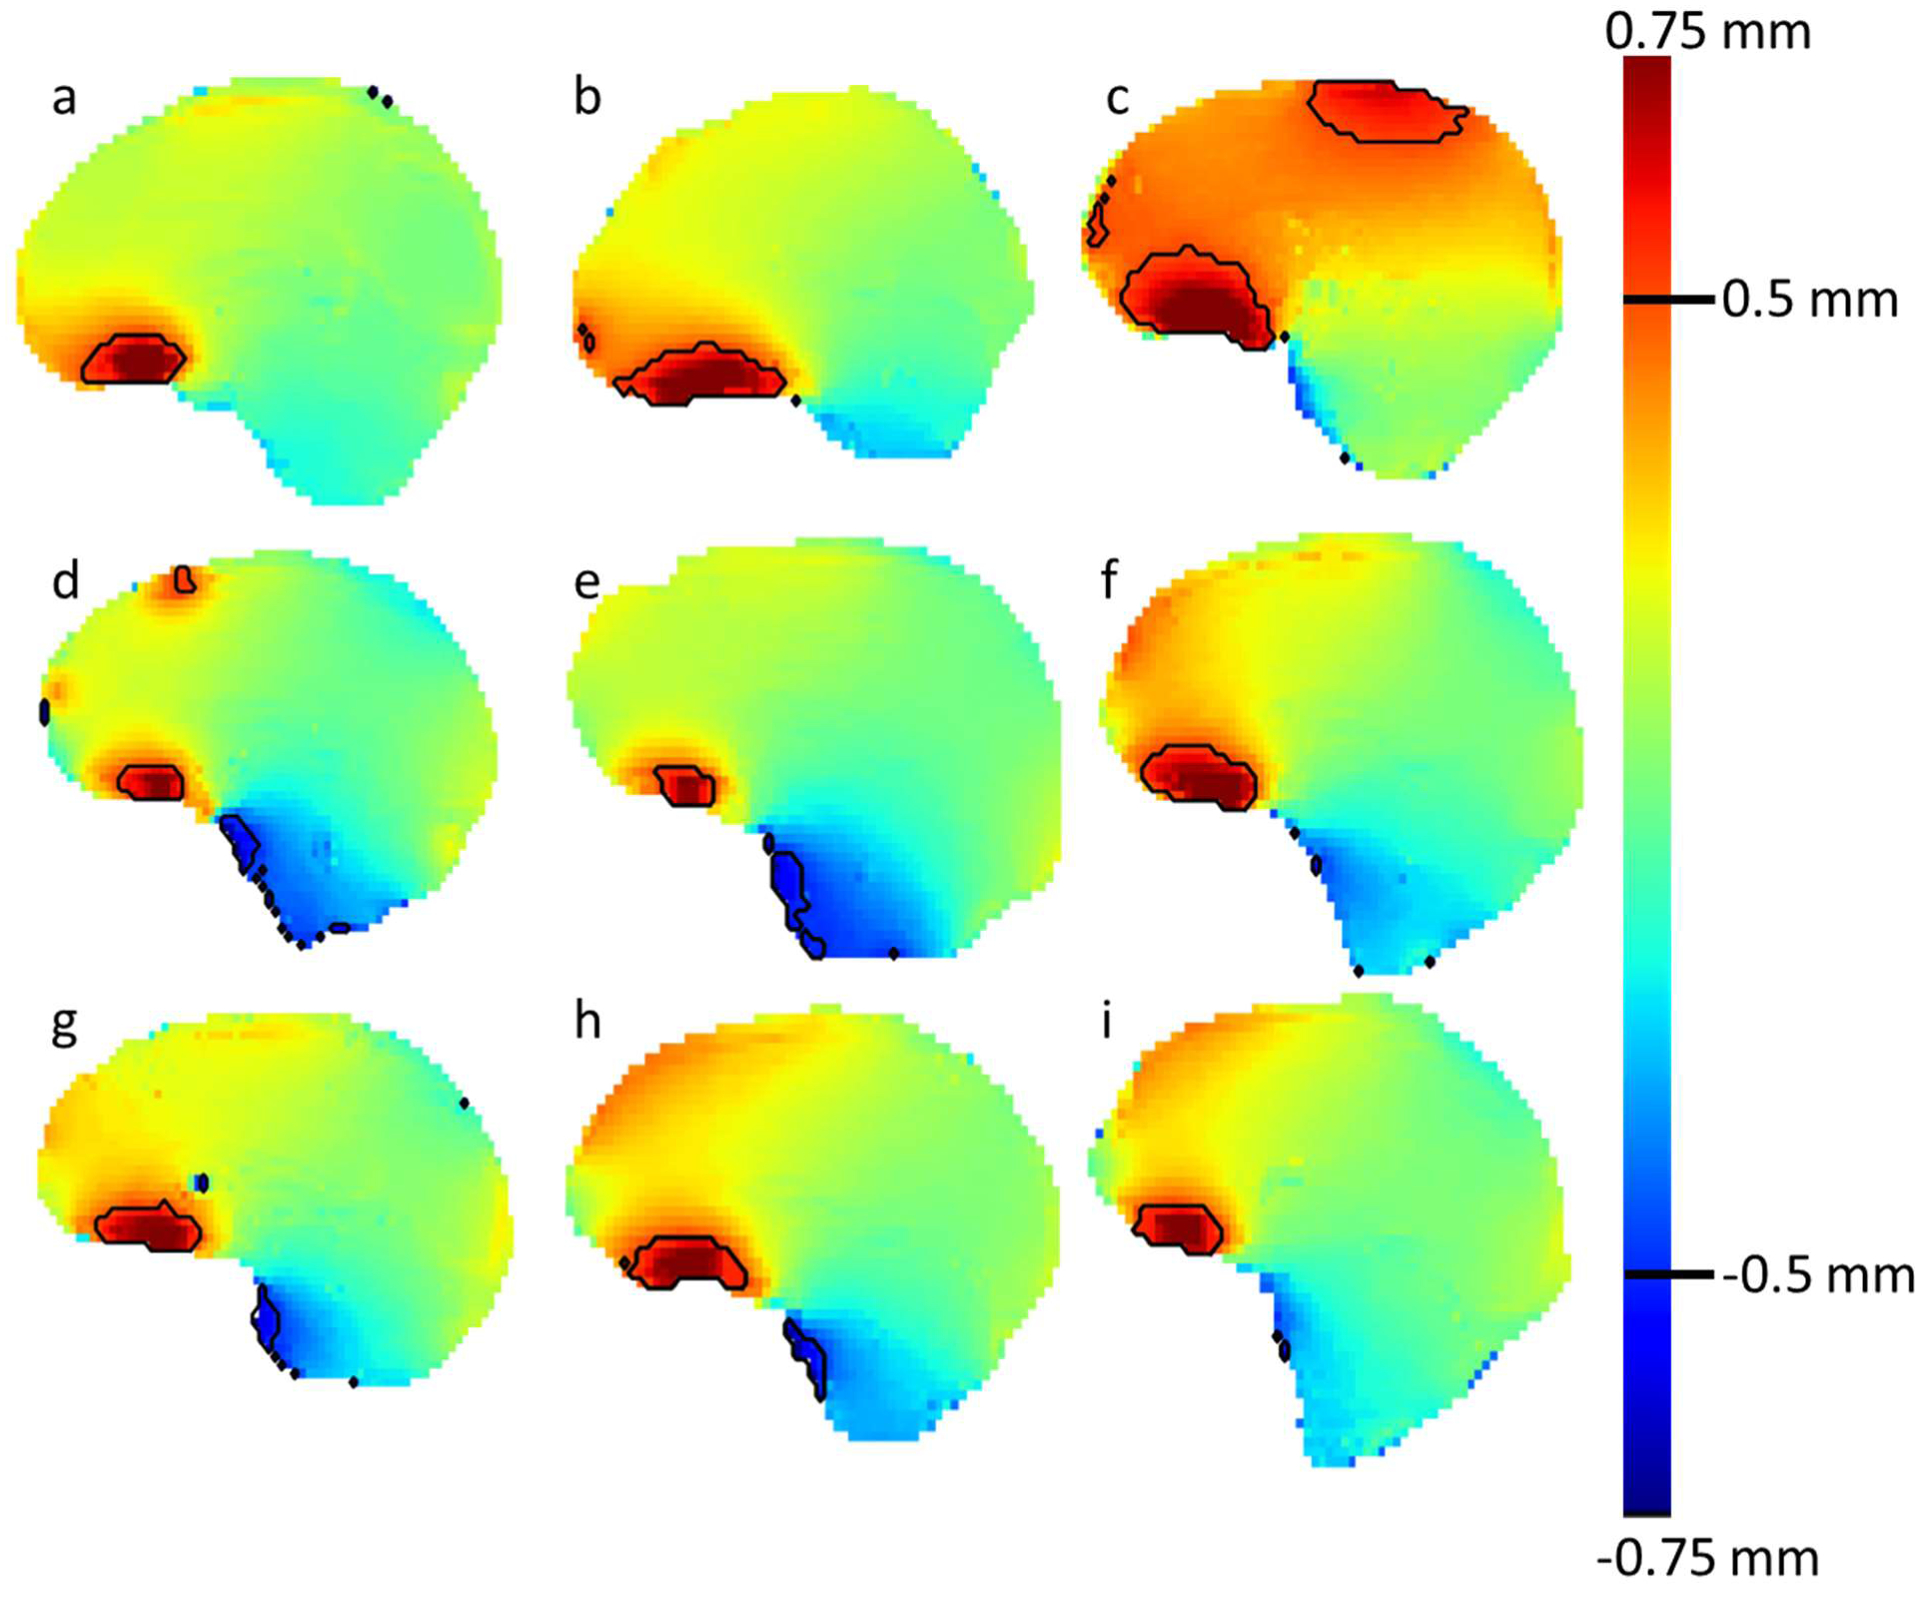
Midsagittal ΔB0 scans of the brain contour for 9 patients. The color map ranges from +0.75 mm (red) to −0.75 mm (blue) with a blue background. The black contour outlines regions of the brain with absolute distortion >0.5 mm.
The ΔB0 map voxel values within each of the 95 GTVs across all 25 patients were collected and analyzed. GTV volumes ranged from 0.02 to 1.17 cm3 (1 to 74 ΔB0 map voxels) which included all lesions treated to 20 Gy in a single fraction within this patient cohort. The distortion mapping method used here generated reasonable distortion maps for all voxels within all targets studied and all target voxels were included in the analysis. Equation 1 was used to convert the ΔB0 value in each voxel to distortion in millimeters. Some targets had all voxels tightly grouped around the mean value within the volume, while others had larger variation. Some GTVs were distributed about zero distortion, while others were distributed around non-zero values. There were some regions of lower signal within the GTVs, but none that dropped below the threshold requiring interpolation. The distortion characteristics of each GTV depended on the local distortion near the target. In some cases, targets slightly overlapped with regions of significant distortion causing outliers in the distribution. No correlation was found between mean distortion and distance from magnet iso-center (R2 = 0.003). Similarly, no correlation was found between mean distortion and target volume (R2 = 0.07).
Grouping each GTV together by patient produced the plot in Figure 5. This figure shows that GTVs with voxels outside of the ± 0.5 mm distortion range are present in 5 of the 25 patient cohort (20%). In each of these 5 cases, the most distorted targets tended to be located more inferiorly in the brain. While patient 4 had a mean distortion for all targets of nearly 0.5 mm, patients 14, 16, 17, and 19 had mean distortion values closer to 0 mm. Patient 4 and 14 had individual target voxels approaching distortions of 1mm, while 16, 17, and 19 had maximum distortions closer to 0.5 mm. The variation observed from GTV to GTV and patient to patient supports using a patient specific BW optimization method. Equation 2 was used to compute the optimal BW needed to keep the mean and worst case GTV voxel for each patient within an absolute distortion tolerance of 0.5 mm, the results of which are shown in Figure 6.
Figure 5.
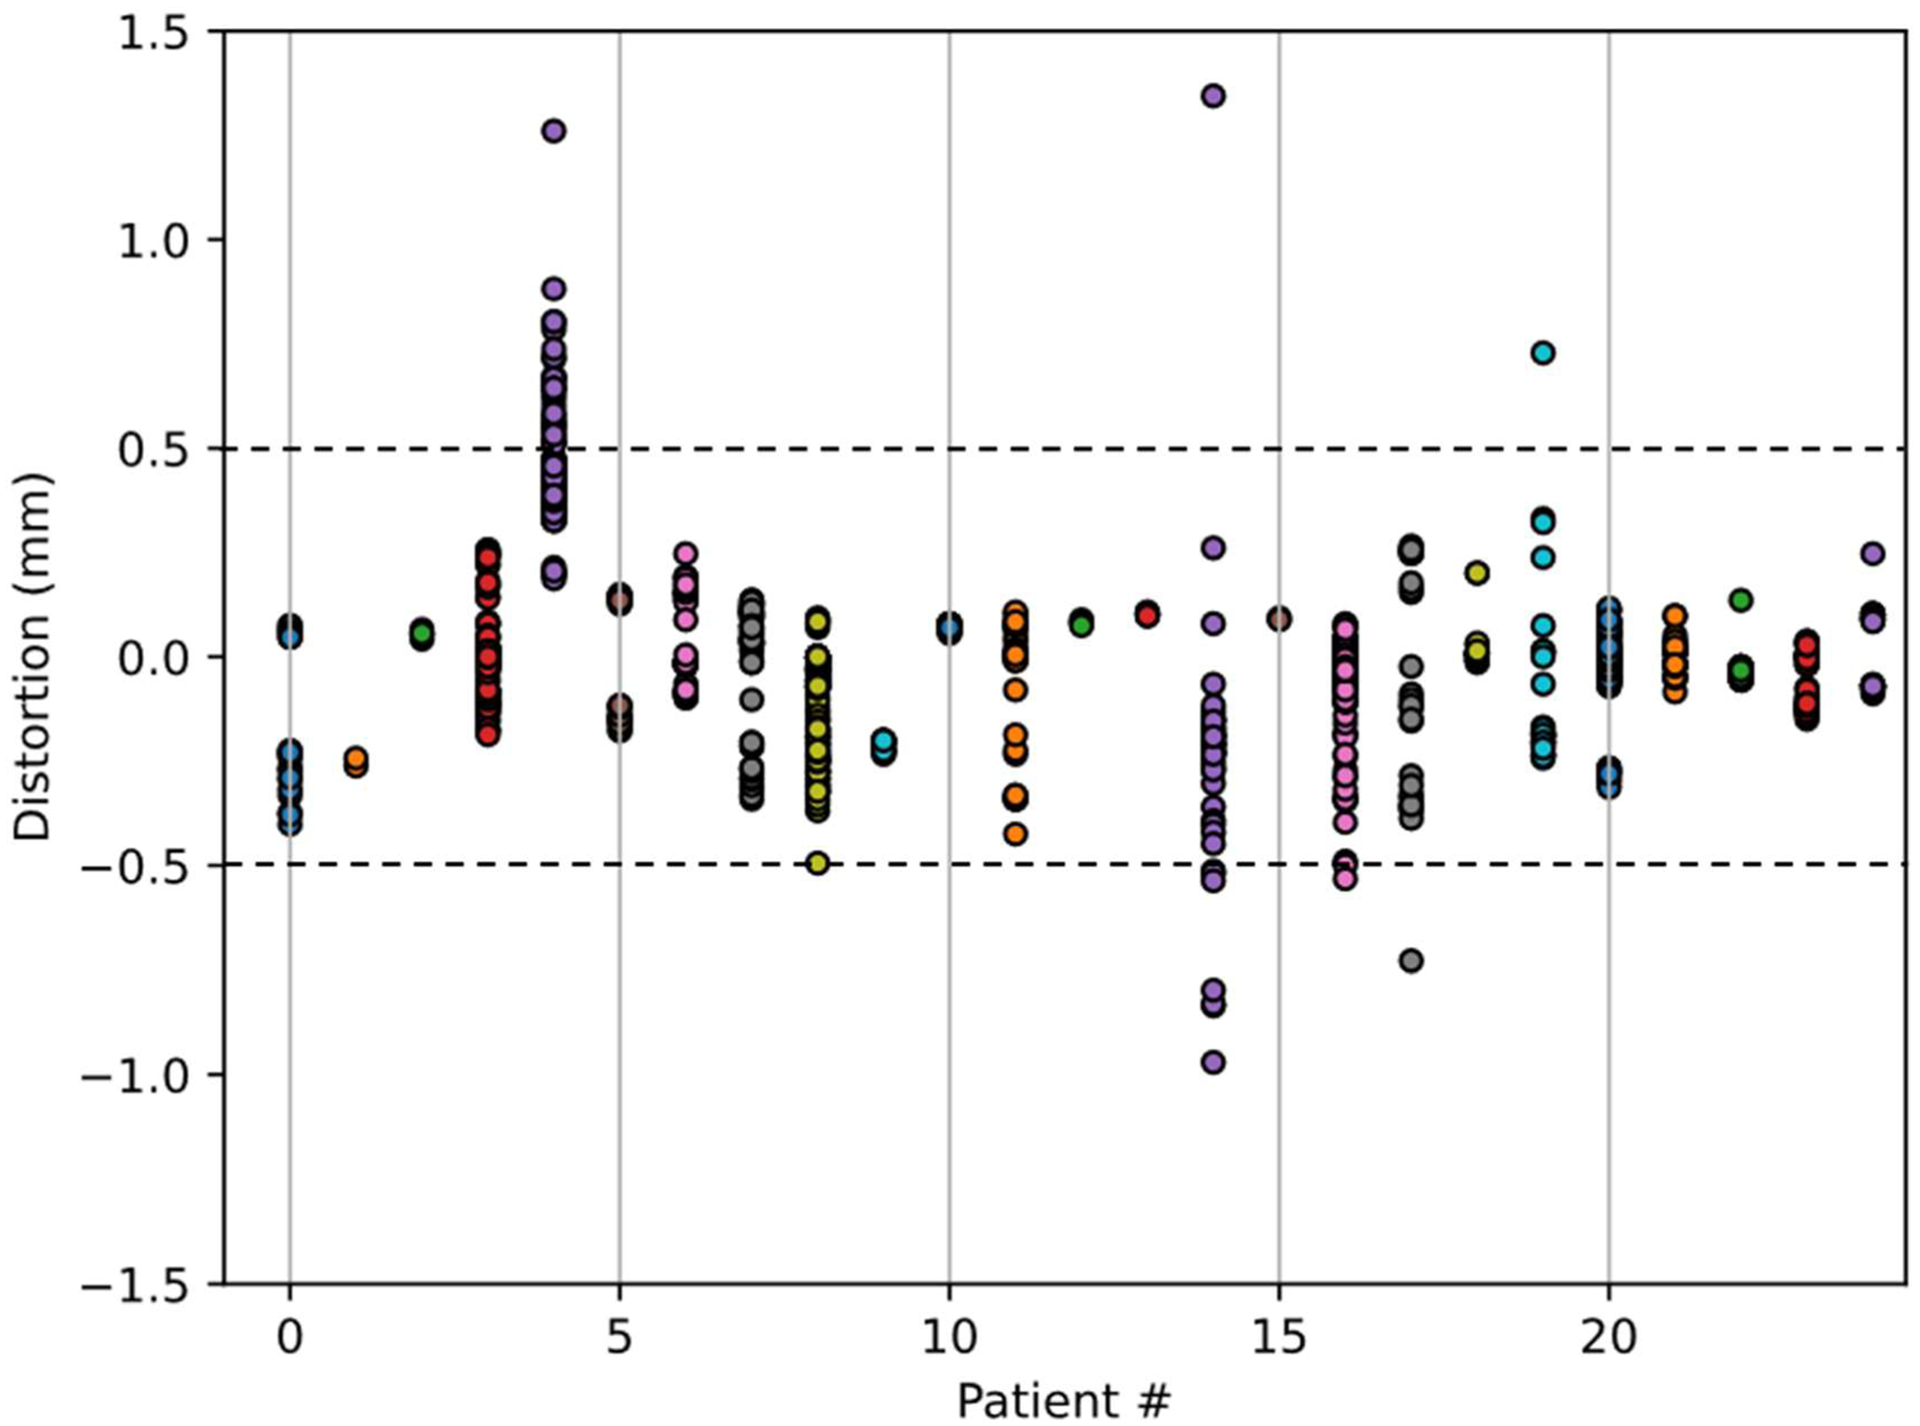
Distortion in mm for each voxel contained within each GTV volume accumulated by patient. Each circle represents a GTV voxel. Colors are used to distinguish patients from one another.
Figure 6.
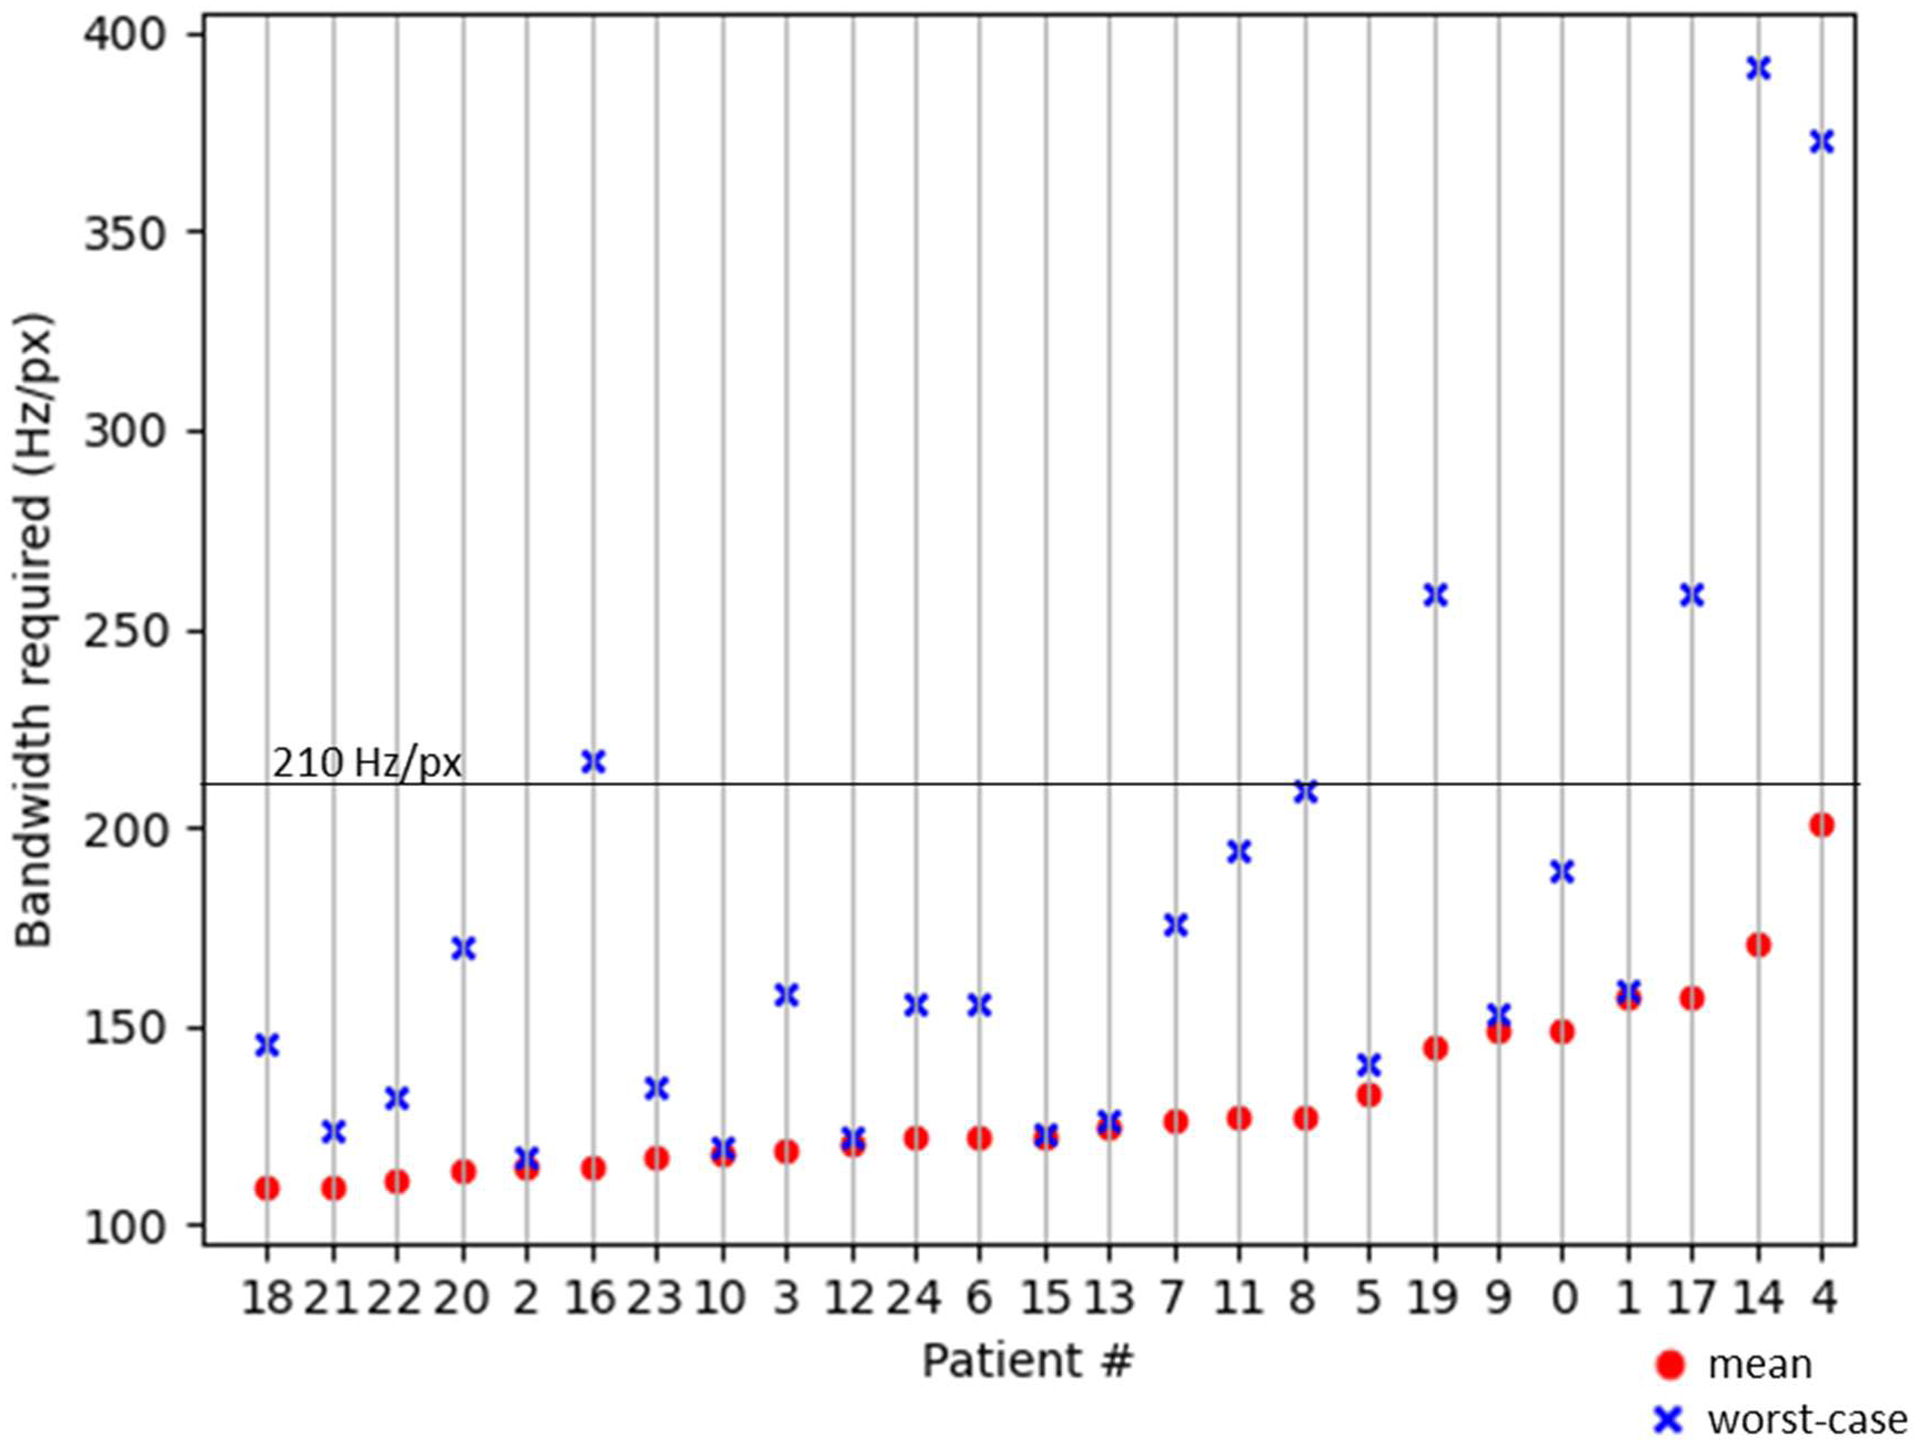
The BW required to achieve less than 0.5 mm absolute distortion for all targets within each patient within the cohort sorted by mean ΔB0 value. The mean value reported here is the mean of the absolute value. The dots are the mean values and the value of the worst-case voxel within the target is shown as an x. The clinical acquisition BW is shown as a horizontal line across the plot at 210 Hz/px.
For the patient on the far right of Figure 6 (patient 4), to achieve a mean distortion within tolerance across all targets, the acquisition BW would need to be 200 Hz/px. Since the acquisition BW was 210 (solid horizontal line), the mean distortion would be within tolerance. However, some voxels within this patient’s GTVs, most likely on the edge of one or more target, would require higher bandwidth of 373 Hz/px to be within tolerance. Of note, changing to a higher BW may be important for patient 4 to avoid a marginal miss at the edge of a target, however a BW of 373 Hz/px would unnecessarily sacrifice SNR for all but one other patient. Rather than setting BW for the population to be high enough for the worst-case patient, a better approach would be to set BW on a patient specific basis. A potentially acceptable alternative would be to set BW at an intermediate level, for example 210 Hz/px, to produce acceptable distortion for most. The patients in Figure 6 are sorted by the mean of the absolute distortion within all GTVs for that patient. The patient numbers match those in Figure 5.
Several of the 95 GTVs studied here were located within a steep spatial distortion gradient. These targets were usually near the sinus, base, or edge of the skull. An example axial slice of one such target is shown in Figure 7, where the zoomed out image on the left gives context and the zoomed in image on the right shows the detail of the distortion map within and near the target. Note that some regions of the GTV contour are distorted by more than +0.5 mm, while other areas have distortion closer to 0 mm. In addition, a region of −0.75 mm distortion is less than 1 mm away.
Figure 7.
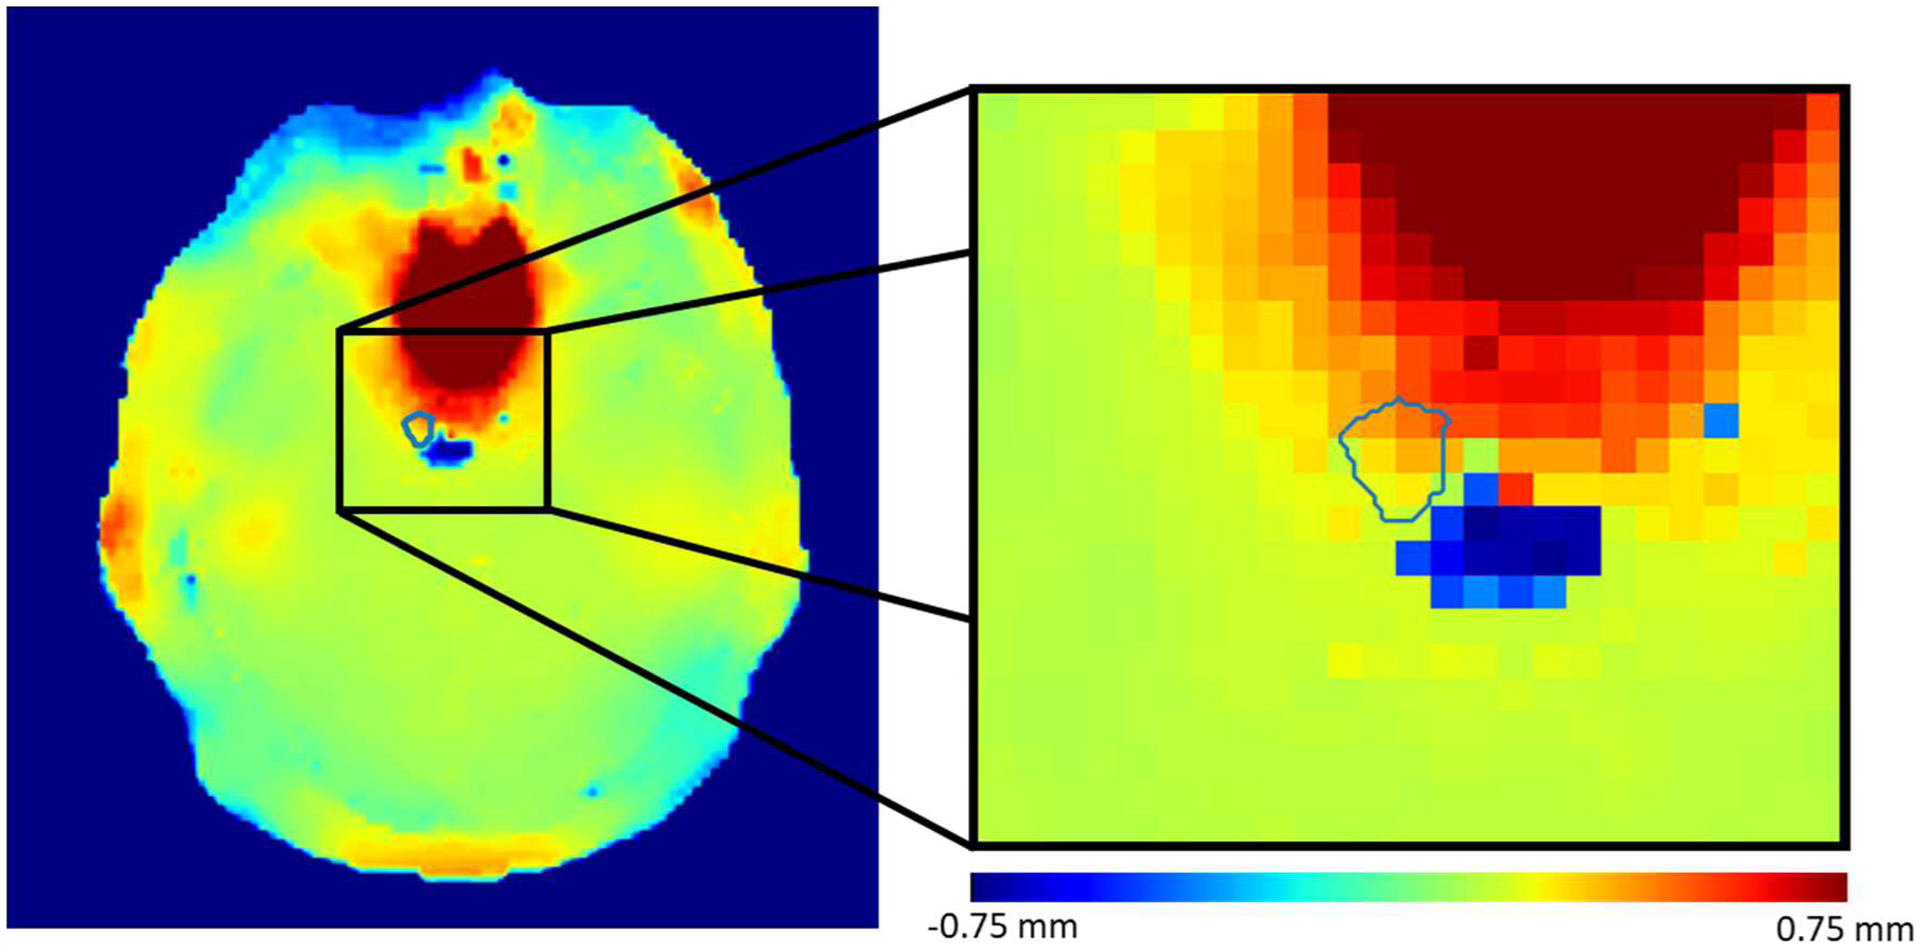
An example of an axial GTV contour that contains a steep gradient of distortion values within the contour.
4. Discussion
MRI geometric distortion is an important concern when MRI is the source for target or OAR contours and particularly in situations where target margins are minimal. B0 field inhomogeneity is one cause for geometric distortion that may be mitigated in ways that can be tailored to the patient. In this study, a method for B0 field inhomogeneity estimation was validated and used to measure geometric distortion at the locations of treatment targets within patients. To our knowledge, the field mapping technique used here has not been applied to this problem before. The technique allows for accurate, large dynamic range B0 mapping without the need for phase unwrapping algorithms. The phantom validation study showed that manually created B0 inhomogeneity-induced distortions can be estimated using this field mapping method. In the retrospective patient study, images and contours from 25 patients and 95 targets were analyzed to estimate the range of geometric distortions that can be expected in-vivo and to estimate the level of mitigation that would be required to keep all treatment targets to within the ± 0.5 mm iso-distortion contour. It was found that, at 3T and 1mm acquisition resolution, maintaining absolute distortions under 0.5 mm for all target voxels required a BW of up to 390 Hz/px for the worst cases. Compared to our clinical protocol with a BW setting of 210 Hz/px, setting all patient scans to a BW of 390 Hz/px would reduce SNR by 54%. Recovery of the lost SNR would require 4 additional signal averages and 9 minutes of additional scan time.
Previous work has investigated a variety of techniques for estimating inhomogeneity-induced distortions in the brain [6], [27], head and neck [28], abdomen [15], pelvis [14], [29], and breast [30]. Many previous studies have evaluated B0 inhomogeneity within the entire imaging volume or throughout entire organs [6], [27], [28]. This study evaluated distortion within target volumes, as opposed to entire organs. Other studies reporting on patient specific distortion within SRS targets, have used reversed gradient [19] and/or dual echo phase mapping techniques [20], [21] at 1.5 T and have reported similar patient specific distortion values up to 0.75 mm.
Distortion measurements at target locations can be used to compensate for distortions by allowing for target specific local registrations or using additional margin on targets that are particularly distorted. Distortion mitigation is possible through an online process that adapts BW to keep targets within iso-distortion contours, while the patient is on the table, prior to a final scan being acquired. This process has the potential to optimize the tradeoff between geometric distortion and SNR for each patient, but must be fast to be clinically realizable. The slowest step in this proposed process is target localization. The time required for target localization could be reduced by identifying target locations prior to the radiation therapy imaging session using images previously acquired in radiology. Another potential option is to automate the detection of treatment targets, an area of active research for several groups [31], [32]. Once the target contours are created, if it is found that a target falls outside of the acceptable iso-distortion contour, the BW can be increased to move the iso-distortion contour to encompass the target, and the scan can be repeated. If all targets are well within the iso-distortion contour, then the scan could be used as is. In this situation, it may also be reasonable to consider decreasing BW to improve SNR. Future work will include a prospective online adaptive-BW protocol that implements this workflow.
Geometric distortion mitigation strategies may be critical if higher field strength MRI systems are used for treatment planning scans. Field inhomogeneities are more significant as the magnet field strength increases [33], as patient specific distortion at 7T has been reported up to 4 mm [34]. Fortunately, the pulse sequence used in this study may be applied at 7T and future studies will investigate using an adaptive protocol strategy at 7T.
The acceptable distortion threshold of ± 0.5 mm used in this study was chosen based on the widespread practice of using 0–1 mm PTV margins for stereotactic radiosurgery cases [35]. It was observed that distortion maps are spatially smooth and since SRS targets are generally small relative to the variation of the distortion field, any individual target should only experience up to an absolute distortion of 0.5 mm. Distortions of 0.5 mm would account for 50% of this typical margin, leaving the rest to cover residual gradient non-linearity distortion, registration, patient positioning, mechanical dose delivery uncertainty and patient motion. Notably, 0.5 mm is smaller than a typical MRI voxel size of 1 mm. A reasonable concern is whether such small distortions can even impact target contour positioning. First, sub-voxel distortions were detected both manually and automatically in the phantom study presented here. These slight distortions were also accurately mitigated via an increase in bandwidth. Submillimeter shifts to the fiducials within the phantom were manually verified. These results apply to clinical practice where targets are contoured with sub-voxel resolution and sub-voxel registrations are locally evaluated based on manually interpolated structures such as brain gyri and sulci.
One limitation of this study and proposed process is in the registration between the initial contrast-enhanced MRI scan and the ΔB0 scan. If the patient moved between these scans, then the estimate of the local distortion around the target may be wrong. Precise re-registration of these volumes is non-trivial. This issue may be addressed by immobilizing the patient and making the time between scans as short as possible. As ΔB0 varies slowly across the brain, it is likely that slight mis-registrations will have a minimal impact. Here, the acquired B0 maps were only used for distortion estimation. Nonetheless, it would be possible to use the B0 maps to actually correct geometric distortion in the acquired images, not only along the readout direction for conventional imaging like MPRAGE, but also along the phase-encoding direction in echoplanar acquisitions commonly used in diffusion-weighted imaging [36]–[38]. This will be investigated in future studies. In addition, the B0 maps used here only allow for estimation of distortions caused by patient specific B0 inhomogeneity associated with tissue magnetic susceptibility variation and static field imperfections. They do not allow for estimates of distortion caused by gradient non-linearities or chemical shift which would add to the total distortion and should be accounted for separately. Furthermore, this method cannot provide distortion estimates in regions of low or zero signal including bony structures and we did not quantify here the accuracy of the distortion estimates adjacent to bony structures. Although the present work has applied this method in the radiosurgery context, it would be applicable to other relatively stationary body sites such as the pelvis. Application in the thorax or abdomen is not currently feasible due to breathing motion and the one-minute ΔB0 scan time which cannot be acquired in a single breath hold.
In this work, a uniquely simple inhomogeneity mapping technique was applied and validated to assess geometric distortions in SRS patients. The phantom based validation process presented here is generalizable and could be applied to any inhomogeneity detection scheme. The retrospective patient data analysis provided motivation for developing a clinical workflow for online, patient specific MRI bandwidth optimization for radiosurgery treatment planning. Future work will involve testing this prospective clinical workflow.
Acknowledgement
The authors would like to thank Dr. Michael Köhler from Siemens Healthcare for helpful hints regarding the field map acquisition.
References
- [1].Saconn PA et al. , “Use of 3.0-T MRI for stereotactic radiosurgery planning for treatment of brain metastases: A single-institution retrospective review,” Int. J. Radiat. Oncol. Biol. Phys, vol. 78, no. 4, pp. 1142–1146, Nov. 2010. [DOI] [PubMed] [Google Scholar]
- [2].Debois M et al. , “The contribution of magnetic resonance imaging to the three-dimensional treatment planning of localized prostate cancer,” Int. J. Radiat. Oncol. Biol. Phys, vol. 45, no. 4, pp. 857–865, Nov. 1999. [DOI] [PubMed] [Google Scholar]
- [3].Buyyounouski MK, Horwitz EM, Price RA, Hanlon AL, Uzzo RG, and Pollack A, “Intensity-modulated radiotherapy with mri simulation to reduce doses received by erectile tissue during prostate cancer treatment,” Int. J. Radiat. Oncol. Biol. Phys, vol. 58, no. 3, pp. 743–749, 2004. [DOI] [PubMed] [Google Scholar]
- [4].McLaughlin PW et al. , “Vessel-sparing prostate radiotherapy: Dose limitation to critical erectile vascular structures (internal pudendal artery and corpus cavernosum) defined by MRI,” Int. J. Radiat. Oncol. Biol. Phys, vol. 61, no. 1, pp. 20–31, Jan. 2005. [DOI] [PubMed] [Google Scholar]
- [5].Baldwin LN, Wachowicz K, Thomas SD, Rivest R, and Gino Fallone B, “Characterization, prediction, and correction of geometric distortion in 3 T MR images,” Med. Phys, vol. 34, no. 2, pp. 388–399, 2007. [DOI] [PubMed] [Google Scholar]
- [6].Wang H, Balter J, and Cao Y, “Patient-induced susceptibility effect on geometric distortion of clinical brain MRI for radiation treatment planning on a 3T scanner,” Phys. Med. Biol, vol. 58, no. 3, pp. 465–477, Feb. 2013. [DOI] [PubMed] [Google Scholar]
- [7].Price RG, Kadbi M, Kim J, Balter J, Chetty IJ, and Glide-Hurst CK, “Technical Note: Characterization and correction of gradient nonlinearity induced distortion on a 1.0 T open bore MR-SIM,” Med. Phys, vol. 42, no. 10, p. 5955, Oct. 2015. [DOI] [PMC free article] [PubMed] [Google Scholar]
- [8].Smith AS, Weinstein MA, Hurst GC, DeRemer DR, Cole RA, and Duchesneau PM, “Intracranial chemical-shift artifacts on MR images of the brain: Observations and relation to sampling bandwidth,” Am. J. Roentgenol, vol. 154, no. 6, pp. 1275–1283, 1990. [DOI] [PubMed] [Google Scholar]
- [9].Gach HM, Curcuru AN, Mutic S, and Kim T, “B0 field homogeneity recommendations, specifications, and measurement units for MRI in radiation therapy,” Med. Phys, vol. 47, no. 9, pp. 4101–4114, Sep. 2020. [DOI] [PMC free article] [PubMed] [Google Scholar]
- [10].Chen H-H, Boykin RD, Clarke GD, Gao J-HT, and Roby JW, “Routine testing of magnetic field homogeneity on clinical MRI systems,” Med. Phys, vol. 33, no. 11, pp. 4299–4306, Oct. 2006. [DOI] [PubMed] [Google Scholar]
- [11].Rose A, Vision: Human and Electronic. New York: Plenum Press, 1973. [Google Scholar]
- [12].Glide-Hurst CK et al. , “Task Group 284 Report: Magnetic Resonance Imaging Simulation in Radiotherapy: Considerations for Clinical Implementation, Optimization, and Quality Assurance,” Med. Phys, Jan. 2021. [DOI] [PMC free article] [PubMed] [Google Scholar]
- [13].Stanescu T, Wachowicz K, and Jaffray DA, “Characterization of tissue magnetic susceptibility-induced distortions for MRIgRT,” Med. Phys, vol. 39, no. 12, pp. 7185–7193, 2012. [DOI] [PubMed] [Google Scholar]
- [14].Tyagi N et al. , “Dosimetric and workflow evaluation of first commercial synthetic CT software for clinical use in pelvis,” Phys. Med. Biol, vol. 62, no. 8, pp. 2961–2975, Mar. 2017. [DOI] [PMC free article] [PubMed] [Google Scholar]
- [15].Matakos A, Balter JM, and Cao Y, “A Robust Method for Estimating B0 Inhomogeneity Field in the Liver by Mitigating Fat Signals and Phase-Wrapping,” Tomography, vol. 3, no. 2, p. 79, Jun. 2017. [DOI] [PMC free article] [PubMed] [Google Scholar]
- [16].Matakos A, Balter J, and Cao Y, “Estimation of geometrically undistorted B0 inhomogeneity maps,” Phys. Med. Biol, vol. 59, no. 17, pp. 4945–4959, Sep. 2014. [DOI] [PMC free article] [PubMed] [Google Scholar]
- [17].Chang H and Fitzpatrick JM, “A technique for accurate magnetic resonance imaging in the presence of field inhomogeneities,” IEEE Trans. Med. Imaging, vol. 11, no. 3, pp. 319–329, 1992. [DOI] [PubMed] [Google Scholar]
- [18].Reinsberg SA, Doran SJ, Charles-Edwards EM, and Leach MO, “A complete distortion correction for MR images: II. Rectification of static-field inhomogeneities by similarity-based profile mapping,” Phys. Med. Biol, vol. 50, no. 11, pp. 2651–2661, Jun. 2005. [DOI] [PubMed] [Google Scholar]
- [19].Karaiskos P et al. , “A simple and efficient methodology to improve geometric accuracy in gamma knife radiation surgery: implementation in multiple brain metastases,” Int. J. Radiat. Oncol. Biol. Phys, vol. 90, no. 5, pp. 1234–1241, Dec. 2014. [DOI] [PubMed] [Google Scholar]
- [20].Pappas EP, Seimenis I, Dellios D, Kollias G, Lampropoulos KI, and Karaiskos P, “Assessment of sequence dependent geometric distortion in contrast-enhanced MR images employed in stereotactic radiosurgery treatment planning,” Phys. Med. Biol, vol. 63, no. 13, p. 135006, Jun. 2018. [DOI] [PubMed] [Google Scholar]
- [21].Dellios D et al. , “Evaluation of patient-specific MR distortion correction schemes for improved target localization accuracy in SRS,” Med. Phys, vol. 48, no. 4, pp. 1661–1672, Apr. 2021. [DOI] [PubMed] [Google Scholar]
- [22].Dagher J, Reese T, and Bilgin A, “High-resolution, large dynamic range field map estimation,” Magn. Reson. Med, vol. 71, no. 1, pp. 105–117, 2014. [DOI] [PMC free article] [PubMed] [Google Scholar]
- [23].Fautz H, Gross P, and Gumbrecht R, “Method and computer to determine a B0 field map with a magnetic resonance apparatus,” US20150077115A1, 2015.
- [24].Gumbrecht R, Koehler M, and Schneider R, “Method and magnetic resonance apparatus for correction of a B0 map for chemical shifts,” US9830711B2, 2015.
- [25].Huang K. (Colin), Cao Y, Baharom U, and Balter JM, “Phantom-based characterization of distortion on a magnetic resonance imaging simulator for radiation oncology,” Phys. Med. Biol, vol. 61, no. 2, p. 774, Jan. 2016. [DOI] [PMC free article] [PubMed] [Google Scholar]
- [26].“Magphan RT Data Sheet,” 2020. [Online]. Available: https://static1.squarespace.com/static/5367b059e4b05a1adcd295c2/t/5f09e01bb1970417789c2bb3/1594482719226/MagphanRTDataSheetJuly2020.pdf. [Accessed: 19-Aug-2021].
- [27].Mengling V et al. , “Evaluation of the influence of susceptibility-induced magnetic field distortions on the precision of contouring intracranial organs at risk for stereotactic radiosurgery,” Phys. Imaging Radiat. Oncol, vol. 15, pp. 91–97, Jul. 2020. [DOI] [PMC free article] [PubMed] [Google Scholar]
- [28].Adjeiwaah M et al. , “Dosimetric Impact of MRI Distortions: A Study on Head and Neck Cancers,” Int. J. Radiat. Oncol. Biol. Phys, vol. 103, no. 4, pp. 994–1003, Mar. 2019. [DOI] [PubMed] [Google Scholar]
- [29].Adjeiwaah M, Bylund M, Lundman JA, Karlsson CT, Jonsson JH, and Nyholm T, “Quantifying the Effect of 3T Magnetic Resonance Imaging Residual System Distortions and Patient-Induced Susceptibility Distortions on Radiation Therapy Treatment Planning for Prostate Cancer,” Int. J. Radiat. Oncol. Biol. Phys, vol. 100, no. 2, pp. 317–324, Feb. 2018. [DOI] [PubMed] [Google Scholar]
- [30].Walker A et al. , “MRI geometric distortion: Impact on tangential whole-breast IMRT,” J. Appl. Clin. Med. Phys, vol. 17, no. 5, pp. 7–19, 2016. [DOI] [PMC free article] [PubMed] [Google Scholar]
- [31].Liu Y et al. , “Automatic metastatic brain tumor segmentation for stereotactic radiosurgery applications,” Phys. Med. Biol, vol. 61, no. 24, pp. 8440–8461, Nov. 2016. [DOI] [PubMed] [Google Scholar]
- [32].Lu S-L et al. , “Randomized multi-reader evaluation of automated detection and segmentation of brain tumors in stereotactic radiosurgery with deep neural networks,” Neuro. Oncol, Mar. 2021. [DOI] [PMC free article] [PubMed] [Google Scholar]
- [33].MacFadden D et al. , “Clinical Evaluation of Stereotactic Target Localization Using 3-Tesla MRI for Radiosurgery Planning,” Int. J. Radiat. Oncol. Biol. Phys, vol. 76, no. 5, pp. 1472–1479, Apr. 2010. [DOI] [PubMed] [Google Scholar]
- [34].Duchin Y, Abosch A, Yacoub E, Sapiro G, and Harel N, “Feasibility of Using Ultra-High Field (7 T) MRI for Clinical Surgical Targeting,” PLoS One, vol. 7, no. 5, p. 37328, May 2012. [DOI] [PMC free article] [PubMed] [Google Scholar]
- [35].Kirkpatrick JP et al. , “Defining the optimal planning target volume in image-guided stereotactic radiosurgery of brain metastases: Results of a randomized trial,” Int. J. Radiat. Oncol. Biol. Phys, vol. 91, no. 1, pp. 100–108, Jan. 2015. [DOI] [PubMed] [Google Scholar]
- [36].Jezzard P and Balaban RS, “Correction for geometric distortion in echo planar images from B0 field variations,” Magn. Reson. Med, vol. 34, no. 1, pp. 65–73, 1995. [DOI] [PubMed] [Google Scholar]
- [37].Andersson JLR, Skare S, and Ashburner J, “How to correct susceptibility distortions in spin-echo echo-planar images: Application to diffusion tensor imaging,” Neuroimage, vol. 20, no. 2, pp. 870–888, Oct. 2003. [DOI] [PubMed] [Google Scholar]
- [38].Holland D, Kuperman JM, and Dale AM, “Efficient correction of inhomogeneous static magnetic field-induced distortion in Echo Planar Imaging,” Neuroimage, vol. 50, no. 1, pp. 175–183, Mar. 2010. [DOI] [PMC free article] [PubMed] [Google Scholar]


