Figure 1.
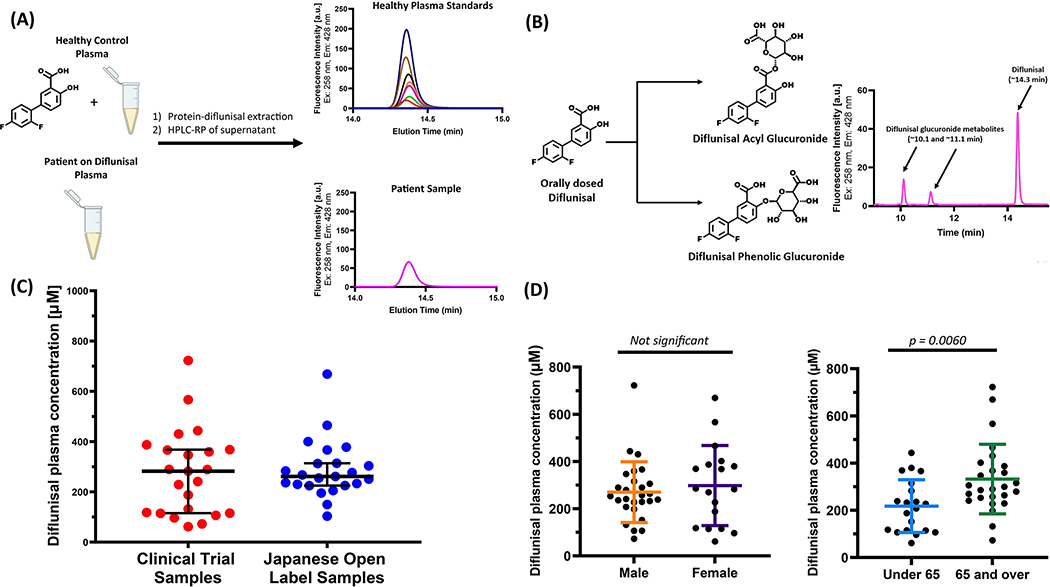
(A) Method to quantify diflunisal concentration and its metabolites in human plasma. A standard diflunisal concentration curve was produced by adding known diflunisal amounts to a pooled healthy plasma sample ex-vivo (see Supplementary Information for more details). Diflunisal was extracted from the macromolecules comprising a 40 μL plasma sample using 200 μL of acetonitrile containing 1% (w/v) trichloroacetic acid. Ten μL of the microcentrifuged supernatant (one solution phase) was injected onto a Waters Symmetry reversed-phase C18 column (3.5 μm, 4.6 × 75 mm) eluted with a gradient of 0–100% solution B over 20 min (solution A: 99.9% water, 0.1% trifluoroacetic acid; solution B: 99.9% acetonitrile, 0.1% trifluoracetic acid) using a flow rate of 1 ml/min. The excitation and emission wavelengths employed for fluorescence detection were λex=254 nm and λem=424 nm. (B) Diflunisal was extracted from patient plasma samples and analysed exactly the same as for the standard curve generation. The HPLC chromatogram from a patient sample shows the diflunisal peak at ~14.3 min and the two indicated diflunisal-glucuronide metabolites at ~10.1 and ~11.1 min (C) Measured diflunisal concentration in polyneuropathy patient plasma samples after long-term treatment with diflunisal (250 mg BID). Depicted in red filled circles are the plasma diflunisal concentrations from the placebo-controlled trial and in blue filled circles are the plasma diflunisal concentrations from the Japanese open-label study. The mean diflunisal plasma concentrations for the two groups are 275.0 μM (red) and 289.4 μM (blue). (D) Gender and age comparisons of mean diflunisal-plasma concentration amongst polyneuropathy patient samples from the combined cohorts. There is no significant difference in mean diflunisal-plasma concentration between genders (male: 272.0 μM, female: 298.0 μM). There is a significant difference when comparing age (under 65: 217.7 μM, over 65: 332.1 μM; p = .006). p Values were calculated using an unpaired t-test. Horizontal lines represent the mean and error bars represent the standard deviation.

