

Abstract
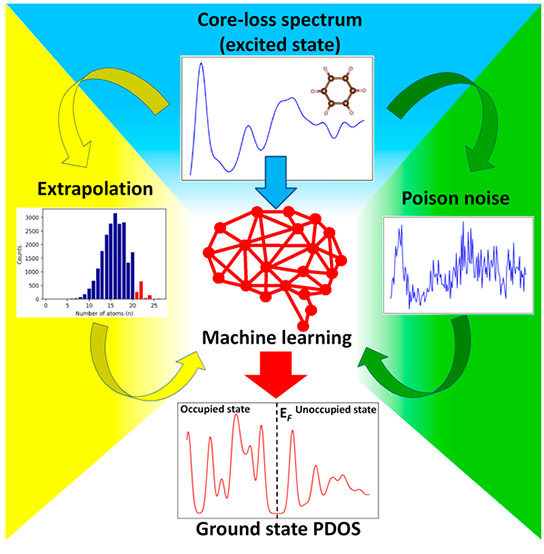
The core-loss spectrum reflects the partial density of states (PDOS) of the unoccupied states at the excited state and is a powerful analytical technique to investigate local atomic and electronic structures of materials. However, various molecular properties governed by the ground-state electronic structure of the occupied orbital cannot be directly obtained from the core-loss spectra. Here, we constructed a machine learning model to predict the ground-state carbon s- and p-orbital PDOS in both occupied and unoccupied states from the C K-edge spectra. We also attempted an extrapolation prediction of the PDOS of larger molecules using a model trained by smaller molecules and found that the extrapolation prediction performance can be improved by excluding tiny molecules. Besides, we found that using smoothing preprocess and training by specific noise data can improve the PDOS prediction for noise-contained spectra, which pave a way for the application of the prediction model to the experimental data.
With the development of technology, various nanomaterials with specific properties are needed to deal with multifarious situations. In this case, local atomic and electronic structures play an important role as a result of their intimate correlation with the properties of nanomaterials. Thus, characterizing the local atomic and electronic structures becomes essential for investigating and designing the nanomaterials.1,2 Among characterization methods for the nanomaterials, core-loss spectroscopy, namely, energy loss near-edge spectroscopy (ELNES) and X-ray absorption near-edge structure (XANES), has been widely used because it reflects the atomic and electronic structures of materials in high spatial resolution and sensitivity.3,4 For example, the electronic states of catalysis can be probed through ELNES/XANES spectra to investigate the oxidation states of catalysis.5 Besides, ELNES/XANES spectra are also useful to understand the mechanism and dynamics during chemical reactions.6 Also, for carbon materials, Suenaga et al. used the carbon K-edge ELNES spectra to discriminate the local electronic and atomic structures for graphene.7
However, the molecular structure, chemical bonding, and various molecular properties, such as magnetic and mechanical properties, are mainly governed by the ground-state electronic structure of the occupied orbital, which cannot be directly obtained from the core-loss spectra.8,9 Furthermore, the connection between the ground-state electronic structure and core-loss spectra is indirect because the spectra merely correspond to the excited state.10 If the way to obtain the ground-state electronic structure of both occupied and unoccupied orbitals from the core-loss spectra would be paved, the acceleration of functional nanomaterial design will be achieved. Besides, investigating the s- and p-orbital density of states (DOS) has traditionally been a challenging task, with non-resonant inelastic X-ray scattering being the most common method, despite its seldom availability and inconvenience.11 Therefore, finding a correlation between s- and p-orbital DOS and the widely used core-loss spectra would simplify the material characterization process.
Hence, we introduced the machine learning (ML) method to achieve these targets. ML is a technique that can find out the unclear relationship between variant events. Recently, it has been used in materials science for replacing time-consuming processes to reduce computation costs. Besides, ML enables scientists to discover the obscure relationship between material properties and spectroscopies to explore unknown applications for these spectroscopies.12−15 Therefore, in this work, we aimed to use ML to obtain the full ground-state electronic structures, in particular s- and p-orbital partial density of states (PDOS), for organic molecules from carbon K-edge core-loss spectra.
The present study is schematically illustrated, as shown in Figure 1. We used a feedforward neural network (FNN) with two hidden layers as the ML model, and the carbon K-edge ELNES/XANES in the database and the ground-state PDOS of carbon s- and p-orbital were used as the input and output, respectively.16 While ELNES/XANES spectra are commonly used to investigate the unoccupied state of materials at the excited state, Kiyohara et al. have demonstrated that the unoccupied electronic structure at the excited state has similar features as that at the ground state, while the characteristic peaks shifted as a result of the core-hole effects.12 Besides, in materials science, the occupied and unoccupied states are generally considered as two independent information, representing the electrons already present in a material and the electronic states that can be accessed by adding an electron to the material, respectively.17 However, the occupied and unoccupied states are closely related as a result of the orbital splitting induced by molecular symmetry. Specifically, the splitting of the molecular orbitals gives rise to bonding and antibonding orbitals at lower and higher energy levels with the specific rules, respectively.18 Electrons usually occupy the lower energy bonding orbitals, thereby forming the occupied electronic structure, while the higher energy antibonding orbitals constitute the unoccupied states. Therefore, the distribution characteristic peaks in occupied and unoccupied states are located regularly, providing the implicit correlation between them.
Figure 1.
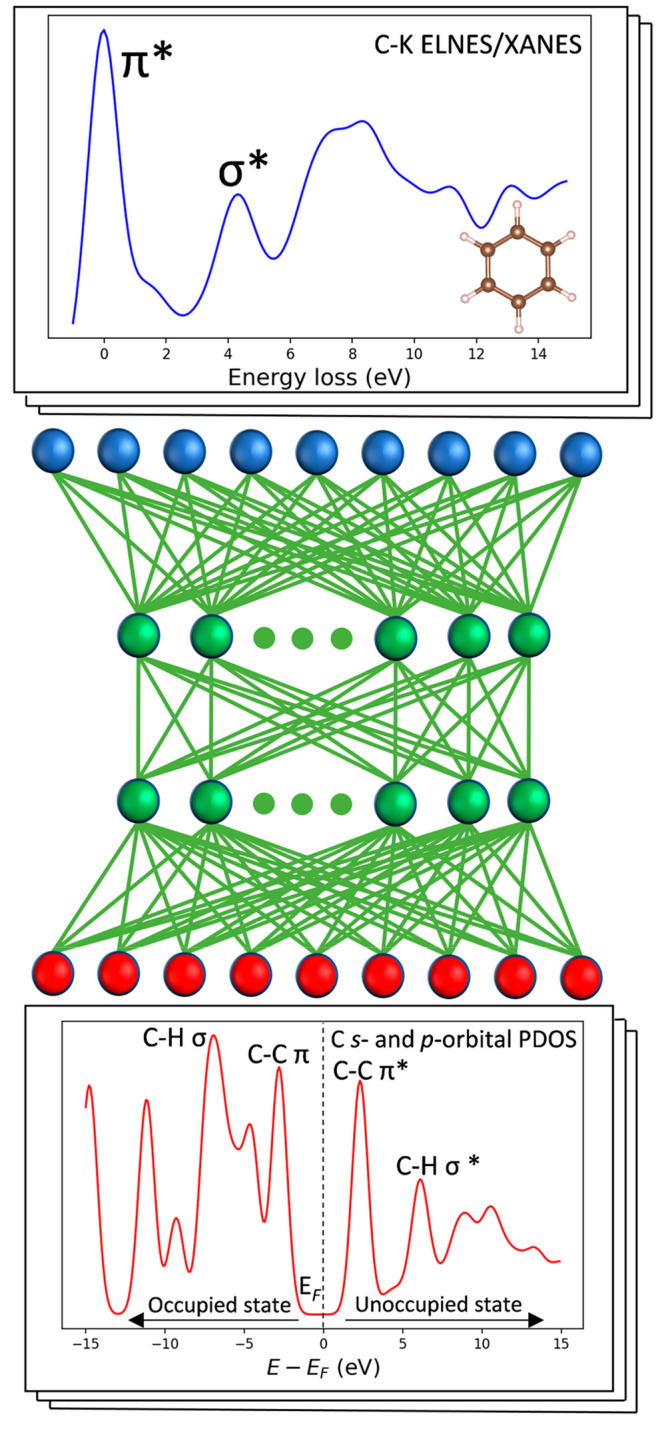
Schematic of the ML model architecture. The architecture includes an input layer of C K-edge ELNES/XANES spectra (blue), two hidden layers (green), and an output layer of C s and p-orbital PDOS (red).
In the ELNES/XANES spectrum of benzene molecules, as an example, the π* bond peak is located at the lower energy loss region than the σ* bond peaks,19 whereas in the ground-state PDOS, C–C π and π* bonds contribute to the two peaks nearest the Fermi level in the occupied and unoccupied states and the position of C–H σ and σ* bond peaks are approximately symmetrically located about the Fermi level.20 Given the strong relationship between the core-loss spectra and the occupied electronic states in the ground state of a molecule, we aim to utilize ML techniques to establish a robust connection between these two factors, with the ultimate goal of predicting the ground-state electronic structure directly from the core-loss spectra.
In this study, we used C K-edge and s- and p-orbital PDOS of 22 151 organic molecules with less than nine C, O, N, and F atoms as our data set.16,21,22 We trained the model using the 9:1 training/test ratio. Details of the model and data set are described in the Experimental Method. Figure 2a shows the sorted mean-squared error (MSE) values for the full (occupied + unoccupied) PDOS, occupied state, and unoccupied state of test data. As for the occupied and unoccupied states, the average MSE for the occupied states is 0.17, the average MSE for the unoccupied states is 0.03, and the sorted MSE values of the molecular occupied states are commonly higher than those of the unoccupied states. This evidence presents that the prediction of the unoccupied states is better than the occupied states and indicates the correlation between ELNES/XANES spectra and the unoccupied states is stronger than that for the occupied states.
Figure 2.
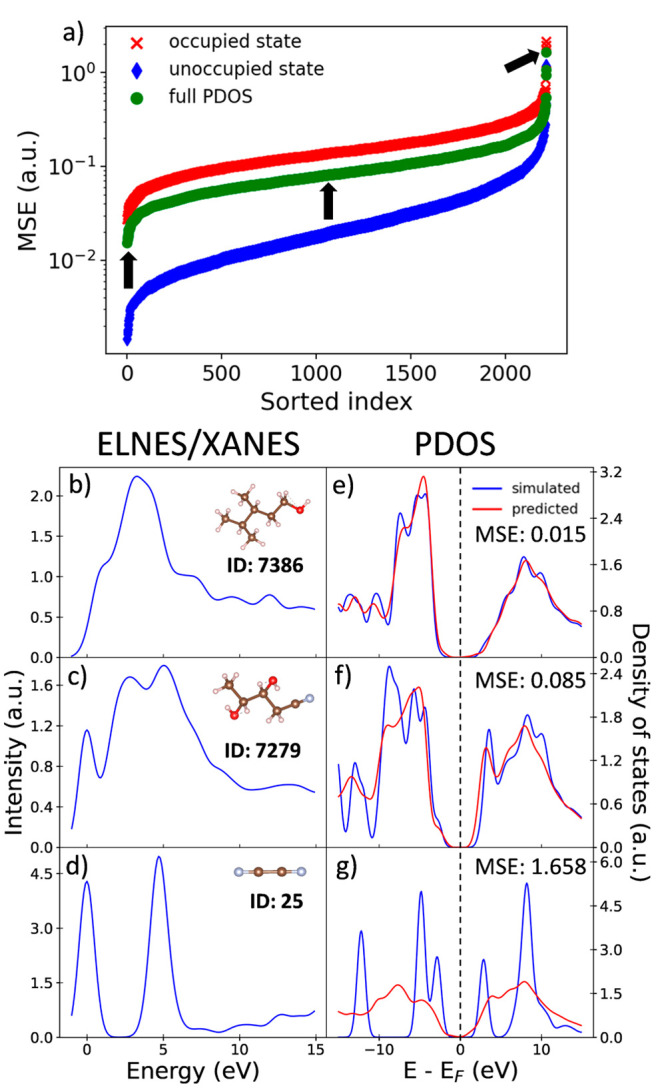
(a) Sorted MSE values of full PDOS (green circle), occupied state (red cross), and unoccupied state (blue diamond). The black arrows show the position of the best, median, and worst results according to the full PDOS MSE, whose input ELNES/XANES spectra, molecular structure, and ID in the database16,22 are shown in panels b–d and output predicted PDOS are shown in panels e–g with the Fermi level marked by the dashed line.
Panels b–d of Figure 2 show the input ELNES/XANES spectra and molecular structures of the best, median, and worst predicted results, and panels e–g of Figure 2 show corresponding predicted PDOS results. For the best prediction (Figure 2e), the predicted PDOS (red line) matches the simulated PDOS (blue line) very well in both occupied and unoccupied states, which indicates the feasibility of the PDOS prediction for the ML model. As for the median prediction (Figure 2f), the predicted curve in the unoccupied state is quite close to the simulated curve, while there is an intensity difference between the peaks of simulated and predicted curves in the occupied states, whereas the main peak positions for these two curves are almost reproduced, which shows the qualitative and reasonable prediction ability of our ML model. In the worst prediction result (Figure 2g), there is a relatively large difference between the predicted PDOS and the simulated PDOS.
In previous studies, unsupervised learning techniques, such as principal component analysis (PCA) and autoencoder, have been utilized to classify the chemical classes based on X-ray absorption and emission spectroscopy data and interpret physicochemical properties from the latent space.23,24 Therefore, to investigate the difference in the prediction, we conduct PCA from the scikit-learn package to construct the latent space of core-loss spectra, as shown in Figure S1 of the Supporting Information.25 In Figure S1 of the Supporting Information, we label the molecules with four chemical classes, the molecules without any π bond or ring (class 1), with π bonds (class 2), with rings (class 3), with both π bonds and rings (class 4). It is worth noticing that molecules without π bonds (classes 1 and 3) and with π bonds (classes 2 and 4) show two main classes, indicating that the features of core-loss spectra will be largely affected by the π bonds.
Besides, from the latent space, we can easily comprehend the prediction performance for the molecules shown in Figure 2. From the PDOS prediction results, the molecules in best and median predictions in panels b and c of Figure 2 are located both inside the main region of the latent space in panels a and b of Figure S1 of the Supporting Information, indicating that the model has been trained by a large amount of core-loss spectra similar to their spectra, whereas the molecules in the worst prediction in Figure 2d are located extremely far from the main region in latent space in Figure S1b of the Supporting Information, demonstrating that the features of the core-loss spectra are especially rare and distinct from those of other spectra in our database and cause the prediction with great error from these spectra. However, in Figure 2a, the MSEs and points in latent space of most of the predictions are similar to those of the median prediction and far from the worst prediction, indicating that our model is available to most of the molecules in our database. These results clearly demonstrate that the spectral features of ELNES/XANES have hidden information on both unoccupied and occupied states at the ground state, which can be learned by the ML model.
For a further study, the extrapolation study provides an important indication because success in extrapolation means that the regularity of PDOS prediction exists and this ML model can possibly be applied to much larger molecules.26
Figure 3a shows the average MSE values by models with different training data sets. To check the extrapolation ability, we have examined three types of training data sets, but all trainings were performed using relatively smaller molecules than 20 atoms. For the first type of training data sets, we choose the molecules with only a specific number of atoms (n) by fixing the size of the data set at 1000 to ignore the effect of the training data size, and thus, we started n from 12 in this study to obtain enough training data. The second type of training data sets includes entire molecules from the smallest molecules to the molecules with n atoms, and the last type consists of the entire molecules from n atoms to 20 atoms.
Figure 3.

(a) Training data set dependence of MSE values, where the training data set is controlled by the number of atoms n. (b) Sorted MSE values obtained from model A (1–20 atoms) and model B (18–20 atoms), and the best, median, and worst results of model A are marked by green arrows, whose input ELNES/XANES spectra and molecules are shown in panels c–e, output predicted and simulated PDOS of the model A are shown in panels f–h, and those of model B are shown in panels i–k.
The models using these three types of training data sets are hereafter called model-blue, model-green, and model-brown, which are shown as blue, green, and brown lines in Figure 3a, respectively. The three different kinds of models were applied to predict the PDOS of the larger molecules, with 21–26 atoms, as the test data. Namely, as the extrapolation, the model trained by smaller molecules was applied to predict the full PDOS of the larger molecules.
In the first model, model-blue, we compared the ELNES/XANES–PDOS correlation for the molecules with different numbers of atoms to the test data set. The result is shown in the blue line in Figure 3a, and it reveals that the average MSE value decreases with the number of atoms (n) of molecules in the training data set, which means that the larger molecules have a similar ELNES/XANES–PDOS correlation to the test data set. To explain this phenomenon, we calculated the ratio of molecules in classes 1–4 with each number of atoms, as shown in Figure S2 of the Supporting Information. It reveals that a large proportion of molecules in test data set belongs to the non-π-bonding structure (classes 1 and 3) and the proportion of molecules with the non-π-bonding structure increases as the number of atoms increases, especially for the ring structure (class 3). Hence, larger molecules will have less influence by the non-π-bonding structure and have a closer ELNES/XANES–PDOS correlation to the test data set.
The green line in Figure 3a shows the prediction result using the model-green. In this model, larger n means that the larger molecules are added to the training data set. The tendency is quite close to the model-blue, and the minimum value appeared in the model for molecules with 1–20 atoms, indicating that the addition of the larger molecules to the training data set can increase the similarity of the ELNES/XANES–PDOS correlation.
However, hereby, we cannot confirm that the main reason for the decreasing MSE value in model-green comes from an enlargement in the size of the training data set or the composition of the training data set. This reason can be understood from the results of the model-brown (brown line in Figure 3a). In the model-brown, the increase in n corresponds to removing the molecules with fewer atoms than n in the training data set. Interestingly, it shows a lowering MSE at first and a slightly but clearly better MSE while removing molecules with 18 atoms or more.
From Figure S2 of the Supporting Information, we know that a large number of smaller molecules usually contains the π-bonding structure, but in the test data set (dashed line), the non-π-bonding structure occupies a dominant position. Hence, the removal of tiny molecules will make an increase in the ratio of molecules with the non-π-bonding structure but a decrease in the size of the training data set. This can provide evidence for the primary factor for PDOS prediction.
The elimination before point n = 18 shows that the ratio of molecules without a π bond is much more important than the size of the training data set. However, when n is equal to 18, although the number of molecules with a π bond is still high, the average MSE of the PDOS prediction reaches a minimum, indicating that the training data size becomes more important starting from this region. This provides an important suggestion for the selection of the training data. Namely, the elimination of molecules with a π bond from the test molecules is important to improve the prediction accuracy. Furthermore, the composition of the training data set and the amount of training data affect the PDOS prediction, but the former has a higher priority for the PDOS prediction.
Here, two models, models A and B, are picked from the model-green and model-brown, respectively. Model A is the model trained by all molecules with up to 20 atoms in the data set, and model B is the model for molecules with 18–20 atoms and shows the best accuracy, as shown in Figure 3a. These two models were selected to obtain a detailed understanding of the influence of the tiny molecule exclusion. With the comparison of MSE values, the average MSE value for model B is 0.061, which is smaller than that for model A (0.075). Besides, as seen in the sorted MSE in Figure 3b, the curve of the MSE values of model B is lower than that of model A, indicating that the overall PDOS prediction for model B is better than that for model A.
To compare the individual prediction results, we selected the molecules in the best, median, and worst prediction results from model A, and their ELNES/XANES spectra and molecular information are shown in panels c–e of Figure 3, with corresponding PDOS prediction results by models A and B shown in panels f–h and i–k of Figure 3, respectively. For the molecules of the best result in Figure 3c, both models A and B show very similar prediction results (panels f and i of Figure 3) with similar MSE values of the predictions, 0.018 for model A and 0.021 for model B. For the median and worst predictions in panels d and e of Figure 3, the MSE values of prediction results of the same molecules in model B are lower, which are 0.068 and 0.366 for model A and 0.059 and 0.327 for model B. This result shows that model B can provide a similar or better PDOS prediction than model A. Also, the size of the training data set in model B (5848 data) is 4 times smaller than that in model A (21 042 data), indicating that removing tiny molecules can improve the PDOS prediction instead of increasing the amount of training data.
To confirm the further extrapolation ability of our model, we also constructed the molecular structure and simulated the ELNES/XANES spectra for 10 molecules, which are utilized as the industrial hardeners or epoxy molecules, including bisphenol A diglycidyl ether (DGEBA), 4,4′-diaminodicyclohexylmethane (PACM), the combination of these two molecules, DGEBA–PACM, and other 7 EPON molecules. The input ELNES/XANES spectra and prediction results by model B are shown in panels a–j and k–t of Figure 4, respectively. For these molecules, the averaged MSEs of the PDOS prediction are 0.05, which is lower than the test data of molecules with 20–26 atoms. Namely, our model can still obtains a nice PDOS prediction for these larger unknown molecules. Besides, the range of the number of atoms from these molecules is from 20 to 106, and most of the molecules in this data set consist of much more atoms than the molecules in our training data set for model B. This result indicates that our model without tiny molecules shows a great extrapolation performance and has the potential for application to larger molecules.
Figure 4.

(a–j) Simulated ELNES/XANES spectra and (k–t) PDOS prediction results from model B of DGEBA, PACM, DGEBA–PACM, and 7 EPON molecules.
Thus far, our models were trained and tested by the simulated ELNES/XANES data, where the noise was out of consideration. However, noise is bound to happen in the real experimental ELNES/XANES data originating from the equipment, the detector, and/or other external causes. Especially, Poisson noise, also known as image noise, is the dominant noise present in the experimental data and determined by signal counts recorded by the detector. Therefore, we generated the Poisson-noise-added ELNES/XANES spectra by the Poisson distribution, which can be described as P(k) = λke–λ/(k!), where λ is the expected rate of counts and k is the number of electron shot occurrences in a unit of time.27
As in the experiments, the spectral intensities were normalized by area to focus on the relative spectral shape. Figure S3a of the Supporting Information shows the noise-added ELNES/XANES spectra of the C–K edge of benzene with different λ. As the value of λ increases, there is an associated increase in the total number of counts of detected electrons in actual experimental spectra. This increase in counts leads to a better statistical sampling of the electron distribution, which tends to approach the underlying theoretical simulated spectra, especially for features that are well-resolved and sufficiently populated. Besides, we implemented smoothing preprocessing techniques to mitigate the effect of the Poisson noise. Although increasing the smoothing width can decrease the effect of noise, it may also obscure distinctive spectral features at excessively large values of the smoothing width. Therefore, for the test data set, we employed the Savitzky–Golay filter with the method of linear least squares and selected the smoothing widths of 0.3 and 0.5 eV, as shown in Figure S3b of the Supporting Information.28
First, we used the model trained by the no noise ELNES/XANES spectra to predict the PDOS from the noise-added spectra. As shown in Figure S4 of the Supporting Information, with an increase in λ, the MSE values become smaller and smoothing test data affect little for the prediction accuracy, indicating that the current model can only deal with high-λ or no noise spectra. Therefore, we retrain our model by adding noise with various λ into the original spectra to improve the prediction performance for low-λ noise-added spectra.
Figure 5 shows the MSE values of the noise-added test data obtained from the models trained by the different λ noise spectra. The results of the minimum MSE value of the no smoothing test data with the different λ are marked by the black open circles, showing that the minimum MSE of no smoothing data is usually located when the λ values of noise are the same in both training data set and test data. This result implies an important suggestion. Namely, when we want to use the experimental spectra for the prediction, the prediction model should be trained by similar noise level spectra to them to achieve better prediction accuracy.
Figure 5.
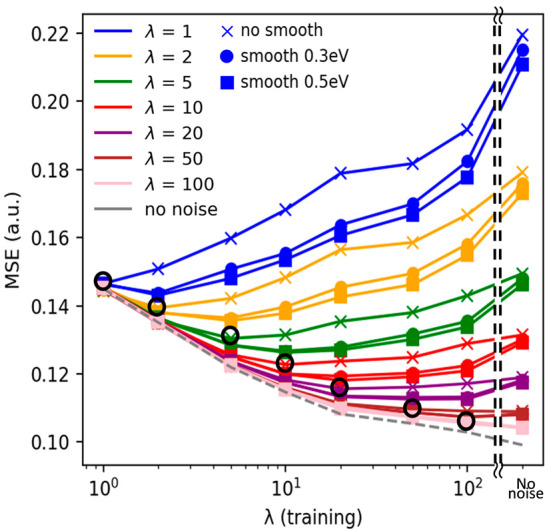
Training data set dependence of MSE values of test data with different λ and smoothing scales, where the training data are dealt with different λ. The circle (●) and square (■) symbols represent that the test data were smoothed using 0.3 and 0.5 eV, respectively, whereas the cross (×) symbol represents the MSE obtained by test data without the smoothing.
Besides, it was also found that the smoothing preprocess to the test spectra can improve the PDOS prediction performance, and the positions of the minimum MSE are shifted to the model trained by the noise-added spectra with a slightly larger λ. This would be because the smoothing of data can remove some spectral features originating from the noise and, meanwhile, make the spectra similar to that with the higher λ. In any case, those results commonly suggested that the smoothing of the test data and the selection of λ of the model are quite important to improve the PDOS prediction performance for the noise-contained spectra.
We also tried to use the augmentation of noise-added spectra to improve the prediction model, as shown in Figure S5 of the Supporting Information. However, we found that the augmentation of noise-added spectra has limited influence on improving the PDOS prediction. Therefore, instead of the augmentation using the noise-added spectra, a selection of the suitable prediction model and smoothing spectra must be the important way to achieve better PDOS prediction performance for the noise-contained spectra.
In conclusion, the molecular ground-state C s- and p-orbital PDOS including occupied and unoccupied states can be predicted from the carbon K-edge ELNES/XANES spectra qualitatively by the ML model by taking advantage of their close correlation. We found that there is a difference in the regularity of the PDOS prediction for the small molecules and the large molecules through the extrapolation analysis and that it is better to exclude the extremely small molecules from the training data to improve the PDOS prediction for larger molecules. Furthermore, toward the application, we generated Poisson noise in our ELNES/XANES spectra as the dominant noise present in experimental spectra. It is found that using smoothing preprocess and the ML model with specific λ noise data can improve the PDOS prediction from noise ELNES/XANES spectra.
Through this study, we have demonstrated that the molecular electronic structure, including both occupied and unoccupied states, at the ground state can be obtained from the core-loss spectra, with the aid of ML, which must help us understand the material properties of molecules in the ground state and accelerate the design of functional molecules.
Experimental Methods
The model we used in this study is a FNN. In the model, the input data present the intensity of the C K-edge ELNES/XANES spectrum from −1 to 15 eV in increments of 0.1 eV and the output data show the intensity of the C s- and p-orbital PDOS from −15 to 15 eV, where 0 eV is at the Fermi level. Namely, there are 160 dimensions for input and 300 dimensions for output. Between the input and output layers, we used two full connect layers as the hidden layers with 160 and 120 dimensions and used the rectified linear unit (RELU) as the activation function. We also set the dropout rate as 0.27 for each layer, except the last hidden layer, to avoid overfitting. While training, we used the MSE as the loss function and the Adam as the optimizer to optimize the trained parameters with a fixed learning rate of 0.0001.29 Besides, we applied an early stopping criterion with 500 epochs patience to obtain the parameters at the convergence situation.30
As for the database, we constructed the C K-edge core-loss spectrum and C s- and p-orbital PDOS data sets by the simulation to avoid possible accidental noise and errors. The selected 22 151 molecules were similar to those reported in the database of the previous study,16 excluding four structures that were deemed unreasonable.16,21,22 The simulation conditions used for the molecular core-loss spectrum were the same as those in ref (16). It was calculated by the sum of the site core-loss spectra, which used the first-principles plane-wave pseudopotential method with the generalized gradient approximation (GGA) using the CASTEP code with the plane-wave cutoff energy set to 500 eV.31,32 To avoid interactions between the excited carbon atoms, we used a 15 Å cubic supercell in the calculations of molecules in ref (16). For the calculation of larger molecules, we use almost the same calculation condition, except the fixed value of the cell size. On the other hand, we use the OPTADOS code to obtain the C s- and p-orbital PDOS calculation after CASTEP calculation.33 The core-loss spectra and the PDOS were broadened by a Gaussian filter with a standard deviation of 0.5 eV and normalized by dividing the integrated spectral intensity to ignore the effect of the number of C atoms.
Acknowledgments
This study was supported by the Ministry of Education, Culture, Sports, Science and Technology (MEXT, 19H00818 and 19H05787), a fund from the Institute of Industrial Science, University of Tokyo (Tenkai), and the Japan Science and Technology Agency (JST) Core Research for Evolutional Science and Technology (CREST), Japan (Grant JPMJCR1993).
Supporting Information Available
The Supporting Information is available free of charge at https://pubs.acs.org/doi/10.1021/acs.jpclett.3c00142.
The authors declare no competing financial interest.
Supplementary Material
References
- Magne D.; Mauchamp V.; Celerier S.; Chartier P.; Cabioc’h T. Site-projected electronic structure of two-dimensional Ti3C2 MXene: The role of the surface functionalization groups. Phys. Chem. Chem. Phys. 2016, 18, 30946–30953. 10.1039/C6CP05985F. [DOI] [PubMed] [Google Scholar]
- Bilyk T.; Benchakar M.; Bugnet M.; Loupias L.; Chartier P.; Pazniak H.; David M. L.; Habrioux A.; Celerier S.; Pacaud J.; et al. Electronic structure sensitivity to surface disorder and nanometer-scale impurity of 2D titanium carbide MXene sheets as revealed by electron energy-loss spectroscopy. J. Phys. Chem. C 2020, 124, 27071–27081. 10.1021/acs.jpcc.0c06798. [DOI] [Google Scholar]
- Ikeno H.; Mizoguchi T. Basics and applications of ELNES calculations. Microscopy 2017, 66, 305–327. 10.1093/jmicro/dfx033. [DOI] [PubMed] [Google Scholar]
- Ikeno H.; Mizoguchi T.; Koyama Y.; Ogumi Z.; Uchimoto Y.; Tanaka I. Theoretical fingerprints of transition metal L-2,L-3 XANES and ELNES for lithium transition metal oxides by ab initio multiplet calculations. J. Phys. Chem. C 2011, 115, 11871–11879. 10.1021/jp202383n. [DOI] [Google Scholar]
- Tieu P.; Yan X. X.; Xu M. J.; Christopher P.; Pan X. Q. Directly probing the local coordination, charge state, and stability of single atom catalysts by advanced electron microscopy: A review. Small 2021, 17, 2006482. 10.1002/smll.202006482. [DOI] [PubMed] [Google Scholar]
- Horiuchi S.; Liu Y. D.; Hanada T.; Akiyama H. Enhancement in adhesive bonding of aluminum alloy by steam treatment studied by energy loss near edge fine structures in electron energy loss spectroscopy. Appl. Surf. Sci. 2022, 599, 153964. 10.1016/j.apsusc.2022.153964. [DOI] [Google Scholar]
- Suenaga K.; Koshino M. Atom-by-atom spectroscopy at graphene edge. Nature 2010, 468, 1088–1090. 10.1038/nature09664. [DOI] [PubMed] [Google Scholar]
- Fernandez-Rossier J.; Palacios J. J. Magnetism in graphene nanoislands. Phys. Rev. Lett. 2007, 99, 177204. 10.1103/PhysRevLett.99.177204. [DOI] [PubMed] [Google Scholar]
- Rahm M.; Zeng T.; Hoffmann R. Electronegativity seen as the ground-state average valence electron binding energy. J. Am. Chem. Soc. 2019, 141, 342–351. 10.1021/jacs.8b10246. [DOI] [PubMed] [Google Scholar]
- Gilardoni F.; Weber J.; Hauser A.; Daul C. A comparison of ground- and excited-state properties of gas phase and crystalline ruthenocene using density functional theory. J. Chem. Phys. 1998, 109, 1425–1434. 10.1063/1.476693. [DOI] [Google Scholar]
- Wang S. X.; Zhu L. F. Non-resonant inelastic X-ray scattering spectroscopy: A momentum probe to detect the electronic structures of atoms and molecules. Matter Radiat. Extrem. 2020, 5, 054201. 10.1063/5.0011416. [DOI] [Google Scholar]
- Kiyohara S.; Tsubaki M.; Mizoguchi T. Learning excited states from ground states by using an artificial neural network. npj Comput. Mater. 2020, 6, 68. 10.1038/s41524-020-0336-3. [DOI] [Google Scholar]
- Mizoguchi T.; Kiyohara S. Machine learning approaches for ELNES/XANES. Microsc. 2020, 69, 92–109. 10.1093/jmicro/dfz109. [DOI] [PubMed] [Google Scholar]
- Timoshenko J.; Lu D. Y.; Lin Y. W.; Frenkel A. I. Supervised machine-learning-based determination of three-dimensional structure of metallic nanoparticles. J. Phys. Chem. Lett. 2017, 8, 5091–5098. 10.1021/acs.jpclett.7b02364. [DOI] [PubMed] [Google Scholar]
- Kiyohara S.; Tsubaki M.; Liao K.; Mizoguchi T. Quantitative estimation of properties from core-loss spectrum via neural network. J. Phys. Mater. 2019, 2, 024003. 10.1088/2515-7639/ab0b68. [DOI] [Google Scholar]
- Shibata K.; Kikumasa K.; Kiyohara S.; Mizoguchi T. Simulated carbon K edge spectral database of organic molecules. Sci. Data 2022, 9, 214. 10.1038/s41597-022-01303-8. [DOI] [PMC free article] [PubMed] [Google Scholar]
- Burns G.Solid State Physics; Academic Press: New York, 2016. [Google Scholar]
- Bock H. Molecular states and molecular orbitals. Angew. Chem., Int. Ed. Engl. 1977, 16, 613–637. 10.1002/anie.197706131. [DOI] [Google Scholar]
- Jorissen K.Advances in the ab initio calculation of electron energy loss spectroscopy. Ph.D. Thesis, The University of Antwerpen, Antwerpen, Belgium, 2007; https://feff.phys.washington.edu/PAPERS/dissertations/thesis_jorissen.pdf (accessed 2022–11–07). [Google Scholar]
- Morishita T.; Ueno T.; Panomsuwan G.; Hieda J.; Yoshida A.; Bratescu M. A.; Saito N. Fastest formation routes of nanocarbons in solution plasma processes. Sci. Rep. 2016, 6, 36880. 10.1038/srep36880. [DOI] [PMC free article] [PubMed] [Google Scholar]
- Ruddigkeit L.; van Deursen R.; Blum L. C.; Reymond J. L. Enumeration of 166 billion organic small molecules in the chemical universe database GDB-17. J. Chem. Inf. Model. 2012, 52, 2864–2875. 10.1021/ci300415d. [DOI] [PubMed] [Google Scholar]
- Ramakrishnan R.; Dral P. O.; Rupp M.; von Lilienfeld O. A. Quantum chemistry structures and properties of 134 kilo molecules. Sci. Data 2014, 1, 140022. 10.1038/sdata.2014.22. [DOI] [PMC free article] [PubMed] [Google Scholar]
- Tetef S.; Kashyap V.; Holden W. M.; Velian A.; Govind N.; Seidler G. T. Informed chemical classification of organophosphorus compounds via unsupervised machine learning of X-ray absorption spectroscopy and X-ray emission spectroscopy. J. Phys. Chem. A 2022, 126, 4862–4872. 10.1021/acs.jpca.2c03635. [DOI] [PubMed] [Google Scholar]
- Routh P. K.; Liu Y.; Marcella N.; Kozinsky B.; Frenkel A. I. Latent representation learning for structural characterization of catalysts. J. Phys. Chem. Lett. 2021, 12, 2086–2094. 10.1021/acs.jpclett.0c03792. [DOI] [PubMed] [Google Scholar]
- Pedregosa F.; Varoquaux G.; Gramfort A.; Michel V.; Thirion B.; Grisel O.; Blondel M.; Prettenhofer P.; Weiss R.; Dubourg V. Scikit-learn: Machine learning in Python. J. Mach. Learn. Res. 2011, 12, 2825–2830. [Google Scholar]
- Tsubaki M.; Mizoguchi T. Quantum deep field: Data-driven wave function, electron density generation, and atomization energy prediction and extrapolation with machine learning. Phys. Rev. Lett. 2020, 125, 206401. 10.1103/PhysRevLett.125.206401. [DOI] [PubMed] [Google Scholar]
- Jin X. D.; Hirakawa K.. Approximations To Camera Sensor Noise. Proceedings of Image Processing: Algorithms and Systems XI; Burlingame, CA, Feb 4–6, 2013; Egiazarian K. O., Agaian S. S., Gotchev A. P., Eds.; SPIE: Bellingham, WA, 2013; Vol. 8655, 10.1117/12.2019212. [DOI]
- Press W. H.; Teukolsky S. A. Savitzky-Golay smoothing filters. Comput. Phys. 1990, 4, 669–672. 10.1063/1.4822961. [DOI] [Google Scholar]
- Kingma D. P.; Ba J. Adam: A method for stochastic optimization. arXiv.org, e-Print Arch., Comput. Sci. 2014, arXiv:1412.6980. 10.48550/arXiv.1412.6980. [DOI] [Google Scholar]
- Prechelt L. Automatic early stopping using cross validation: Quantifying the criteria. Neural Netw. 1998, 11, 761–767. 10.1016/S0893-6080(98)00010-0. [DOI] [PubMed] [Google Scholar]
- Segall M. D.; Lindan P. J. D.; Probert M. J.; Pickard C. J.; Hasnip P. J.; Clark S. J.; Payne M. C. First-principles simulation: Ideas, illustrations and the CASTEP code. J. Phys.: Condens. Matter 2002, 14, 2717–2744. 10.1088/0953-8984/14/11/301. [DOI] [Google Scholar]
- Mizoguchi T.; Tanaka I.; Gao S.-P.; Pickard C. J. First-principles calculation of spectral features, chemical shift and absolute threshold of ELNES and XANES using a plane wave pseudopotential method. J. Phys.: Condens. Matter 2009, 21, 104204. 10.1088/0953-8984/21/10/104204. [DOI] [PubMed] [Google Scholar]
- Morris A. J.; Nicholls R. J.; Pickard C. J.; Yates J. R. OptaDOS: A tool for obtaining density of states, core-level and optical spectra from electronic structure codes. Comput. Phys. Commun. 2014, 185, 1477–1485. 10.1016/j.cpc.2014.02.013. [DOI] [Google Scholar]
Associated Data
This section collects any data citations, data availability statements, or supplementary materials included in this article.