

Abstract
The tumor-associated vasculature imposes major structural and biochemical barriers to the infiltration of effector T cells and effective tumor control. Correlations between stimulator of interferon genes (STING) pathway activation and spontaneous T cell infiltration in human cancers led us to evaluate the effect of STING-activating nanoparticles (STANs), which is a polymersome-based platform for the delivery of cyclic dinucleotide STING agonist, on the tumor vasculature and attendant effects on T cell infiltration and antitumor function. In multiple mouse tumor models, intravenous administration of STANs promoted vascular normalization, evidenced by improved vascular integrity, reduced tumor hypoxia, and increased endothelial cell expression of T cell adhesion molecules. STAN-mediated vascular reprogramming enhanced the infiltration, proliferation, and function of antitumor T cells and potentiated the response to immune checkpoint inhibitors and adoptive T cell therapy. We present STANs as a multimodal platform that activates and normalizes the tumor microenvironment to enhance T cell infiltration and function and augments responses to immunotherapy.
Keywords: STING, vascular normalization, immunotherapy, immune checkpoint blockade, adoptive T cell transfer, nanoparticle
Introduction:
Antigen-specific immune recognition and elimination of cancer cells requires effector T cells, typically cytotoxic CD8+ T cells, to extravasate across vasculature endothelium and into the tumor microenvironment (TME) (1, 2). The infiltration of T cells into tumors is critical to the efficacy of approved and emerging immunotherapies for solid malignancies, including immune checkpoint blockade (ICB), therapeutic cancer vaccines, adoptive T cell transfer, and CAR-T cell therapy (3, 4). However, tumors highjack multiple mechanisms to thwart T cell recognition, including recruitment of immunosuppressive cell populations (e.g., myeloid derived suppressor cells (MDSCs), regulatory T cells (Tregs), loss of or downregulation of tumor antigens and/or MHC molecules, expression and engagement of immune checkpoint molecules, and dysregulated metabolism (4–6). Additionally, tumor vasculature is often malformed and dysfunctional, characterized by a chaotic, leaky network of immature microvessels with reduced pericyte support (7–9). The resulting hypoxia and acidosis in the TME trigger the production of immunosuppressive factors that inhibit T cell homing, extravasation, and antitumor effector function. Hence, dysfunctional tumor vasculature presents a major physical and biochemical bottleneck to T cell infiltration and function and, consequently, therapeutic responses to many immunotherapeutic modalities (8, 10, 11).
The correction of these tumor vessel abnormalities through a process known as vascular normalization (12) has the potential to enhance T cell infiltration and function and increase responses to immunotherapy (13). There have been several recent investigations focused on evaluating immunotherapies in combination with agents that can promote vascular normalization (14–17). Anti-angiogenic agents, when combined with ICB and other immunotherapies, can enhance therapeutic responses by inducing vascular normalization (18–23). Combinations of ICB and anti-VEGF or anti-VEGFR agents are approved for several cancers (24–26), but the relative contribution of vascular reprogramming on T cell infiltration and improved responses is not well understood. Further, for many cancer types, these responses are incomplete and may be of limited durability and are thus unlikely to improve outcomes. This motivates the need to discover new approaches for reprogramming the tumor vasculature to enhance the infiltration, proliferation, and function of antitumor T cells.
The cGAS/STING pathway links innate and adaptive anti-tumor immunity and is a major determinant of T cell infiltration (27, 28). Tumor-derived DNA activates cyclic-GMP-AMP synthase (cGAS), producing cGAMP, which binds to STING and triggers a type I interferon (IFN-I)-driven inflammatory response, including the production of T cell chemokines (29). Accordingly, increased CD8+ T cell infiltration is correlated with increased expression of IFN-I and interferon stimulated genes (ISGs) driven by STING signaling (30, 31). Recent investigations have dissected the link between STING signaling and vascular transmigration of T cells (32–36); however, pharmacological STING activation has had dichotomous effects on the tumor vasculature (32, 33, 37–39). Most investigations have used intratumoral injection of cyclic dinucleotide (CDN) STING agonist injections in mice to mimic the current clinical scenario in which CDNs are intratumorally administered (32, 33, 40). However, many patients are ineligible due to poor accessibility of their tumors and clinical results of intratumoral STING agonists have been underwhelming (27).
Intralesional administration is in part necessitated by the poor drug-like properties of CDNs, which are rapidly cleared from the circulation with minimal accumulation at tumor sites or cellular uptake following intravenous administration, and, hence, fail to activate STING in the TME, resulting in negligible therapeutic efficacy (27, 40, 41). To address this challenge, several groups have developed nanoparticle-based drug carriers to improve the pharmacological properties of CDNs for systemic administration (27, 42). Our group has recently described STING-activating nanoparticles (STANs) that are based on polymer vesicles (i.e., polymersomes) engineered to enhance the intracellular delivery and pharmacological properties of CDNs (43). This technological advancement also allows CDNs to be administered systemically, thereby affording an opportunity herein to investigate the effects of systemic, intravenous cGAMP administration on the tumor vasculature and endothelial cell-T cell interactions, to evaluate STANs as a strategy for coordinating activation of antitumor innate immunity with vascular remodeling to enhance T cell infiltration, and to pharmacologically reprogram the vascular-immune interface to potentiate responses to both established and emerging T cell-based immunotherapies.
Results:
Systemic administration of STANs activates STING signaling in the TME to promote vascular normalization
We first evaluated the therapeutic efficacy of STANs in a syngeneic murine RenCa tumor model of renal cell carcinoma (RCC) (Fig. 1A), a notoriously vascularized and hypoxic tumor type (44). We performed a dose-finding study using a treatment regimen that we have previously described (41), varying the cGAMP dose between 10 μg and 2.5 μg. Intravenous administration of STANs at 10 μg cGAMP, but not 5 μg or 2.5 μg (Fig. S1), inhibited RenCa tumor growth and increased survival (Fig. 1B–D), prompting our selection of a 10 μg dose for all subsequent studies. Additionally, empty nanoparticles (NP) and free cGAMP administered at equivalent doses of polymer had no therapeutic effect (Fig. 1B–D). Activation of the STING pathway at the tumor site resulted in increased expression of type-I interferon, ISGs, and pro-inflammatory cytokines (Fig. 1E–J). We also found that the therapeutic STAN regimen significantly decreased the expression of several genes involved in angiogenesis and vascular destabilization, including Hif1a (P≤0.01), Vegfa (P≤0.01), Angpt2 (P≤0.05), and Tgfb (P≤0.01) 24 h following the final administration, whereas empty NPs and free cGAMP had no effect (Fig. 1I–N). STANs, but not control groups, increased expression of Icam and Vcam (Fig. 1O–P), cell adhesion molecules expressed by endothelial cells that are important for T cell homing and transmigration across the vascular endothelium, but are often downregulated in tumor vessels, resulting in impaired T cell infiltration (1). We observed a similar pattern of STAN-mediated changes in gene expression in the TME in a syngeneic murine EO771 model of breast cancer (Fig. S2). We postulated that intravenous administration of STANs would result in tumor vasculature normalization and performed a pilot study to evaluate changes in gene expression markers associated with STING activation and vascular normalization at 2, 4, and 6 days following the three-dose STAN regimen (Fig. S4). The response returned to baseline after six days, which was consistent both with the transient response to STING agonists (41, 45) as well as vascular normalization induced by other anti-angiogenics (e.g., VEGF inhibitors) (7).
Figure 1. Systemic administration of STANs stimulates an anti-angiogenic inflammatory response in the tumor microenvironment to inhibit tumor growth.

(A) Schematic of RenCa tumor inoculation and treatment schedule. Mice with subcutaneous ~50 mm3 RenCa tumors were intravenously administered PBS (vehicle), empty nanoparticle (NP), free cGAMP, or STAN three times as indicated, and tumor volume was monitored. (B-D) Spider plots of individual tumor growth curves (B), tumor growth curves (C), and Kaplan-Meier survival curves (D) of RenCa tumor bearing mice treated with the indicated formulation (n=5 mice/group). Tumor growth curves are presented as mean ± SEM with P value determined by two-way ANOVA with post-hoc Tukey’s correction for multiple comparisons; ****P<0.0001 on day 21 for all groups compared to STAN. Kaplan-Meier survival curves of mice treated with indicated formulation using 1500 mm3 tumor volume as endpoint criteria with P value was determined by log-rank test; **P≤0.01 compared to PBS control. (E) Schematic of RenCa tumor inoculation, treatment schedule, and analysis time points. Mice with RenCa tumors of ~100 mm3 were administered PBS, empty nanoparticle (NP), free cGAMP, or STAN three times as indicated, and tumors were harvested at 24 h after the 3rd injection for qRT-PCR and Western blot analysis. (F) Western blot analyses for p-IRF3, total IRF3, and STING in RenCa tumors 24 h following the final administration of STANs or controls (n=2 mice/group). Blots shown are representative of 3 independent experiments with similar results (see Fig. S3). (G-P) qRT-PCR analysis of tumor tissue 24 h following the final administration of STANs or indicated controls to evaluate changes in expression of type-I interferon, interferon-stimulated genes, and pro-inflammatory cytokines (G-J), markers of angiogenesis and vascular remodeling (K-N), and leukocyte adhesion molecules (O-P) (n=3–6 mice/group). Data shown as mean ± SEM. P value determined by one-way ANOVA with post-hoc Tukey’s correction for multiple comparisons; *P≤0.05, **P≤0.01, and ***P≤0.001 compared to PBS control.
We selected 48 h following the STAN treatment regimen to evaluate effects on the tumor vasculature, first assessing levels of hypoxia in tumor tissue (Fig. 2A) via administration of pimonidazole followed by immunofluorescent staining of tumor sections with anti-pimonidazole antibodies (Hypoxyprobe™). We found that treatment with STANs, but not free cGAMP or empty NPs, significantly reduced pimonidazole staining by ~70–80% in RenCa tumors (P≤0.001) (Fig. 2B–C), suggesting a potential involvement of STING signaling in alleviating hypoxia. We explored the effect of STAN treatment on the structure and function of tumor vasculature and found that treatment with STANs resulted in a >10-fold decrease in blood vessel density within the TME using CD31 staining as a marker of vascular endothelium (Fig. 2B,D). This was also associated with a 7-fold increase in staining for α-smooth muscle actin (αSMA) (Fig. 2B,E), a marker of pericytes that surround the vascular endothelium that is commonly used as an indicator of blood vessel function and integrity (46). We evaluated vascular perfusion via intravenous administration of a FITC-labeled lectin and found that STANs enhanced vascular perfusion by ~20-fold over controls (Fig. 2B,F). Improved vascular integrity was further confirmed via intravenous administration of a 40 kDa FITC-labeled dextran, upon which we observed that STAN treatment decreased vascular permeability by 80% (Fig. 2B,G). To assess the extensibility of our findings to another tumor model and in another strain of mouse (i.e., C57BL/6), we repeated these studies in an orthotopic EO771 breast cancer model with similar results (Fig. S5). These studies demonstrate that systemically administered STANs exert anti-angiogenic effects, normalize tumor vasculature, and reduce hypoxia in the TME in two different syngeneic mouse tumor models.
Figure 2. Systemic administration of STANs induces normalization of tumor vasculature.

(A) Schematic of RenCa tumor inoculation, treatment schedule, and analysis time points. Mice with ~100 mm3 RenCa tumors were administered PBS (vehicle), empty nanoparticle (NP), free cGAMP, or STAN three times as indicated. Two days after the 3rd dose, pimonidazole hydrochloride was injected intravenously 60 min before euthanasia and tumor harvesting; dextran or lectin was intravenously injected 30 min prior to euthanasia. (B) Representative fluorescent micrographs and (C-G) quantification of RenCa tumor tissue following (C) Hypoxyprobe (green) staining; (D) CD31+ blood vessel density (green) and (E) αSMA pericyte (yellow) coverage; (F) lectin perfusion of tumor vessels (green); and (G) dextran leakage area in tumor tissue (green) for PBS, NP, cGAMP, and STAN treated mice. (H) Schematic of RenCa tumor inoculation, treatment schedule, and analysis time points. Starting on day 13, mice were administered PBS (vehicle) or STAN three times as indicated. Depleting or blocking antibodies (αIFNAR1, αTNFα, or αCD8 antibody) were administered on days 12, 15, 18 (indicated by green arrows) by intraperitoneal (IP) injection. Tumors were harvested for staining two days after the 3rd STAN dose. (I) Tumor growth curves of RenCa tumor bearing mice treated with PBS, STANs, or STANs with depleting/blocking antibodies (n=6–8 mice/group). Tumor growth curves are presented as mean ± SEM with P value determined by two-way ANOVA with post-hoc Tukey’s correction for multiple comparisons; *P≤0.05 and **P≤0.01 on day 21 compared to STAN. (J) Representative fluorescent micrographs and (K-L) quantification of RenCa tumor tissue following indicated treatment and stained for (K) CD31+ blood vessel density (red) and (L) NG2+ pericyte coverage (green). (B,J) For all images, scale bars are 50 μm. (C-G, K-L) *P≤0.05, **P≤0.01, ***P≤0.001, and ****P<0.0001 indicate a statistically significant difference compared to PBS using a 1-way ANOVA with post-hoc Tukey’s correction for multiple comparisons (C-G, n=3 mice/group; K-L, 6–8 mice/group).
We evaluated the effect of TNFα and type I IFNs on antitumor efficacy and vascular normalization following STAN treatment in the RenCa model (Fig. 2H–L). We found that antibody blockade of TNFα significantly reduced STAN treatment efficacy (P≤0.01), with an associated decrease in the degree of NG2+ pericyte coverage, a hallmark of vascular normalization. Antibody blockade of IFNAR1 did not impact the capacity of STANs to inhibit tumor growth nor effect the degree of NG2+ pericyte coverage. Based on previous work describing reciprocal crosstalk between tumor-infiltrating T cells and vascular normalization (8), we found that therapeutic response to STANs in the RenCa model were largely dependent on CD8+ T cells (Fig. 2I), which also contributed to vascular normalization (Fig. 2J–L).
STANs exert immunostimulatory activity in human kidney cancer
We established a simple ex vivo culture model in which freshly resected human RCC tissue is dissected into ~30 mm3 cubes and directly injected with STANs or controls (Fig. 3A). We obtained tumor tissue from two RCC patients, dissected tumors into sections, treated with STANs or NPs, free cGAMP, or PBS as controls, and measured gene expression of STING-associated cytokines (Ifnb1, Cxcl10, Il12) as well as markers associated with vascular remodeling (Hif1a, Vegfa, Icam1) via qRT-PCR (Fig. 3B). Consistent with our findings in the RenCa mouse model, STANs demonstrated superior immunostimulatory activity compared to control groups as evidenced by increased expression of Ifnb1, Cxcl10, and Il12. In tumors isolated from both patients (patient 1 and 2), treatment with STANs decreased levels of Vegfa and increased expression of Icam1 with trends towards decreased expression of Hif1a (Fig. 3B). Based on this data, we obtained an additional 5 tumor specimens (patients 3–7) and performed Nanostring analysis (Nanostring IO360) on sections of tissue treated with STANs or PBS (vehicle) (Figure 3C–E). As anticipated, STAN treatment increased the expression of several ISGs, including IFITs, OASL, IFIH1, OAS2/3, IRF7, and MX1, amongst others, consistent with a type-I interferon response. STANs elevated levels of several T cell chemokines, including CXCL9 and CCL5, as well as the costimulatory molecule CD80, all consistent with a STING-driven inflammatory response. While changes in the expression of genes associated with angiogenesis and vascular remodeling were more variable between specimens, some trends similar to those observed in the RenCa and EO771 models emerged, including trends towards increased expression of the endothelial cell activation markers VCAM1, SELL (L-selectin), and SELP (P-selectin), decreased expression of HIF1A in 4/5 patient samples, and trends towards increased expression of ANGPT1, which is associated with vascular stabilization, in 4/5 patient samples. Interestingly, the largest fold decrease in expression in response to STAN treatment was observed for CXCL5, which has been shown to induce angiogenesis (47). However, unlike in our first two patient samples, changes in the expression of ANGPT2, which STANs inhibited the expression of in vivo, was variable between specimens. While STANs enhance STING pathway activation in all patient samples, gene expression changes related to vascular remodeling are heterogeneous, likely due to patient variability, cellular composition of resected tissue, and lack of perfusion in the ex vivo model, which limits oxygen and nutrient exchange and immune cell migration. Nonetheless, these results validate the activation of STANs in tumors derived from seven RCC patients and offers initial evidence supporting the potential use of STANs as a strategy to coordinate antitumor innate immunity and vascular remodeling in human RCC.
Figure 3. STANs potentiate STING signaling in human renal cell carcinoma.

(A) Schematic of ex vivo culture model of human renal cell carcinoma tissue. (B) qRT-PCR analysis of ex vivo cultured human renal cell carcinoma tissue following the final administration of STAN or controls to evaluate changes in gene expression. *P≤0.05, **P≤0.01, ***P≤0.001, and ****P<0.0001 indicate a statistically significant difference compared to STAN using a 1-way ANOVA with post-hoc Tukey’s correction for multiple comparisons (n=2–3 sections of tumor per patient). (C) Volcano plots of changes in gene expression (log2) between human RCC specimens treated with PBS and STANs. (D) Heat map of normalized gene expression represented by z-scores for five human RCC specimens treated with PBS or STAN. (E) Scatter plots for individual patients of the fold change in selected genes associated with vascular remodeling in response to treatment with STAN.
STAN-mediated vascular normalization enhances tumor accumulation of antibodies and nanoparticles
Aberrant tumor vasculature has also been shown to limit the tumor perfusion and accumulation of a variety of therapeutics, including chemotherapeutics, antibodies, and nanoparticle drug carriers (e.g., liposomes), and there is evidence that vascular normalization can enhance drug delivery to tumor sites (48–52). To assess whether this occurs in response to STANs, and as a secondary indicator of vascular normalization, we examined tumor accumulation of a fluorescently-labeled IgG antibody using whole animal IVIS imaging (Fig. 4A–C). Consistent with previous reports using other vascular normalization strategies (50), we found that STANs enhanced tumor accumulation of antibody by 2-fold at 6 h and 3-fold by 24 h (Fig. 4B–C). It has also been previously reported that vascular normalization can enhance the accumulation of nanoparticles (48, 50, 53). We examined this possibility by using flow cytometry to analyze the cellular uptake profile of fluorescently-labeled polymer nanoparticles (Cy5-labeled polymersomes; Cy5-NP) as a model nanocarrier 24 h following a three-treatment regimen with STANs to induce vascular normalization (Fig. 4D–E). Following STAN treatment, we found that Cy5-NP were endocytosed to a much greater extent by multiple cell populations within the TME, including CD45−CD31+ endothelial cells, CD11b+F4/80+ macrophages, MHC-II+CD11c+ DCs, and CD45− cells (Fig. 4E), the latter of which is likely comprised mostly of tumor cells. These results are further supported by immunofluorescence analysis of tumor sections (Fig. 4F–G) demonstrating increased degree of colocalization between polymer and markers of ECs (CD31), macrophages (F4/80), and DCs (CD11c).
Figure 4. Vascular normalization induced by systemic STAN administration enhances antibody and nanoparticle accumulation and penetration in tumors.

(A) Schematic of RenCa tumor inoculation, treatment schedule, and time points for analysis of tumor antibody distribution. Mice with ~100 mm3 RenCa tumors were administered PBS or STANs 3 times as indicated. Two days after the 3rd dose, AlexaFluor680-IgG (10 mg/kg) antibody was administered intravenously (IV), and mice were imaged using IVIS (B) 6 h or (C) 24 h after antibody injection. (B-C) Left: Representative fluorescence IVIS images showing the accumulation of AlexaFluor680-IgG antibody in RenCa tumors. Right: Quantification of fluorescent antibody accumulation in tumors via measurement of fluorescent radiant efficiency at the tumor site. (D) Schematic of RenCa tumor inoculation, treatment schedule, and time points for analysis of Cy5-labeled polymer nanoparticle (Cy5-NP) distribution. Mice with ~100 mm3 RenCa tumors were administered PBS or STAN 3 times as indicated. One day following the 3rd STAN administration, Cy5-NP were then injected IV, and tumors were harvested 24 h later for analysis by flow cytometry and immunofluorescence microscopy (IF). (E) Flow cytometry analysis of cellular uptake of Cy5-NP 24 h post-injection. Data are plotted as the percentage of each indicated cell population that are Cy5+ within the tumor (EC: endothelial cells; DC: dendritic cells; Mφ: macrophages). (F) Representative images and (G) quantification of Cy5-NP colocalization with CD31 (red), F4/80 (red), and CD11c (red). DAPI staining is represented in blue. Image magnification: 200x; scale bar: 100 μm. (H) Schematic of RenCa tumor inoculation, treatment schedule, and time points for analysis of gold nanoparticles accumulation in tumors. Mice with ~100 mm3 RenCa tumors were administered PBS or STAN 3 times as indicated. PEGylated 20 nm gold nanoparticles were then injected IV, and tumors were harvested for analysis of gold content via ICP-MS. (I) ICP-MS quantification of gold accumulation within tumors. All results are the mean ± SEM (B-C, n=8–12 mice/group; E, n=10–13 mice/group; G, n=5 mice/group; I, n=8 mice/group). **P≤0.01 and ****P<0.0001 indicate a statistically significant difference between STAN and PBS as determined by Student’s t-test.
Immunofluorescent images (Fig. 4F) also suggested an increased overall level of Cy5-NP accumulation in response to STAN treatment. We tested the hypothesis that STING-induced vascular normalization could enhance nanoparticle accumulation at tumor sites using 20 nm PEGylated gold NPs, which allow for highly sensitive quantification of NP accumulation via inductively coupled plasma mass spectrometry (ICP-MS) (Fig. 4H–I). Consistent with our analysis of polymer nanoparticle accumulation, we found that treatment with STANs resulted in a nearly 20-fold increase in the mass of gold that distributed to the tumor, resulting in over 1% of injected dose at the tumor site (Fig. 4I). Collectively, these data support our finding that intravenously administered STAN promotes vessel normalization while also highlighting the opportunity to coordinate STING activation with enhanced delivery of therapeutics that may act synergistically with STING to promote antitumor immunity (e.g., chemotherapy, ICB, etc.).
STANs activate the tumor vascular endothelium to enhance T cell transmigration
Tumor-associated endothelial cells express lower levels of cell adhesion molecules, such as vascular cell adhesion protein 1 (VCAM-1) and intercellular adhesion molecule 1 (ICAM-1), which promotes endothelial cell anergy and reduces the trafficking of T cells into tumors (1). Based on our findings that STANs normalize tumor vasculature and increase tumor-level gene expression of Icam1 and Vcam1, we evaluated the effects of intravenously administered STANs on tumor-associated EC activation (Fig. 5A). Consistent with gene expression analysis, STANs significantly increased the surface expression level of ICAM-1 (P<0.0001) and VCAM-1 (P≤0.05) on CD45−CD34+CD31+ tumor-associated endothelial cells in the RenCa model (Fig. 5B). As expected, we also observed a significant increase in the number of tumor-infiltrating CD8+ (P<0.0001) and CD4+ (P≤0.001) T cells in RenCa tumors 24 h following the three treatment STAN regimen (Fig. 5C). We evaluated surface expression of the T cell activation marker CD69, finding that STANs increased the frequency of CD69+CD8+ and CD69+CD4+ T cells the tumor as well as the spleen (Fig. 5D–E), where both T cell priming and activation can occur in response to systemic immunotherapy (54). Although CD8+ T cells are a major cellular effector in response to STAN treatment in the RenCa model (Fig. 4F–G), STANs also increase tumor infiltration of other immune cell populations, including macrophages (CD11b+F4/80+), dendritic cells (MHC-II+CD11c+), neutrophils (CD11b+Ly6Glo), and granulocytic myeloid-derived suppressor cells (MDSCs; CD11b+Ly6Ghi) (Fig. S6); the contribution of these other cell types on the tumor vasculature and on T cell infiltration remains to be elucidated.
Figure 5. STANs activate vascular endothelial cells to enhance T cell transmigration.

(A) Schematic of RenCa tumor inoculation, treatment schedule, and time points for flow cytometric analysis of tumor. (B) Flow cytometric analysis of the frequency of CD54+ (ICAM-1) and CD106+ (VCAM-1) CD34+CD31+ ECs in subcutaneous RenCa tumors following treatment with STANs or PBS. (C) Flow cytometric analysis of the number (cells/mg tumor) of CD8+ T cells and CD4+ T cells in RenCa tumors 24 h following treatment with STANs or PBS. Flow cytometric analysis of the percentage of CD69+ CD8+ (D) and CD4+ (E) T cells in RenCa tumors and the spleen following treatment with STAN or PBS. (F) Western blot analyses for p-IRF3, total IRF3, and STING in bEnd.3 and MS1 murine endothelial cells. STAN treated lanes are normalized to PBS per cell type. (G-H) qRT-PCR analyses for comparison of Icam1 (G) and Vcam1 (H) expression in bEnd.3 and MS1 murine endothelial cells in response to STAN. (I) Quantification of activated CD8+ T cell transendothelial migration in response to treatment of MS1 ECs with STANs and effect of combined antibody blockade of ICAM1 and VCAM1 on T cell migration. All data are shown as mean ± SEM. (B-E, n=4–10 mice/group; G-H, n=3 biological replicates). *P≤0.05, ***P≤0.001, and ****P<0.0001 indicate a statistically significant difference determined by Student’s t test. (I, n=3 biological replicates). ****P<0.0001 indicates a statistically significant difference compared to the STAN only treated group using a 1-way ANOVA with post-hoc Tukey’s correction for multiple comparisons.
To investigate the effect of endothelial cell STING activation on T cell transmigration, we used an in vitro transwell co-culture model in which murine ECs cells were cultured as a monolayer on the transwell membrane and treated with STANs or controls, followed by the addition of CD3/CD28-bead activated murine CD8+ T cells into the insert and quantification of T cell migration across the EC monolayer (Fig. 5F–I). We first validated that murine MS1 cells express STING, which is activated in response to STANs (Fig. 5F) resulting in expression of Icam1 and Vcam1 (Fig. 5G–H). We next demonstrated that this STAN-driven activation of the endothelial monolayer resulted in enhanced CD8+ T cell transmigration, which could be blocked using a cocktail of anti-VCAM1 and anti-ICAM1 antibodies (Fig. 5I), confirming the dependence on STAN-induced EC activation on T cell migration.
We evaluated the impact of STAN-mediated tumor vascular reprogramming on the infiltration and function of both endogenous and adoptively transferred, antigen-specific activated CD8+ T cells. We transferred CD3/CD28 bead-activated CD8+ T cells isolated from OT-I transgenic mice with T cell receptors that are specific for the immunodominant epitope from ovalbumin (OVA), SIINFEKL, into mice with OVA-expressing EO771 (EO771-OVA) orthotopic breast tumors (55). When tumor volume reached a size of ~100–150 mm3, mice were treated systemically with STANs or vehicle (PBS) using the treatment regimen demonstrated to also induce vascular normalization, followed by intravenous administration of OT-I T cells 48 h after the last STAN administration (Fig. 6A). In this study, OT-I T cells that express both CD45.1 and CD45.2 were used to allow for discernment of adoptively transferred (CD45.1+CD45.2+) and endogenous T cells (CD45.2+) via flow cytometry. Consistent with findings in the RenCa model (Fig. 5C), we observed a 4.6-fold increase in endogenous T cell infiltrate in response to STANs, but also a 17-fold increase in the number of infiltrating adoptively transferred (CD45.1+) OT-I T cells relative to mice that received only vehicle (PBS) (Fig. 6B).
Figure 6. STAN-mediated vascularization remodeling increases the infiltration of endogenous and adoptively transferred, antigen-specific activated CD8+ T cells.

(A) Schematic of EO771-OVA tumor inoculation, treatment and T cell transfer schedule, and time point for flow cytometric analysis of T cell infiltration. (B) Flow cytometric analysis of the number (cells per mg tumor) of endogenous (CD45.2+) and transferred OT-I (CD45.1+) CD8+ T cell into tumors following administration of PBS (vehicle) or STAN. (C) Schematic of EO771-OVA tumor inoculation, treatment and T cell transfer schedule, and time point for flow cytometric analysis of T cell phenotype. (D) Flow cytometric analysis of the frequency of adoptively transferred Thy1.1+ OT-I positive CD8+ T cell in tumors and spleens following treatment with STANs of PBS. (E-G) Flow cytometric analysis of the frequency of CD69+ (E), Ki67+ (F), and IFNγ+TNFα+ (G) endogenous (Thy1.1−) CD8+ T cells in tumors and spleens following STAN or PBS treatment. (H-J) Flow cytometric analysis of the frequency of CD69+ (H), Ki67+ (I), and IFNγ+TNFα+ (J) adoptively transferred OT-I (Thy1.1+) CD8+ T cells in tumors and spleens following STAN or PBS treatment. (K-L) Flow cytometric analysis of the frequency of Ki67+ (K) and IFNγ+TNFα+ (L) CD4+ T cells in tumors and spleens following STAN or PBS treatment. All data shown as mean ± SEM. (B, n=6–11 mice/group; D-L, n=8–10 mice/group). *P≤0.05, **P≤0.01, ***P≤0.001, ****P<0.0001 determined Student’s t-test.
We next assessed the phenotype of both endogenous and adoptively transferred T cells in the TME as well as the spleen, here via adoptive transfer of activated Thy1.1+ OT-I T cells in mice with orthotopic EO771-OVA breast tumors (Fig. 6C). STAN treatment resulted in an increased frequency of Thy1.1+ OT-I T cells in the tumor as well as the spleen (Fig. 6D). STANs also increased the frequency of CD69+ and Ki67+ endogenous Thy1.1−CD8+ T cells in the tumor and spleen, which was also associated with an increased frequency of polyfunctional IFNγ+TNFα+ CD8+ T cells (Fig. 6E–G). Similarly, there was an increased frequency of activated (CD69+) and proliferating (Ki67+) OT-I T cells in the tumor, while the degree of polyfunctionality (CD8+IFNγ+TNFα+) was not affected (Fig. 6H–J; minimal differences were observed in the spleen. Similar trends were observed for endogenous CD4+ T cells with an increased percentage of Ki67+CD4+ and IFNγ+TNFα+CD4+ in the spleen and an increased frequency of Ki67+CD4+ T cells in the tumor (Fig. 6K–L). While the antigen specificity of infiltrating endogenous T cells here or in the RenCa model was not evaluated, the dependence on endogenous CD8+ T cells in the RenCa model (Fig. 2D–H) and the substantial percentage of cytokine-producing (IFNγ+TNFα+) and proliferating (Ki67+) endogenous T cells, suggest that at a subset of the endogenous infiltrating T cells are tumor antigen-specific, though non-antigen-specific, activated “bystander” T cells would also be expected to infiltrate the TME (56). Taken together, these data indicate that intravenous administration of STANs triggers STING signaling and downstream cytokine and chemokine production at tumor sites, which promotes a normalization of tumor vasculature and increases expression of EC adhesion molecules that promotes the tumor infiltration, activation, proliferation, and functionality of both endogenous and adoptively transferred T cells.
STANs enhance response to ICB
Poor T cell infiltration and antibody perfusion into solid tumors is a major barrier to the efficacy of ICB (5), and therefore we evaluated the effect of systemically administered STANs on the response to two ICB antibodies: αPD-L1 and αB7-H3. We found that STANs enhanced response to αPD-L1 ICB (Fig. 7A–D), which alone provides no therapeutic benefit in the RenCa model. This is notable since αPD-L1 (avelumab) is approved in renal cell carcinoma in combination with the anti-angiogenic agent axitinib, but with only an 55% objective response rate in patients with PD-L1-positive tumors (57). Based on the ability of STAN-induced vascular normalization to increase IgG accumulation at tumor sites (Fig. 4A–C), we also evaluated a regimen in which three doses of αPD-L1 was administered after STAN treatment, but we did not observe a significant benefit over concurrent administration with STANs (P<0.0001) (Fig. S7), potentially due to the long half-life of IgG (i.e., ~1 week in mice) (58). We also found that STANs enhanced the response to αB7-H3, which had exhibited almost no response as a monotherapy, resulting in a comparable combinatorial therapeutic effect to that observed with αPD-L1 (Fig. 7E–H). This potential synergy between STING agonists and αB7H3 antibodies may provide an alternative ICB strategy for patients with intrinsic or acquired resistance to PD1/L1 blockade.
Figure 7. Systemic administration of STAN enhances responses to immune checkpoint blockade.
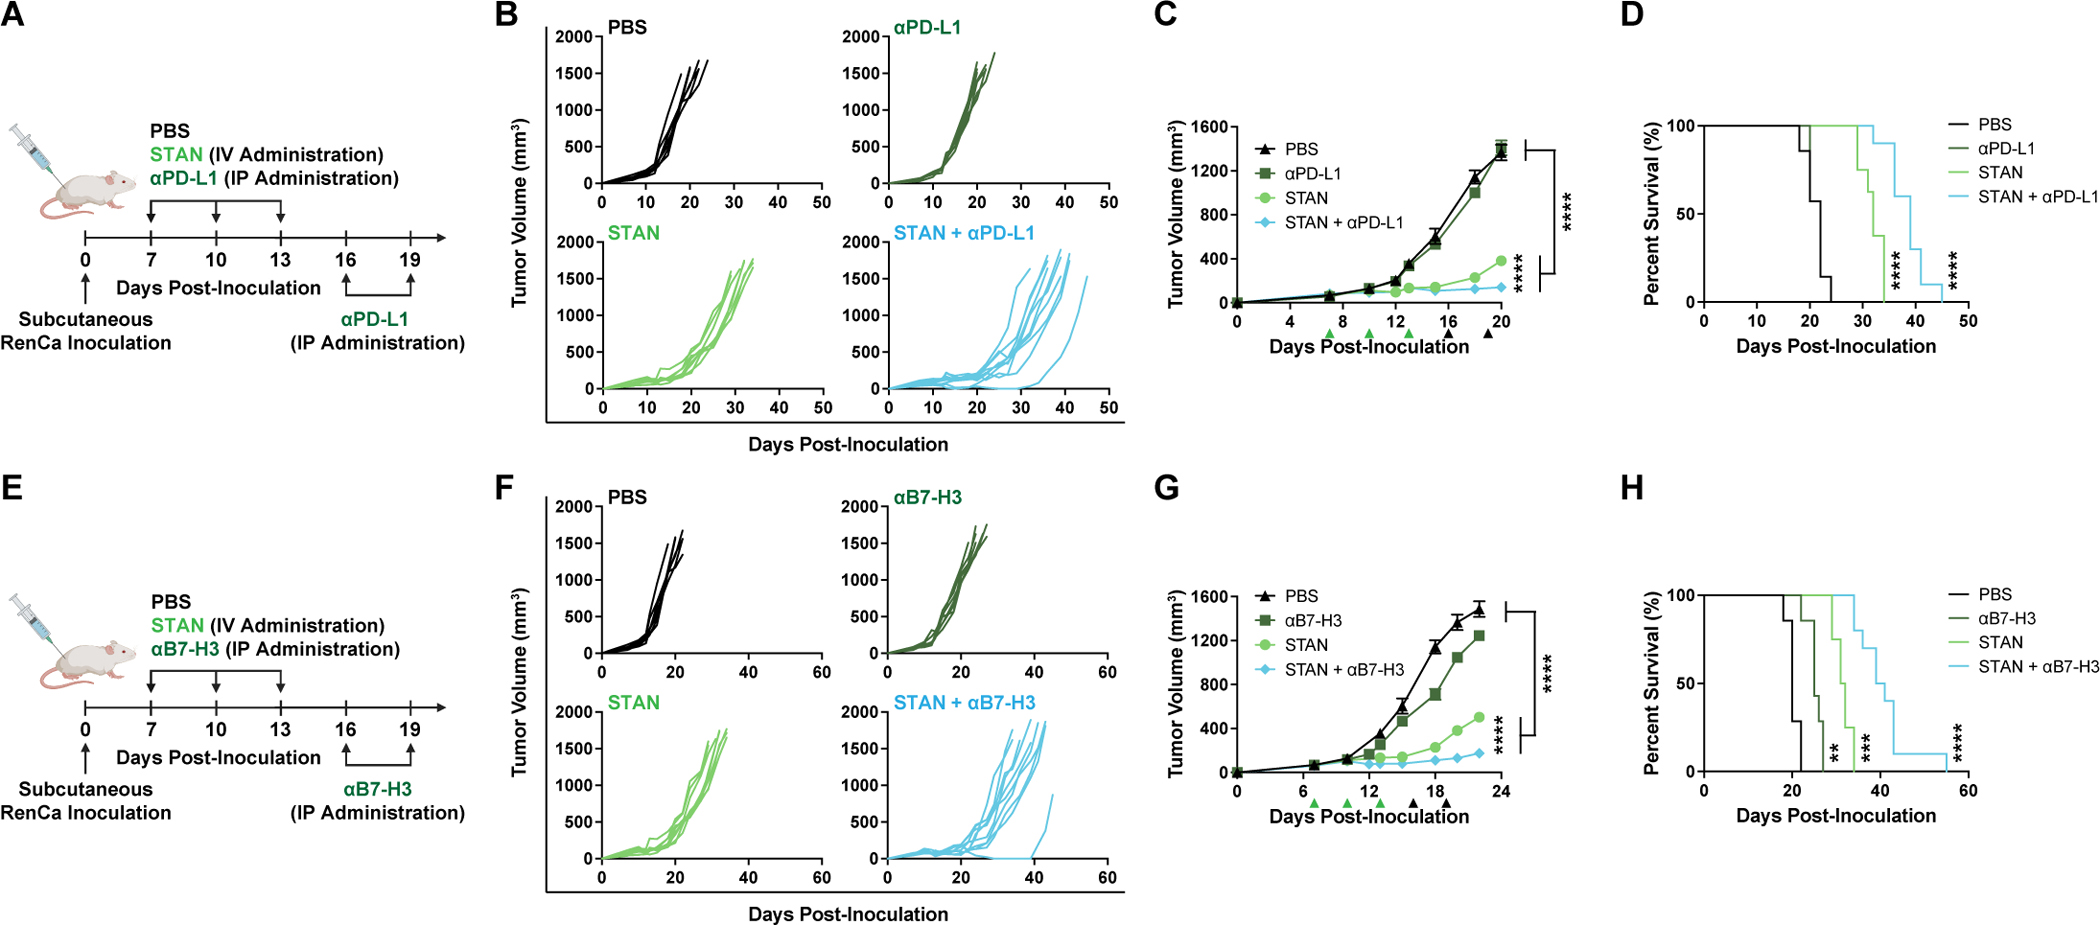
(A) Schematic of RenCa tumor inoculation and treatment schedule with STAN (3 doses) and ICB (5 doses of αPD-L1 antibody). (B-D) Spider plots of individual tumor growth curves (B), tumor growth curves (C), and Kaplan-Meier survival curves (D) of RenCa tumor bearing mice treated as indicated. (E) Schematic of RenCa tumor inoculation and treatment schedule with STAN (3 doses) and ICB (5 doses of αB7-H3 antibody). (F-H) Spider plots of individual tumor growth curves (F), tumor growth curves (G), and Kaplan-Meier survival curves (H) of RenCa tumor bearing mice treated as indicated. (C,G) Tumor growth curves are presented as mean ± SEM (n=7–10 mice/group). ****P<0.0001 determined by 2-way ANOVA with post-hoc Tukey’s correction for multiple comparisons; with comparisons shown between STAN and STAN + ICB as well as PBS against both STAN/STAN + ICB, are on (C) day 20 and (G) day 22. (D,H) Kaplan-Meier survival curves of mice treated with indicated formulation using 1500 mm3 tumor volume as endpoint criteria and P value was determined by log-rank test. **P≤0.01, ***P≤0.001, and ****P<0.0001 compared to PBS.
Preconditioning the TME with STANs opens a therapeutic window for adoptive T cell therapy
We assessed whether the conditioning regimen used to induce vascular normalization could generate a window for enhancing therapeutic responses to a T cell therapy. To test this, mice bearing orthotopic ~40–60 mm3 EO771-OVA tumors were administered STANs or vehicle (PBS) three times, spaced three days apart, followed by a single intravenous administration of a high (3×10⁶ T cells) or low (0.5×10⁶ T cells) dose of activated OT-I T cells 48 h later (Fig. 8A). Treatment with OT-I T cells alone reduced tumor growth and increased survival by a statistically significant (P=0.025 for 0.5×10⁶ T cells; P=0.002 for 3×10⁶ T cells), but minimal, extent (Fig. 8B–D), reflecting the considerable barriers to T cell infiltration and function imposed by the TME. Treatment with STANs alone inhibited tumor growth to a similar extent to that observed in the RenCa model, but tumor growth progressed following cessation of STAN therapy, resulting in increased survival but without any complete responses. By contrast, pre-conditioning of the TME with STANs prior to OT-I T cell transfer resulted in a rapid tumor regression and, importantly, complete responses in 9/10 mice for at least 135 days. We then re-challenged surviving mice on a contralateral mammary fat pad with either EO771-OVA (re-challenge of complete responders from mice receiving STANs and 5×10⁵ OT-I T cells) or the parental, non-OVA-expressing EO771 cell line (re-challenge of complete responders from mice receiving STANs and 3×10⁶ OT-I T cells) and evaluated tumor growth (Fig. 8E–H). Tumor growth was inhibited in both cases, with ~40–50% of mice completely protected from tumor formation at 80 days post re-challenge. Therefore, the combination of STANs with OT-I transfer generated protective immune memory against both OVA and non-OVA expressing tumor cells, potentially suggesting epitope spreading in response to the therapeutic combination.
Figure 8. Systemic administration of STANs increases response to adoptive T cell therapy in murine model of orthotopic breast cancer.

(A) Schematic of EO771-OVA tumor inoculation and treatment schedule with STANs and activated OT-I T cells. (B-D) Spider plots of individual tumor growth curves with number of complete responders (CR) indicated (B), tumor growth curves (C), and Kaplan-Meier survival curves (D) of EO771-OVA tumor bearing mice. (E-H) At day 135, mice that exhibited complete responses to the combination of STANs and OT-I T cell transfer treatment were re-challenged with EO771-OVA cells (CRs from STAN + 0.5×10⁶ OT-I treatment) or parental EO771 cells (CRs from STAN + 3×10⁶ OT-I treatment). (F) Tumor growth was monitored and compared with treatment-naïve mice inoculated with EO771-OVA or EO771 cells. For spider plots of individual tumor growth curves, number of CRs are indicated. Kaplan-Meier survival curves for EO771-OVA challenge (G) and EO771 challenge (H). (I) Schematic of larger EO771-OVA tumor inoculation (~200 m3) and treatment schedule. (J-L) Spider plots (J), tumor growth curves (K), and Kaplan-Meier survival curves (L). Tumor growth curves are presented as mean ± SEM (C, n=8–10 mice/group; E, n=5–9 mice/group; K, n=4–7 mice/group) with P value determined by (C,K) 2-way ANOVA with post-hoc Tukey’s correction for multiple comparisons or (E) by Student’s t-test. (C) ****P<0.0001 on day 49 shown comparing STAN to both STAN/OT-I T cell groups, (E) ****P<0.0001 at day 30 for EO771-OVA and day 23 for EO771, (K) ***P≤0.001 on day 40 shown comparing STAN to both PBS/OT-I T cells and ****P<0.0001 on day 49 shown comparing STAN to STAN + OT-I T cells. Kaplan-Meier survival curves of mice treated as indicated using 1500 mm3 tumor volume as endpoint criteria and P value was determined by log-rank test; **P≤0.01, ***P≤0.001, and ****P<0.0001 compared to PBS.
It is well-established that it is more challenging to treat larger tumors with immunotherapy agents due, in part, to the establishment of a more immunosuppressive milieu that further inhibits T cell infiltration and function (59, 60). Therefore, based on the robust therapeutic response observed for the combination of STAN pre-treatment with OT-I transfer, we tested this combination regimen in mice with larger (~200–210 mm3) orthotopic EO771-OVA breast tumors (Fig. 8I–L). Similar to our results when starting with smaller (~50 mm3) tumors, STAN treatment alone inhibited tumor growth resulting in increased survival time, though, as expected, the therapeutic benefit was less pronounced in mice with larger tumors (40 vs. 48 day median survival time). However, preconditioning of the TME with STANs prior to OT-I treatment resulted in decreased tumor volume between T cell transfer on day 32 and day 49. While tumors ultimately grew to endpoint, the combination of STANs and OT-I T cells resulted in a dramatic extension in survival time (40 vs. 72 day median survival time), with all mice surviving for at least 70 days. These studies support STANs as an enabling technology for enhancing responses to T cell-based therapies, including cancer vaccines, adoptive T cell transfer, and CAR T cell therapy.
Discussion:
Tumors coopt both the immune and vascular systems to establish an immunosuppressive niche and evade recognition and eradication by T cells (61). Accordingly, combining anti-angiogenic agents (e.g., VEGF inhibitors) with immunotherapies (e.g., ICB) is now being used to treat various malignancies with variable clinical success (14). However, there are still shortcomings that require new approaches to reprogram the vascular-immune interface, motivating us to evaluate the effects of STANs on tumor vasculature and vascular-T cell interactions. Systemic administration of STANs – but not free cGAMP – activates STING signaling in the TME, which normalizes the tumor vasculature, activates tumor-associated ECs, and stimulates the production of T cell chemokines in the TME. This enhances the infiltration, proliferation, and function of antitumor T cells, potentiating the therapeutic response to multiple T cell-based immunotherapeutic modalities. STANs may therefore offer advantages over existing antiangiogenics by coupling vascular normalization with stimulation of an innate immune response that activates the tumor vascular endothelium to increase expression of T cell adhesion molecules and generates chemokine gradients to direct T cell homing.
While our findings also contribute to a still evolving understanding of the role of STING activation on the tumor vasculature, the effects of STING activation on angiogenesis and vascular remodeling remain a topic of debate. Some studies indicate that STING agonists induce vascular disruption (37, 39, 62), while others show that local, intratumoral administration of CDNs can promote vascular normalization (32, 33). Our findings are more consistent with those of Yang et al. (32) and Chelvanambi et al. (33), but are distinguished from, and build upon, these recent reports by evaluating the effects of a systemically-administered CDN, here enabled by the use of nanotechnology. We also found that STAN-induced vascular normalization and antitumor response partially depend on TNF-α and CD8+ T cells, but not on IFNRA1. The importance of specific cytokines and cell populations in the response to STING agonists remains unclear and is likely context dependent. For example, Yang et al. found that therapeutic response to a nanoparticle STING agonist was independent of both IFNAR1 and TNFα (63), whereas Kim and colleagues found that IFN-I was important to efficacy and vascular normalization in response to intratumoral CDN administration (32). Therefore, it is likely that the nature, kinetics, and mechanism of vascular remodeling is dependent on several factors, including model and cancer type, dose, administration route, and immune status.
Normalizing tumor vasculature allows leukocytes to migrate into tissue from the circulation by following established chemokine gradients (1). Tumor-associated endothelial cells can down-regulate critical leukocyte adhesion molecules (e.g., ICAM-1, VCAM-1), which limits T cell-mediated antitumor immunity. STANs increase the expression of ICAM-1 and VCAM-1 on tumor-associated ECs and stimulate the production of T cell chemokines (e.g., CXCL9), thereby enhancing T cell infiltration into tumor tissue. This was supported by evidence that direct activation of murine EC lines with STANs improved trans-endothelial migration of activated CD8+ T cells, consistent with studies by Alcaide and colleagues who demonstrated that EC-specific knockout of STING impaired T cell migration in a peritonitis model (36). Hypoxia can also contribute directly and indirectly to CD8+ T cell exhaustion, suppression of cytolytic potential, and apoptosis (64). STANs administered intravenously reduced hypoxia in the TME and enhanced proliferation, activation, and function of endogenous and adoptively transferred T cells. STING activation may therefore have direct and indirect metabolic consequences on immune, cancer, and stromal cells with potential to improve T cell function.
In conclusion, our results demonstrate that systemic administration of STANs provides a multimodal strategy for coordinating antitumor innate immunity and vascular normalization to enhance T cell infiltration and response to T cell-based immunotherapies. As STANs and other immunostimulatory nanomedicines (45, 63, 65–67) advance towards translation, potential immunotoxicies must be further considered and it will be important to optimize dosing regimens and to identify the proper clinical scenarios in which to deploy STANs. For example, a small study revealed that one injection of STANs could induce vascular normalization (Fig. S8), albeit to a lesser degree, suggesting that a single STAN dose could be leveraged for adjunctive immunotherapy. However, in pilot studies where we have added an additional three STAN doses, we observed evidence of toxicity, potentially indicating that prolonged use of STING agonists may be deleterious (68). While we have focused here only on immune checkpoint inhibitors and employed a simplified model of adoptive T cell transfer, our data demonstrate that STANs may also have the potential to enhance responses to CAR-T cells and therapeutic cancer vaccines for solid tumors where dysfunctional tumor vasculature is a critical barrier to T cell infiltration and therapeutic efficacy. Additionally, we found that STAN-induced vascular normalization increased tumor accumulation and cellular uptake of nanoparticles, creating an opportunity to improve the delivery of nanoparticle-based therapeutics that may act synergistically with activation of antitumor innate immunity (e.g., e.g., Doxil, Abraxane) (69, 70). As our understanding of the role of STING signaling on vascular-immune crosstalk expands, and as STANs and other STING-activating agents continue enter the translational pipeline, further exploration and optimization of such combinations is warranted to improve responses to cancer immunotherapy.
Materials and Methods:
Study Design
The overall objective of the study was to test the hypothesis that systemic STAN administration normalized tumor vasculature to enhance T cell infiltration and responses to T cell-based immunotherapies. Using murine models of kidney and breast cancer, we evaluated the effect of intravenously STANs on: tumor growth inhibition; STING activation in the TME via qRT-PCR and western blot analysis; vascular normalization via analysis of tumor hypoxia, blood vessel density, pericyte coverage, lectin binding, dextran perfusion, and enhancement of model nanoparticle accumulation in the tumor and in tumor-associated cell populations; quantification and immunophenotyping of endogenous and adoptively transferred tumor-infiltrating T cell populations; and response to immune checkpoint inhibitors and adoptive T cell transfer. Sample size was determined via a priori power analysis based on means and standard deviations estimated from pilot experiments, previous experience, or the literature. All mice were randomized prior to treatment initiation, studies were terminated a defined endpoint as indicated or when tumor volume reached 1500 mm3, and evaluation of tumor volume was blinded when possible.
Cell Lines and Materials
The murine renal adenocarcinoma cell line RenCa was purchased from American Type Culture Collection (ATCC). The murine mammary cancer EO771 cell line was a gift from Dr. Justin M. Balko (Vanderbilt University Medical Center). Ovalbumin-expressing EO771 cells (EO771-OVA) (55) were a gift of Dr. Jin Chen (Vanderbilt University Medical Center). The murine endothelial cell lines MS1 and bEnd.3 were gifts of Dr. Andrew C. Dudley (University of Virginia). Cell lines were cultured as described in the Supplementary Information. Antibodies were purchased from commercial vendors and the source and clone are described in the Supplementary Information or indicated below. 2′,3′-cyclic GMP-AMP (cGAMP) was synthesized in house at Vanderbilt University and STANs were produced as described previously (43) and in the Supplementary Information.
Evaluation of STANs in RenCa tumor model
RenCa cells (5×10⁵) or were injected subcutaneously into the right flank region of 6–7 week old female Balb/c mice (The Jackson Laboratory). On day 7, when tumors reached ~50 mm3 or ~100 mm3 animals were randomly divided into 4 groups, and administered 100 μL PBS, empty NP, free cGAMP, or STANs intravenously via caudal vein or retroorbital injection. Mice were treated three times with three days between each administration. For most studies, the dose was normalized to 10 μg cGAMP with studies described in Fig. S1 also using 5 and 2.5 μg doses. For combination treatment of STANs and anti-PD-L1 or anti-B7-H3 (100 μg, BioXcell), mice were administered STANs intravenously and antibodies were administered intraperitoneally every 3 days for a total of five injections beginning on same day as STANs. Tumor volume was measured every 2 days via caliper measurements, and volumes were calculated using: Vtumor = L × W2 × 0.5 (Vtumor is tumor volume, L is tumor length, and W is tumor width). Mice were euthanized by carbon dioxide asphyxiation when tumor volume reached 1500 mm3. For studies evaluating the effects of TNFα and IFNAR1 blockade and CD8+ T cell depletion, mice with RenCa tumors (day 12) were intraperitoneally administered anti-IFNAR1 (MAR1–5A3; 200 μg), anti-TNFα (XT3.11; 500 μg), or anti-CD8 (53–6.7; 200 μg) antibodies one day prior to the start of STAN treatment. Mice were euthanized 48 h following the third STAN administration for analysis of tumor vasculature.
Flow cytometric analysis of RenCa tumors
Mice with ~100 mm3 RenCa tumors were administered STANs or PBS intravenously as described above and euthanized 48 h following the third injection. Tumors were harvested and mechanically dissociated using a gentleMACS Octo dissociator for 30 minutes at 37°C in a digestion solution of 500 μg/mL collagenase III (Worthington) and 125 μg/mL DNAse I (Worthington) in RPMI 1640 media. Spleens were harvested and manually homogenized in RPMI 1640 media. To obtain single-cell suspensions, digested tumor and homogenized spleen tissue was filtered through a 70 μm cell strainer and red blood cells were lysed using ACK lysis buffer (Gibco) for 5 min at room temperature (RT). Cells were resuspended in RPMI 1640 with dasatinib (50 nM) and diluted to a concentration of 2×10⁷ cells/mL in PBS containing 5% BSA and 50nM dasatinib (FACS buffer) for staining. 100 μL of cell suspension was transferred into a 96 well U-bottom plate and treated with FcBlock CD16/32 (Biolegend) for 15 mins at 4°C according to manufacturer specifications. Samples were stained with followed panels of the antibodies (Biolegend) for 30 mins: T cell panel 1: FITC-αCD45 (30-F11), APC-αCD3 (17A2), APC/Cy7αCD4 (RM4–5), PE/Cy5-αCD8α (53.6.7), FITC-αCD69 (H1.2F3), and DAPI. T cell panel 2: BV510-αCD45 (40-F11), PE/Cy7-αCD3 (18A2), FITC-αCD69 (H1.2F3), PerCP/Cy5.5-αCD4 (RM4–5), e450-αCD8a (53–6.7), and cell viability dye Ghost Dye Red 780 (Cell Signaling); Myeloid cell panel: FITC-αCD45 (30-F11), PE/Cy5-αCD11b (M1/70), APC/Cy7-αF4/80 (BM8), PE/Cy7-αCD11c (N418), BV710-αMHC-II (10.3.6), BV605-αLy6G (1A8), and APC-αLy6C (HK1.4) and DAPI; Endothelial cell panel: PE-CD54 (ICAM-1) (YN1/i.7.4), PE/Cy7-CD106 (VCAM-1) (429), BV605-αCD31 (MEC13.3), and PE/Cy5-CD34(MEC14.7) and DAPI. After staining at 4°C for 30 mins, cells were centrifuged, washed three times, and suspended in FACS buffer, followed by the addition of 2×10⁵ AccuCheck counting beads (Life Technologies) and 200 nM DAPI before analyzing on a BD LSR II flow cytometer. All flow cytometry data were analyzed using FlowJo software (version 10; Tree Star; https://www.flowjo.com/solutions/flowjo). Representative flow cytometry plots and gating schemes are shown in Fig. S9 (T cell panel), Fig. S10 (myeloid cell panel), and Fig. S11 (endothelial cell panel).
Mouse EO771-OVA tumor model and adoptive OT-I T cell transfer
CD45.1+/− OT-I mice were a kind gift of Dr. Young Kim at Vanderbilt University Medical Center. CD8+ T cells were isolated from spleens and lymph nodes of CD45.1+/− OT-I transgenic mice by negative selection using EasySep™ Mouse CD8+ T Cell Isolation Kit (STEMCELL Technologies). The purity of CD8+ T cells following magnetic isolation was confirmed to be 85–90% by flow cytometry (CellStream™, Millipore Sigma); representative flow cytometry plots are shown in Fig. S12A. To activate CD8+ T cells in vitro, purified CD8+ cells were cultured in RPMI-1640 (GIBCO) supplemented with 10% fetal bovine serum (FBS; Invitrogen), 1% penicillin/streptomycin (GIBCO), 1 mM sodium pyruvate, 50 μM β-ME (Millipore-Sigma), 10mM HEPES (GIBCO), 1× MEM NEAA (GIBCO), 10 U/mL recombinant mouse IL-2 (Millipore-Sigma), and Dynabeads Mouse T-Activator CD3/CD28 (at bead-to-cell ratio of 1:1, GIBCO) for 5 days in a humidified CO2 incubator at 37°C.
To establish orthotopic EO771-OVA tumors, 5×10⁵ cells were implanted into the ninth mammary gland of female WT (CD45.2) C57BL/6 mice (The Jackson Laboratory) and allowed to grow to tumor size of ~100 mm3. To evaluate the effect of STAN treatment on OT-I T cell infiltration, mice were administered STANs or PBS three times, spaced three days apart. Two days later, 8×10⁶ activated OT-I CD8+ T cells purified from CD45.1+/− OT-I donors were adoptively transferred into EO771-OVA tumor-bearing mice (recipients) by retro-orbital injection. Mice were euthanized 24 h after adoptive T cell transfer, tumors were collected, and single cell suspensions were generated and stained with the following panel: FITC-αCD45.1 (A20), PE-αCD45.2 (104), APC-αCD3 (17A2), PE/Cy5-αCD8α (53.6.7), and DAPI. Tumor-infiltrating T cells were analyzed using flow cytometry. Representative flow cytometry plots and gating schemes are shown in Fig. S12B.
To evaluate the ability of STANs to enhance adoptive T cell transfer therapy, WT (CD45.2) female C57BL/6 mice were inoculated with 5×10⁵ EO771-OVA tumor cells into the ninth mammary gland. Ten days later, when tumor size reached approximately 40 mm3 (40±5.28 mm3), animals were randomly divided into treatment or control groups. Mice were i.v. administered PBS or STANs 3 times spaced 3 days apart. Two days later, 0.5×10⁶ or 3×10⁶ CD3/CD28 bead-activated OT-I CD8+ T cells purified from CD45.1+/− OT-I donors were administered by retro-orbital injection and tumor volume was monitored. At day 135, surviving mice (complete responders) or treatment naïve control mice were challenged either with 5×10⁵ EO771-OVA or with 5×10⁵ EO771 tumor cells inoculated into the contralateral (fourth) mammary gland and tumor growth monitored. To evaluate this treatment regimen in mice with larger tumors, female C57BL/6 mice were inoculated with 0.5×10⁶ EO771-OVA tumor cells into the ninth mammary gland. When tumor size reached approximately 200 mm3 (208±58 mm3), mice were randomly divided into 4 groups: PBS, STANs, 0.5×10⁶ OT-I T cell alone, and STANs + 0.5×10⁶ OT-I T cell. Tumors growth was monitored until volume reached 1500 mm3.
T cell immunophenotyping in adoptive OT-I T cell transfer tumor model
CD45.2 Thy1.1+ OT-I mice were a kind gift of Dr. Jeff Rathmell at the Vanderbilt University School of Medicine. Briefly, CD8+ T cells were isolated from spleens of Thy1.1+ OT-I mice using EasySep™ Mouse CD8+ T Cell Isolation Kit (STEMCELL Technologies). The isolated CD8+ T cells were cultured and expended with T-Activator CD3/CD28 for 5 days in a humidified CO2 incubator at 37°C. To evaluate the effect of STAN-induced vascular normalization on OT-I T cells, mice with orthotopic EO771-OVA tumors were administered STANs or PBS three times, spaced three days. Two days later, 5×10⁶ activated Thy1.1+ OT-I were adoptively transferred into EO771-OVA tumor-bearing CD45.2 Thy1.2+ mice (recipients) by retro-orbital injection. Mice were euthanized 5 days after OT-I T cell administration. Single cell suspensions from tumors and spleens were obtained and incubated with Fc Block αCD16/32. For surface maker staining, cells were washed once with FACS buffer, stained with Ghost Dye Red 780 viability dye (Cell Signaling), and the following antibodies: BV510-αCD45 (40-F11 BioLegend), PerCP/Cy5.5-αThy1.1 (HIS51 ThermoFisher), BV510-αCD8a (53–6.7, BD), PE/Cy7-αCD3 (18A2 BioLegend), FITC-αCD69 (H1.2F3 BioLegend), PE-αPD-1 (29F-1A12 BioLegend) and for 15 min at RT. Cells were washed once with FACS buffer, fixed in cytofix/cytoperm buffer (ThermoFisher) overnight at 4°C, and resuspended in FACS buffer for analysis. Representative flow cytometry plots and gating schemes are shown in Fig. S13.
For intracellular cytokine staining, single cell suspensions from tumor and spleen were incubated for 4 h at 37°C and 5% CO2 in RPMI supplemented with PMA (50 ng/mL, Sigma Aldrich), ionomycin (750 ng/mL, Sigma Aldrich), and GolgiPlug (BD), and processed using the BD Cytofix/Cytoperm™ Fixation and Permeabilization Solution (ThermoFisher) for 15 m at 4°C, followed by staining with Ghost Dye Red 780 viability dye (Cell Signaling) and the following antibodies: BV510-αCD45 (40-F11 BioLegend), FITC-αThy1.1 (OX-7, BioLegend), e450-αKi67 (SolA15 ThermoFisher), PE/Cy7-αCD3 (18A2 BioLegend), PE-αCD8a (53–6.7 BioLegend), PerCP/Cy5.5-αCD4 (RM4–5 BioLegend), V450-αTNFα (MP6-XT22 BD), APC-αIFNγ (XMB1.2 BioLegend)) overnight at 4°C. Cells were washed once with permeabilization buffer and resuspended in FACS buffer for analysis. Representative flow cytometry plots and gating schemes are shown in Fig. S14.
Western blot analysis and quantitative real-time PCR
Mice with ~100 mm3 subcutaneous RenCa tumors were intravenously administered PBS, cGAMP (10 μg), empty nanoparticle (NP), or STANs (10 μg cGAMP) three times, spaced three days apart. Mice were euthanized and tumors were harvested 24 hours after the final injection and tumor tissue was homogenized. For in vitro analysis of STING expression in ECs, 1×10⁶ MS1 and bEnd.3 cells were seeded in 6-well plates and treated with PBS or STANs (0.5 μM cGAMP) for 24 hours and cells were homogenized using RIPA lysis buffer (Santa Cruz). Following cell or tissue homogenization, protein concentration was quantified and western blot analysis using anti-STING, anti-p-IRF3, anti-IRF3, and anti-β-actin antibodies using established methods detailed in the Supplementary Information.
For gene expression analysis of ECs, 1×10⁶ MS1 and bEnd.3 cells were seeded in 6-well plates and treated with PBS or STANs (0.5 μM cGAMP) for 24 hours and cell pellets were frozen at −80°C. To evaluate gene expression in tumors, mice with ~100 mm3 subcutaneous RenCa tumors or orthotopic EO771 tumors were administered PBS or STANs (10 μg cGAMP) as described above, and tumors were harvested at the specified time point and homogenized (TissueLyser II; Qiagen). RNA was isolated and qRT-PCR performed using standardized methods as detailed in the Supplementary Information.
Ex vivo treatment of freshly resected human renal cell carcinoma tissue
All experiments using human samples were performed in compliance with United States Federal Policy for the Protection of Human Subjects and guidelines set forth by the Vanderbilt University Human Research Protections Program. Experiments were approved by the Vanderbilt University Institutional Review Board, and all patients were consented for research use of biospecimens (Vanderbilt University Medical Center IRB number 181306). Primary renal tumors from previously untreated patients were surgically excised at Vanderbilt University Medical Center. Within an hour of surgical resection, human renal tumors were submerged in RPMI-1640 (GIBCO) supplemented with 10% FBS and divided into ~15–25 mm3 sections using a scalpel. Individual sections were then placed in a 12 well plate containing 2 mL of media and injected with PBS, empty particle (NP), STANs, or cGAMP to a final concentration of 0.5 μM of cGAMP within each well. Eighteen hours after treatment, RNA isolation, cDNA synthesis, and qPCR analysis was performed using the following TaqMan primers purchased from Thermo-Fisher Scientific: Human Ifnb1 (Hs01077958_s1), human Cxcl10 (Hs00171042_m1), human Il12 (Hs00168405_m1), human Tnf (Hs00174128_m1), human Hif1a (Hs0015315_m1), human Vefga (Hs00900055_m1), human Vcam1 (Hs01003372_m1), human Icam1 (Hs00164932_m1), human Gaphd (Hs02786624_g1), and human Hmbs (Hs00609296_g1).
NanoString nCounter Analysis of human renal carcinoma tissue
Isolated sections of human renal tumors were treated, and total RNA was isolated as above described. 100 ng RNA was analyzed by nanoString nCounter gene expression analysis using the Human nCounter® PanCancer IO 360 Panel. Fold change was calculated by comparing against average normalized gene expression values of PBS treated tumors. All statistical significance and clustering analysis were performed in R (http://cran.r-project.org).
Immunofluorescent analysis of tumor vasculature and hypoxia
Mice with ~100 mm3 subcutaneous RenCa tumors or mammary EO771 tumors were intravenously administered PBS or STANs (10 μg cGAMP) every 3 days for a total of three injections. 48 hours following the last administration, mice were euthanized, and tumors were harvested, embedded in optimum cutting temperature (OCT) compound, and frozen overnight at −80°C. For evaluation of tumor hypoxia, mice were intravenously administered 100 μL Hypoxyprobe-1 (60 mg/kg, pimonidazole hydrochloride in PBS, Natural Pharmacia International) 48 h following the last STAN administration and mice were euthanized 90 min later. For analysis of vascular leakage, 100 μL of FITC-dextran (25 mg/mL, 40 kDa, Sigma-Aldrich) was intravenously administered 48 h after the final administration of STANs. Vascular perfusion was analyzed via intravenous injection of 100 μL FITC-labeled Tomato Lectin (1 mg/mL, Vector Laboratories). Mice were anesthetized 15 minutes later and perfused by intracardiac injection with PBS and 1% paraformaldehyde (PFA) to remove circulating dextran and lectin. Tumor tissue sections (10 μm-thick) were cut on a Leica CM1520 (Leica Biosystems). The frozen tumor sections were dried for 15 mins at room temperature (RT), permeabilized with PBST (0.03% Triton X-100 in PBS) for 15 mins at RT, and blocked with 10% goat serum for 1 h at RT. To evaluate blood vessel density and pericyte coverage, sections were incubated overnight at 4°C with rat anti-mouse CD31 (clone MEC 13.3, BD Biosciences) for quantification of blood vessel density and Cy3-conjugated anti-αSMA (rabbit polyclonal, Millipore) or anti-NG2 (AB5320, Sigma-Aldrich) for pericyte coverage. The following day, sections were washed three times with PBS with 0.1% Tween 20 followed by staining with secondary antibody AlexaFluor647-conjugated goat anti-rat IgG (H+L) (Thermo Fisher Scientific) and goat anti-rabbit AlexaFluor488 (A-11006, Invitrogen) for 60 mins. For studies evaluating dextran leakage and lectin binding, sections were stained with rat anti-mouse CD31 antibody (clone MEC 13.3, BD Biosciences) overnight at 4 °C. After washing twice with PBS, sections were incubated with secondary AlexaFluor647-conjugated goat anti-rat IgG for 60 mins. Slides were washed three times and mounted with DAPI nuclear dye and visualized under an Olympus FV-1000 confocal microscope or Olympus inverted fluorescence microscope and processed by using the Cellsens Dimension software program. High magnification images were obtained by using the 40x objective lens (CD31 and α-SMA) and 20x (NG2) objective lens.
Analysis of cellular uptake of Cy5-labeled nanoparticles
To quantify the uptake of Cy5-labeled polymer nanoparticles (Cy5-NP) by tumor associated cell populations following treatment with intravenously administered STANs, RenCa tumor-bearing mice (~100–150 mm3 tumor volume) received 3 treatments of PBS or STANs spaced three days apart, and 48 hours later, mice were intravenously injected once with Cy5-NP. Twenty-four (24) h later, tumors were harvested, weighed, and mechanically dissociated into single cell suspension as described above. Cells were then counted and stained with DAPI (Millipore Sigma) and the following antibody panel (antibodies from Biolegend): PE/Cy5-αCD45 (30-F11), AlexaFlour488-αCD11c (N418), PE/Cy7-αF4/80 (BM8), Perp/Cy5.5-αCD11b (M1/70), PE-αCD31, and. Representative flow cytometry plots and gating schemes are shown in Fig. S15. Additionally, tumors were embedded in OCT compound, frozen at −80°C overnight, processed into 12 μm sections, and stained overnight at 4°C with the following primary antibodies: αCD31 (clone MEC 13.3, BD Biosciences), αF4/80 (CI: A3–1, Abcam), and AlexaFluor488 αCD11c (Biolegend). Sections were washed three times with 0.1% Tween 20 in PBS followed by staining with AlexaFluor488-conjugated goat anti-rat IgG or AlexaFluor647-conjugated goat anti-rat IgG (Thermo Fisher Scientific) secondary antibody for 60 mins. Slides were washed three times, mounted with DAPI nuclear stain, and visualized under an Olympus FV-1000 confocal microscope. High magnification images were obtained by using the 40× objective lens.
Intravital fluorescent imaging of antibody accumulation at tumor site
Intravital fluorescent imaging was used to evaluate the effect of STAN-mediated vascular normalization IgG antibody accumulation at tumor sites. InVivoMAb mouse IgG1 (C1.18.4) antibody (Bio X cell) was conjugated with AlexaFluor680-NHS ester using a SAIVI Rapid Antibody Labeling Kit (Invitrogen) resulting in a degree of labeling of 1.37 dye per antibody. RenCa tumor-bearing mice were administered STANs (10 μg cGAMP) or PBS intravenously three times every 3 days to induce vascular normalization and two days later mice were administered 100 μg of IgG1-AlexaFluor680 via tail vein injection. Prior to imaging at the indicated time point, mice mice were anesthetized by inhalation of isoflurane. The fluorescence (i.e., radiant efficiency) at the tumor site was measured at 6 and 24 h on the IVIS Lumina III (PerkinElmer). The fluorescence signal mean and standard deviation were calculated by averaging the maximum pixel values over the tumor area using Living Image software (version 4.5).
Analysis of in vivo tumor accumulation of gold nanoparticles
RenCa tumor-bearing mice were administered STANs or PBS intravenously three times every 3 days, and 48 h later mice were intravenously injected once with 20 nm PEG coated NANOCS™ Gold nanoparticles (NANOCS, 5 mg/ml, 0.35 mg per mouse corresponding to an Au dose of 7.5 mg/kg/d). 24 h later, mice were euthanized and tumor tissue was isolated, frozen immediately in liquid nitrogen, lyophilized, placed in 75 vol % trace metal grade aqua regia (Fisher Scientific) for 3 days, boiled at 120°C to evaporate liquid, and redissolved in 10 mL of 2 vol % aqua regia. Samples were filtered (0.4 μm) to remove any impurities prior to ICP-MS measurement and analysis using the PerkinElmer model ELAN DRC II operated in standard mode. The setting of the instrument was 1.5 kW radio frequency power, 15 L/min argon plasma flow, 1 L/min nebulizer flow, and 1 s integration time for 3 replicates. A six-point calibration curve was performed for gold isotope 197 between 0.05 and 500 μg/L. Analytical blanks and check standards (0.5 μg/L) were measured for every 3−5 sample to ensure the readings were within 15% of the specified value. The percentage of injected dose of Au was calculated using the formula % ID = 100×[Au (mg/L) × volume (L)]/total injected Au (mg).
In vitro T cell migration assay
CD8+ T cells were isolated from mouse spleens, purified, and activated as described above. To analyze the transwell migration of CD8+ T cells, the upper surface of a 12-well insert was coated with a 0.2% gelatin solution at 37°C for 2 hours, followed by removal of non-adhered gelatin. MS1 cells were diluted to a concentration of 7.5×10⁵ cells/ml in culture medium and 200 μL of the cell suspension were carefully placed in an inverted gelatin-coated transwell insert and cultured for 3 days at 37°C to establish a confluent endothelial cell layer. Fresh media (200 μL) with or without STANs (1 μM cGAMP) was added to the upper insert, 500 μL complete medium was added to the bottom of the well, and cells were cultured for 24 h. For antibody blockade studies, mouse anti-VCAM-1/CD106 (112734) and mouse anti-ICAM-1/CD54 antibodies (R&D Systems) were added to the upper chamber of the transwell at 50 μg/ml in 200 μL and removed via gentle pipette aspiration 2 h later. Activated CD8+ T cells (2×10⁶) in 200 μL media were then added to the upper chamber of the transwell insert and cultured for 4 h at 37°C. Inserts were then removed from wells and cells in the bottom chamber were suspended in 1 mL of media for quantification of total T cell number using a hemocytometer.
Statistics
All data were plotted and statistical analysis performed using Prism 9 (GraphPad) software. Unless indicated in the figures, all data are presented as mean ± SEM. For comparisons between 2 groups, unpaired 2-tailed Student’s t-tests were performed as indicated. For multiple comparisons, 1- or 2-way ANOVA was performed with post-hoc Dunnett’s test or Tukey’s correction for multiple comparisons. For tumor volume, statistically significance was examined through a two-way ANOVA followed by Tukey’s adjustment for multiple comparisons. A Log-rank (Mantel-Cox) test was used to compare Kaplan-Meyer survival data.
Ethics statement
Studies involving the use of animals were completed under Animal Care Protocols approved by the Vanderbilt University Animal Care and Use Committee. The health assessment of animals was completed using a standard operating procedure also approved by the Vanderbilt University Animal Care and Use Committee.
Supplementary Material
Figure S1. Effect of STAN dose on RenCa tumor growth.
Figure S2. Gene expression in EO771 tumors in response to STAN treatment.
Figure S3. Western blot analyses for p-IRF3, total IRF3, and/or STING in RenCa tumors.
Figure S4. Pilot study evaluating markers of STING activation and vascular normalization at different time points.
Figure S5. Systemic administration of STANs induces normalization of tumor vasculature in EO771 breast cancer model.
Figure S6. Systemic administration of STANs increases the number of tumor-infiltrating myeloid cells.
Figure S7. Comparing STAN treatment with concurrent or delayed αPD-L1 administration.
Figure S8. Preliminary study evaluating vascular normalization following a single intravenous dose of STANs.
Figure S9. Flow cytometric analysis of T cell infiltration into RenCa tumors.
Figure S10. Flow cytometric metric of myeloid cell populations in RenCa TME.
Figure S11. Flow cytometric analysis of VCAM1 and ICAM1 on tumor-associated endothelial cells.
Figure S12. Flow cytometric analysis of CD45.1+ OT-I T cells.
Figure S13. Flow cytometric analysis of Thy1.1+ OT-I T cells.
Figure S14. Immunophenotyping of Thy1.1+ OT-I T cells.
Figure S15. Flow cytometric analysis of Cy5-NP uptake by tumor associated cell populations.
Acknowledgements:
The authors would like to thank Dr. Michael Korrer and David Taylor in the laboratory of Dr. Young Kim for generous donation of OT-I T cells, Dr. Andrew Dudley for generous gift of MS1 and bEND.3 cells, Dr. Craig Duvall for use of IVIS Imaging System, Drs. Florence Sanchez and David Kosson for use of the ICP-MS instrumentation, and the Vanderbilt Center for Bone Biology for use of their cryotome. We thank the core facilities of the Vanderbilt Institute of Nanoscale Sciences and Engineering (VINSE), the VUMC Flow Cytometry Shared Resource, supported by the Vanderbilt Ingram Cancer Center (P30 CA68485) and the Vanderbilt Digestive Disease Research Center (DK058404), and the Vanderbilt Cell Imaging Shared Resouce (CISR). 2’3’-cGAMP was provided by the Vanderbilt Institute of Chemical Biology Molecular Design and Synthesis Center. Figures created with BioRender.com.
Funding:
This research was supported by grants from the CDMRP Kidney Cancer Research Program (KC170091 to JTW), Susan G. Komen (CCR19609205 to JTW), the AACR Kure-It award (WKR); the National Institutes of Health (R01 CA245134 to JTW; R01 CA274675 to JTW; R01 CA266767 to JTW; R01 CA217987 to JCR; F30 239367 to MZM; F31CA257275 to JJB), a Vanderbilt Ingram Cancer Center (VICC) Ambassador Discovery Grant (JTW), a Department of Defense Era of Hope Scholar Award (BC170037 to JMB), and also supported by a Stand Up To Cancer Innovative Research Grant, Grant Number SU2C-AACR-IRG 20–17 (JTW). Stand Up To Cancer (SU2C) is a program of the Entertainment Industry Foundation. Research grants are administered by the American Association for Cancer Research, the scientific partner of SU2C. MW acknowledges postdoctoral funding support from the Canadian Institute of Health Research (CIHR). BRK acknowledges postdoctoral funding support from the PhRMA Foundation Postdoctoral Fellowship in Drug Delivery. TLS and LEP acknowledge funding support through the National Science Foundation Graduate Research Fellowship Program under grant number 193793. Any opinions, findings, and conclusions or recommendations expressed in this material are those of the author(s) and do not necessarily reflect the views of the National Science Foundation.
Footnotes
Competing Interests: J.T.W. and D.S. are inventors on U.S. Patent 10,696,985 “Reversibly Crosslinked Endosomolytic Polymer Vesicles for Cytosolic Drug Delivery” and on U.S. Patent Application PCT/US2019/058945 “Graft Copolymers, Methods of Forming Graft Copolymers, and Methods of Use Thereof” which both describe drug delivery technologies that have been used for STING agonist delivery. J.C.R is a founder, scientific advisory board member, and stockholder of Sitryx Therapeutics, a scientific advisory board member and stockholder of Caribou Biosciences, a member of the scientific advisory board of Nirogy Therapeutics, has consulted for Merck, Pfizer, and Mitobridge within the past three years, and has received research support from Incyte Corp., Calithera Biosciences, and Tempest Therapeutics. W.K.R. has received research support from Incyte Corp. J.M.B. receives research support from Genentech/Roche, Bristol Myers Squibb, and Incyte Corporation, has received consulting/expert witness fees from Novartis, and is an inventor on patents regarding immunotherapy targets and biomarkers in cancer. K.E.B. receives funding from BMS-IASLC-LCFA, is a consultant to Aravive, and is a member of the advisory board for Aveo, BMS, Exelexis, Seagen, and Astellas.
Data and materials availability:
All materials used or generated in this study are available to researchers following appropriate standard material transfer agreements. Data are available upon request.
References:
- 1.van der Woude LL, Gorris MAJ, Halilovic A, Figdor CG, de Vries IJM, Migrating into the Tumor: a Roadmap for T Cells. Trends Cancer 3, 797–808 (2017). [DOI] [PubMed] [Google Scholar]
- 2.Johansson-Percival A, He B, Ganss R, Immunomodulation of Tumor Vessels: It Takes Two to Tango. Trends Immunol 39, 801–814 (2018). [DOI] [PubMed] [Google Scholar]
- 3.Fridman WH, Zitvogel L, Sautes-Fridman C, Kroemer G, The immune contexture in cancer prognosis and treatment. Nat Rev Clin Oncol 14, 717–734 (2017). [DOI] [PubMed] [Google Scholar]
- 4.O’Donnell JS, Teng MWL, Smyth MJ, Cancer immunoediting and resistance to T cell-based immunotherapy. Nat Rev Clin Oncol 16, 151–167 (2019). [DOI] [PubMed] [Google Scholar]
- 5.Binnewies M, Roberts EW, Kersten K, Chan V, Fearon DF, Merad M, Coussens LM, Gabrilovich DI, Ostrand-Rosenberg S, Hedrick CC, Vonderheide RH, Pittet MJ, Jain RK, Zou W, Howcroft TK, Woodhouse EC, Weinberg RA, Krummel MF, Understanding the tumor immune microenvironment (TIME) for effective therapy. Nat Med 24, 541–550 (2018). [DOI] [PMC free article] [PubMed] [Google Scholar]
- 6.Chen DS, Mellman I, Elements of cancer immunity and the cancer-immune set point. Nature 541, 321–330 (2017). [DOI] [PubMed] [Google Scholar]
- 7.Munn LL, Jain RK, Vascular regulation of antitumor immunity. Science 365, 544–545 (2019). [DOI] [PMC free article] [PubMed] [Google Scholar]
- 8.Huang Y, Kim BYS, Chan CK, Hahn SM, Weissman IL, Jiang W, Improving immune-vascular crosstalk for cancer immunotherapy. Nat Rev Immunol 18, 195–203 (2018). [DOI] [PMC free article] [PubMed] [Google Scholar]
- 9.De Palma M, Biziato D, Petrova TV, Microenvironmental regulation of tumour angiogenesis. Nat Rev Cancer 17, 457–474 (2017). [DOI] [PubMed] [Google Scholar]
- 10.Tang H, Wang Y, Chlewicki LK, Zhang Y, Guo J, Liang W, Wang J, Wang X, Fu YX, Facilitating T Cell Infiltration in Tumor Microenvironment Overcomes Resistance to PD-L1 Blockade. Cancer Cell 30, 500 (2016). [DOI] [PubMed] [Google Scholar]
- 11.Lanitis E, Irving M, Coukos G, Targeting the tumor vasculature to enhance T cell activity. Curr Opin Immunol 33, 55–63 (2015). [DOI] [PMC free article] [PubMed] [Google Scholar]
- 12.Jain RK, Normalizing tumor vasculature with anti-angiogenic therapy: a new paradigm for combination therapy. Nat Med 7, 987–989 (2001). [DOI] [PubMed] [Google Scholar]
- 13.Huang Y, Goel S, Duda DG, Fukumura D, Jain RK, Vascular normalization as an emerging strategy to enhance cancer immunotherapy. Cancer Res 73, 2943–2948 (2013). [DOI] [PMC free article] [PubMed] [Google Scholar]
- 14.Khan KA, Kerbel RS, Improving immunotherapy outcomes with anti-angiogenic treatments and vice versa. Nat Rev Clin Oncol 15, 310–324 (2018). [DOI] [PubMed] [Google Scholar]
- 15.Chauhan VP, Chen IX, Tong R, Ng MR, Martin JD, Naxerova K, Wu MW, Huang P, Boucher Y, Kohane DS, Langer R, Jain RK, Reprogramming the microenvironment with tumor-selective angiotensin blockers enhances cancer immunotherapy. Proc Natl Acad Sci U S A 116, 10674–10680 (2019). [DOI] [PMC free article] [PubMed] [Google Scholar]
- 16.Fukumura D, Kloepper J, Amoozgar Z, Duda DG, Jain RK, Enhancing cancer immunotherapy using antiangiogenics: opportunities and challenges. Nat Rev Clin Oncol 15, 325–340 (2018). [DOI] [PMC free article] [PubMed] [Google Scholar]
- 17.Schmittnaegel M, De Palma M, Reprogramming Tumor Blood Vessels for Enhancing Immunotherapy. Trends Cancer 3, 809–812 (2017). [DOI] [PubMed] [Google Scholar]
- 18.Huang Y, Yuan J, Righi E, Kamoun WS, Ancukiewicz M, Nezivar J, Santosuosso M, Martin JD, Martin MR, Vianello F, Leblanc P, Munn LL, Huang P, Duda DG, Fukumura D, Jain RK, Poznansky MC, Vascular normalizing doses of antiangiogenic treatment reprogram the immunosuppressive tumor microenvironment and enhance immunotherapy. Proc Natl Acad Sci U S A 109, 17561–17566 (2012). [DOI] [PMC free article] [PubMed] [Google Scholar]
- 19.Shrimali RK, Yu Z, Theoret MR, Chinnasamy D, Restifo NP, Rosenberg SA, Antiangiogenic agents can increase lymphocyte infiltration into tumor and enhance the effectiveness of adoptive immunotherapy of cancer. Cancer Res 70, 6171–6180 (2010). [DOI] [PMC free article] [PubMed] [Google Scholar]
- 20.Campesato LF, Merghoub T, Antiangiogenic therapy and immune checkpoint blockade go hand in hand. Ann Transl Med 5, 497 (2017). [DOI] [PMC free article] [PubMed] [Google Scholar]
- 21.Voron T, Colussi O, Marcheteau E, Pernot S, Nizard M, Pointet AL, Latreche S, Bergaya S, Benhamouda N, Tanchot C, Stockmann C, Combe P, Berger A, Zinzindohoue F, Yagita H, Tartour E, Taieb J, Terme M, VEGF-A modulates expression of inhibitory checkpoints on CD8+ T cells in tumors. J Exp Med 212, 139–148 (2015). [DOI] [PMC free article] [PubMed] [Google Scholar]
- 22.Yasuda S, Sho M, Yamato I, Yoshiji H, Wakatsuki K, Nishiwada S, Yagita H, Nakajima Y, Simultaneous blockade of programmed death 1 and vascular endothelial growth factor receptor 2 (VEGFR2) induces synergistic anti-tumour effect in vivo. Clin Exp Immunol 172, 500–506 (2013). [DOI] [PMC free article] [PubMed] [Google Scholar]
- 23.Allen E, Jabouille A, Rivera LB, Lodewijckx I, Missiaen R, Steri V, Feyen K, Tawney J, Hanahan D, Michael IP, Bergers G, Combined antiangiogenic and anti-PD-L1 therapy stimulates tumor immunity through HEV formation. Sci Transl Med 9, (2017). [DOI] [PMC free article] [PubMed] [Google Scholar]
- 24.Choueiri TK, Motzer RJ, Rini BI, Haanen J, Campbell MT, Venugopal B, Kollmannsberger C, Gravis-Mescam G, Uemura M, Lee JL, Grimm MO, Gurney H, Schmidinger M, Larkin J, Atkins MB, Pal SK, Wang J, Mariani M, Krishnaswami S, Cislo P, Chudnovsky A, Fowst C, Huang B, di Pietro A, Albiges L, Updated efficacy results from the JAVELIN Renal 101 trial: first-line avelumab plus axitinib versus sunitinib in patients with advanced renal cell carcinoma. Ann Oncol 31, 1030–1039 (2020). [DOI] [PMC free article] [PubMed] [Google Scholar]
- 25.Reck M, Mok TSK, Nishio M, Jotte RM, Cappuzzo F, Orlandi F, Stroyakovskiy D, Nogami N, Rodriguez-Abreu D, Moro-Sibilot D, Thomas CA, Barlesi F, Finley G, Lee A, Coleman S, Deng Y, Kowanetz M, Shankar G, Lin W, Socinski MA, Group IMS, Atezolizumab plus bevacizumab and chemotherapy in non-small-cell lung cancer (IMpower150): key subgroup analyses of patients with EGFR mutations or baseline liver metastases in a randomised, open-label phase 3 trial. Lancet Respir Med 7, 387–401 (2019). [DOI] [PubMed] [Google Scholar]
- 26.Gordan JD, Kennedy EB, Abou-Alfa GK, Beg MS, Brower ST, Gade TP, Goff L, Gupta S, Guy J, Harris WP, Iyer R, Jaiyesimi I, Jhawer M, Karippot A, Kaseb AO, Kelley RK, Knox JJ, Kortmansky J, Leaf A, Remak WM, Shroff RT, Sohal DPS, Taddei TH, Venepalli NK, Wilson A, Zhu AX, Rose MG, Systemic Therapy for Advanced Hepatocellular Carcinoma: ASCO Guideline. J Clin Oncol 38, 4317–4345 (2020). [DOI] [PubMed] [Google Scholar]
- 27.Garland KM, Sheehy TL, Wilson JT, Chemical and Biomolecular Strategies for STING Pathway Activation in Cancer Immunotherapy. Chem Rev 122, 5977–6039 (2022). [DOI] [PMC free article] [PubMed] [Google Scholar]
- 28.Corrales L, McWhirter SM, Dubensky TW Jr., Gajewski TF, The host STING pathway at the interface of cancer and immunity. J Clin Invest 126, 2404–2411 (2016). [DOI] [PMC free article] [PubMed] [Google Scholar]
- 29.Cai X, Chiu YH, Chen ZJ, The cGAS-cGAMP-STING pathway of cytosolic DNA sensing and signaling. Mol Cell 54, 289–296 (2014). [DOI] [PubMed] [Google Scholar]
- 30.Woo SR, Fuertes MB, Corrales L, Spranger S, Furdyna MJ, Leung MY, Duggan R, Wang Y, Barber GN, Fitzgerald KA, Alegre ML, Gajewski TF, STING-dependent cytosolic DNA sensing mediates innate immune recognition of immunogenic tumors. Immunity 41, 830–842 (2014). [DOI] [PMC free article] [PubMed] [Google Scholar]
- 31.Woo SR, Corrales L, Gajewski TF, The STING pathway and the T cell-inflamed tumor microenvironment. Trends Immunol 36, 250–256 (2015). [DOI] [PMC free article] [PubMed] [Google Scholar]
- 32.Yang H, Lee WS, Kong SJ, Kim CG, Kim JH, Chang SK, Kim S, Kim G, Chon HJ, Kim C, STING activation reprograms tumor vasculatures and synergizes with VEGFR2 blockade. J Clin Invest 130, (2019). [DOI] [PMC free article] [PubMed] [Google Scholar]
- 33.Chelvanambi M, Fecek RJ, Taylor JL, Storkus WJ, STING agonist-based treatment promotes vascular normalization and tertiary lymphoid structure formation in the therapeutic melanoma microenvironment. J Immunother Cancer 9, (2021). [DOI] [PMC free article] [PubMed] [Google Scholar]
- 34.Campisi M, Sundararaman SK, Shelton SE, Knelson EH, Mahadevan NR, Yoshida R, Tani T, Ivanova E, Canadas I, Osaki T, Lee SWL, Thai T, Han S, Piel BP, Gilhooley S, Paweletz CP, Chiono V, Kamm RD, Kitajima S, Barbie DA, Tumor-Derived cGAMP Regulates Activation of the Vasculature. Front Immunol 11, 2090 (2020). [DOI] [PMC free article] [PubMed] [Google Scholar]
- 35.Demaria O, De Gassart A, Coso S, Gestermann N, Di Domizio J, Flatz L, Gaide O, Michielin O, Hwu P, Petrova TV, Martinon F, Modlin RL, Speiser DE, Gilliet M, STING activation of tumor endothelial cells initiates spontaneous and therapeutic antitumor immunity. Proc Natl Acad Sci U S A 112, 15408–15413 (2015). [DOI] [PMC free article] [PubMed] [Google Scholar]
- 36.Anastasiou M, Newton GA, Kaur K, Carrillo-Salinas FJ, Smolgovsky SA, Bayer AL, Ilyukha V, Sharma S, Poltorak A, Luscinskas FW, Alcaide P, Endothelial STING controls T cell transmigration in an IFNI-dependent manner. JCI Insight 6, (2021). [DOI] [PMC free article] [PubMed] [Google Scholar]
- 37.Downey CM, Aghaei M, Schwendener RA, Jirik FR, DMXAA Causes Tumor Site-Specific Vascular Disruption in Murine Non-Small Cell Lung Cancer, and like the Endogenous Non-Canonical Cyclic Dinucleotide STING Agonist, 2′3′-cGAMP, Induces M2 Macrophage Repolarization. PLoS ONE 9, e99988 (2014). [DOI] [PMC free article] [PubMed] [Google Scholar]
- 38.Sivick KE, Desbien AL, Glickman LH, Reiner GL, Corrales L, Surh NH, Hudson TE, Vu UT, Francica BJ, Banda T, Katibah GE, Kanne DB, Leong JJ, Metchette K, Bruml JR, Ndubaku CO, McKenna JM, Feng Y, Zheng L, Bender SL, Cho CY, Leong ML, van Elsas A, Dubensky TW Jr., McWhirter SM, Magnitude of Therapeutic STING Activation Determines CD8(+) T Cell-Mediated Anti-tumor Immunity. Cell Rep 25, 3074–3085 e3075 (2018). [DOI] [PubMed] [Google Scholar]
- 39.Weiss JM, Guerin MV, Regnier F, Renault G, Galy-Fauroux I, Vimeux L, Feuillet V, Peranzoni E, Thoreau M, Trautmann A, Bercovici N, The STING agonist DMXAA triggers a cooperation between T lymphocytes and myeloid cells that leads to tumor regression. Oncoimmunology 6, e1346765 (2017). [DOI] [PMC free article] [PubMed] [Google Scholar]
- 40.Motedayen Aval L, Pease JE, Sharma R, Pinato DJ, Challenges and Opportunities in the Clinical Development of STING Agonists for Cancer Immunotherapy. J Clin Med 9, (2020). [DOI] [PMC free article] [PubMed] [Google Scholar]
- 41.Wehbe M, Wang-Bishop L, Becker KW, Shae D, Baljon JJ, He X, Christov P, Boyd KL, Balko JM, Wilson JT, Nanoparticle delivery improves the pharmacokinetic properties of cyclic dinucleotide STING agonists to open a therapeutic window for intravenous administration. Journal of Controlled Release 330, 1118–1129 (2021). [DOI] [PMC free article] [PubMed] [Google Scholar]
- 42.Petrovic M, Borchard G, Jordan O, Considerations for the delivery of STING ligands in cancer immunotherapy. J Control Release 339, 235–247 (2021). [DOI] [PubMed] [Google Scholar]
- 43.Shae D, Becker KW, Christov P, Yun DS, Lytton-Jean AKR, Sevimli S, Ascano M, Kelley M, Johnson DB, Balko JM, Wilson JT, Endosomolytic polymersomes increase the activity of cyclic dinucleotide STING agonists to enhance cancer immunotherapy. Nat Nanotechnol 14, 269–278 (2019). [DOI] [PMC free article] [PubMed] [Google Scholar]
- 44.Diaz-Montero CM, Rini BI, Finke JH, The immunology of renal cell carcinoma. Nat Rev Nephrol 16, 721–735 (2020). [DOI] [PubMed] [Google Scholar]
- 45.Dane EL, Belessiotis-Richards A, Backlund C, Wang J, Hidaka K, Milling LE, Bhagchandani S, Melo MB, Wu S, Li N, Donahue N, Ni K, Ma L, Okaniwa M, Stevens MM, Alexander-Katz A, Irvine DJ, STING agonist delivery by tumour-penetrating PEG-lipid nanodiscs primes robust anticancer immunity. Nat Mater 21, 710–720 (2022). [DOI] [PMC free article] [PubMed] [Google Scholar]
- 46.Wang S, Raybuck A, Shiuan E, Cho SH, Wang Q, Brantley-Sieders DM, Edwards D, Allaman MM, Nathan J, Wilson KT, DeNardo D, Zhang S, Cook R, Boothby M, Chen J, Selective inhibition of mTORC1 in tumor vessels increases antitumor immunity. JCI Insight 5, (2020). [DOI] [PMC free article] [PubMed] [Google Scholar]
- 47.Keeley EC, Mehrad B, Strieter RM, CXC chemokines in cancer angiogenesis and metastases. Adv Cancer Res 106, 91–111 (2010). [DOI] [PMC free article] [PubMed] [Google Scholar]
- 48.Chen Y, Liu X, Yuan H, Yang Z, von Roemeling CA, Qie Y, Zhao H, Wang Y, Jiang W, Kim BYS, Therapeutic Remodeling of the Tumor Microenvironment Enhances Nanoparticle Delivery. Adv Sci (Weinh) 6, 1802070 (2019). [DOI] [PMC free article] [PubMed] [Google Scholar]
- 49.Sung YC, Jin PR, Chu LA, Hsu FF, Wang MR, Chang CC, Chiou SJ, Qiu JT, Gao DY, Lin CC, Chen YS, Hsu YC, Wang J, Wang FN, Yu PL, Chiang AS, Wu AY, Ko JJ, Lai CP, Lu TT, Chen Y, Delivery of nitric oxide with a nanocarrier promotes tumour vessel normalization and potentiates anti-cancer therapies. Nat Nanotechnol 14, 1160–1169 (2019). [DOI] [PubMed] [Google Scholar]
- 50.Chen Q, Xu L, Chen J, Yang Z, Liang C, Yang Y, Liu Z, Tumor vasculature normalization by orally fed erlotinib to modulate the tumor microenvironment for enhanced cancer nanomedicine and immunotherapy. Biomaterials 148, 69–80 (2017). [DOI] [PubMed] [Google Scholar]
- 51.Sun Y, Chen W, Torphy RJ, Yao S, Zhu G, Lin R, Lugano R, Miller EN, Fujiwara Y, Bian L, Zheng L, Anand S, Gao F, Zhang W, Ferrara SE, Goodspeed AE, Dimberg A, Wang XJ, Edil BH, Barnett CC, Schulick RD, Chen L, Zhu Y, Blockade of the CD93 pathway normalizes tumor vasculature to facilitate drug delivery and immunotherapy. Sci Transl Med 13, (2021). [DOI] [PMC free article] [PubMed] [Google Scholar]
- 52.Park JS, Kim IK, Han S, Park I, Kim C, Bae J, Oh SJ, Lee S, Kim JH, Woo DC, He Y, Augustin HG, Kim I, Lee D, Koh GY, Normalization of Tumor Vessels by Tie2 Activation and Ang2 Inhibition Enhances Drug Delivery and Produces a Favorable Tumor Microenvironment. Cancer Cell 30, 953–967 (2016). [DOI] [PubMed] [Google Scholar]
- 53.Xiao W, Ruan S, Yu W, Wang R, Hu C, Liu R, Gao H, Normalizing Tumor Vessels To Increase the Enzyme-Induced Retention and Targeting of Gold Nanoparticle for Breast Cancer Imaging and Treatment. Mol Pharm 14, 3489–3498 (2017). [DOI] [PubMed] [Google Scholar]
- 54.Spitzer MH, Carmi Y, Reticker-Flynn NE, Kwek SS, Madhireddy D, Martins MM, Gherardini PF, Prestwood TR, Chabon J, Bendall SC, Fong L, Nolan GP, Engleman EG, Systemic Immunity Is Required for Effective Cancer Immunotherapy. Cell 168, 487–502 e415 (2017). [DOI] [PMC free article] [PubMed] [Google Scholar]
- 55.Edwards DN, Ngwa VM, Raybuck AL, Wang S, Hwang Y, Kim LC, Cho SH, Paik Y, Wang Q, Zhang S, Manning HC, Rathmell JC, Cook RS, Boothby MR, Chen J, Selective glutamine metabolism inhibition in tumor cells improves anti-tumor T lymphocyte activity in triple-negative breast cancer. J Clin Invest, (2020). [DOI] [PMC free article] [PubMed] [Google Scholar]
- 56.Meier SL, Satpathy AT, Wells DK, Bystander T cells in cancer immunology and therapy. Nat Cancer 3, 143–155 (2022). [DOI] [PubMed] [Google Scholar]
- 57.Motzer RJ, Penkov K, Haanen J, Rini B, Albiges L, Campbell MT, Venugopal B, Kollmannsberger C, Negrier S, Uemura M, Lee JL, Vasiliev A, Miller WH Jr., Gurney H, Schmidinger M, Larkin J, Atkins MB, Bedke J, Alekseev B, Wang J, Mariani M, Robbins PB, Chudnovsky A, Fowst C, Hariharan S, Huang B, di Pietro A, Choueiri TK, Avelumab plus Axitinib versus Sunitinib for Advanced Renal-Cell Carcinoma. N Engl J Med 380, 1103–1115 (2019). [DOI] [PMC free article] [PubMed] [Google Scholar]
- 58.Vieira P, Rajewsky K, The half-lives of serum immunoglobulins in adult mice. Eur J Immunol 18, 313–316 (1988). [DOI] [PubMed] [Google Scholar]
- 59.Moynihan KD, Opel CF, Szeto GL, Tzeng A, Zhu EF, Engreitz JM, Williams RT, Rakhra K, Zhang MH, Rothschilds AM, Kumari S, Kelly RL, Kwan BH, Abraham W, Hu K, Mehta NK, Kauke MJ, Suh H, Cochran JR, Lauffenburger DA, Wittrup KD, Irvine DJ, Eradication of large established tumors in mice by combination immunotherapy that engages innate and adaptive immune responses. Nat Med 22, 1402–1410 (2016). [DOI] [PMC free article] [PubMed] [Google Scholar]
- 60.Klebanoff CA, Gattinoni L, Palmer DC, Muranski P, Ji Y, Hinrichs CS, Borman ZA, Kerkar SP, Scott CD, Finkelstein SE, Rosenberg SA, Restifo NP, Determinants of successful CD8+ T-cell adoptive immunotherapy for large established tumors in mice. Clin Cancer Res 17, 5343–5352 (2011). [DOI] [PMC free article] [PubMed] [Google Scholar]
- 61.Hanahan D, Hallmarks of Cancer: New Dimensions. Cancer Discov 12, 31–46 (2022). [DOI] [PubMed] [Google Scholar]
- 62.Jeong SH, Yang MJ, Choi S, Kim J, Koh GY, Refractoriness of STING therapy is relieved by AKT inhibitor through effective vascular disruption in tumour. Nat Commun 12, 4405 (2021). [DOI] [PMC free article] [PubMed] [Google Scholar]
- 63.Yang K, Han W, Jiang X, Piffko A, Bugno J, Han C, Li S, Liang H, Xu Z, Zheng W, Wang L, Wang J, Huang X, Ting JPY, Fu YX, Lin W, Weichselbaum RR, Zinc cyclic di-AMP nanoparticles target and suppress tumours via endothelial STING activation and tumour-associated macrophage reinvigoration. Nat Nanotechnol 17, 1322–1331 (2022). [DOI] [PubMed] [Google Scholar]
- 64.DePeaux K, Delgoffe GM, Metabolic barriers to cancer immunotherapy. Nat Rev Immunol 21, 785–797 (2021). [DOI] [PMC free article] [PubMed] [Google Scholar]
- 65.Kranz LM, Diken M, Haas H, Kreiter S, Loquai C, Reuter KC, Meng M, Fritz D, Vascotto F, Hefesha H, Grunwitz C, Vormehr M, Husemann Y, Selmi A, Kuhn AN, Buck J, Derhovanessian E, Rae R, Attig S, Diekmann J, Jabulowsky RA, Heesch S, Hassel J, Langguth P, Grabbe S, Huber C, Tureci O, Sahin U, Systemic RNA delivery to dendritic cells exploits antiviral defence for cancer immunotherapy. Nature 534, 396–401 (2016). [DOI] [PubMed] [Google Scholar]
- 66.Sun X, Zhang Y, Li J, Park KS, Han K, Zhou X, Xu Y, Nam J, Xu J, Shi X, Wei L, Lei YL, Moon JJ, Amplifying STING activation by cyclic dinucleotide-manganese particles for local and systemic cancer metalloimmunotherapy. Nat Nanotechnol 16, 1260–1270 (2021). [DOI] [PMC free article] [PubMed] [Google Scholar]
- 67.Rodell CB, Arlauckas SP, Cuccarese MF, Garris CS, Li R, Ahmed MS, Kohler RH, Pittet MJ, Weissleder R, TLR7/8-agonist-loaded nanoparticles promote the polarization of tumour-associated macrophages to enhance cancer immunotherapy. Nat Biomed Eng 2, 578–588 (2018). [DOI] [PMC free article] [PubMed] [Google Scholar]
- 68.Decout A, Katz JD, Venkatraman S, Ablasser A, The cGAS-STING pathway as a therapeutic target in inflammatory diseases. Nat Rev Immunol, (2021). [DOI] [PMC free article] [PubMed] [Google Scholar]
- 69.Chattopadhyay S, Liu YH, Fang ZS, Lin CL, Lin JC, Yao BY, Hu CJ, Synthetic Immunogenic Cell Death Mediated by Intracellular Delivery of STING Agonist Nanoshells Enhances Anticancer Chemo-immunotherapy. Nano Lett 20, 2246–2256 (2020). [DOI] [PubMed] [Google Scholar]
- 70.Liang J, Wang H, Ding W, Huang J, Zhou X, Wang H, Dong X, Li G, Chen E, Zhou F, Fan H, Xia J, Shen B, Cai D, Lan P, Jiang H, Ling J, Cheng Z, Liu X, Sun J, Nanoparticle-enhanced chemo-immunotherapy to trigger robust antitumor immunity. Sci Adv 6, eabc3646 (2020). [DOI] [PMC free article] [PubMed] [Google Scholar]
Associated Data
This section collects any data citations, data availability statements, or supplementary materials included in this article.
Supplementary Materials
Figure S1. Effect of STAN dose on RenCa tumor growth.
Figure S2. Gene expression in EO771 tumors in response to STAN treatment.
Figure S3. Western blot analyses for p-IRF3, total IRF3, and/or STING in RenCa tumors.
Figure S4. Pilot study evaluating markers of STING activation and vascular normalization at different time points.
Figure S5. Systemic administration of STANs induces normalization of tumor vasculature in EO771 breast cancer model.
Figure S6. Systemic administration of STANs increases the number of tumor-infiltrating myeloid cells.
Figure S7. Comparing STAN treatment with concurrent or delayed αPD-L1 administration.
Figure S8. Preliminary study evaluating vascular normalization following a single intravenous dose of STANs.
Figure S9. Flow cytometric analysis of T cell infiltration into RenCa tumors.
Figure S10. Flow cytometric metric of myeloid cell populations in RenCa TME.
Figure S11. Flow cytometric analysis of VCAM1 and ICAM1 on tumor-associated endothelial cells.
Figure S12. Flow cytometric analysis of CD45.1+ OT-I T cells.
Figure S13. Flow cytometric analysis of Thy1.1+ OT-I T cells.
Figure S14. Immunophenotyping of Thy1.1+ OT-I T cells.
Figure S15. Flow cytometric analysis of Cy5-NP uptake by tumor associated cell populations.
Data Availability Statement
All materials used or generated in this study are available to researchers following appropriate standard material transfer agreements. Data are available upon request.