Abstract
It has been proposed that a localized calcium (Ca) signal at the growing end of the cleavage furrow triggers cleavage furrow formation in large eggs. We have examined the possible role of a Ca signal in cleavage furrow formation in the Xenopus laevis egg during the first cleavage. We were able to detect two kinds of Ca waves along the cleavage furrow. However, the Ca waves appeared after cleavage furrow formation in late stages of the first cleavage. In addition, cleavage was not affected by injection of dibromoBAPTA or EGTA into the eggs at a concentration sufficient to suppress the Ca waves. Furthermore, even smaller classes of Ca release such as Ca puffs and Ca blips do not occur at the growing end of the cleavage furrow. These observations demonstrate that localized Ca signals in the cleavage furrow are not involved in cytokinesis. The two Ca waves have unique characteristics. The first wave propagates only in the region of newly inserted membrane along the cleavage furrow. On the other hand, the second wave propagates along the border of new and old membranes, suggesting that this wave might be involved in adhesion between two blastomeres.
INTRODUCTION
During cytokinesis of animal cells, the contractile ring, a band consisting of bundles of F-actin and myosin, is formed at the equator of the cell (Schroeder, 1975; Mabuchi and Okuno, 1977). In large eggs that undergo unilateral cleavage, it has been proposed that localized elevation of cytosolic free calcium (Ca) ions ([Ca2+]i) at the growing end of the cleavage furrow triggers cleavage furrow formation by the activation of myosin ATPase activity through the myosin light-chain kinase (MLCK; Fluck et al., 1991; Miller et al., 1993; Chang and Meng, 1995; Webb et al., 1998), as in the case of smooth muscle (Scholey et al., 1980). However, data regarding the relevance of Ca waves in cleavage furrow formation are contradictory or incomplete. In fish eggs, it has been suggested that cleavage furrow formation is accompanied by a localized Ca wave that propagates in the subcortical layer along the growing end of the cleavage furrow (Fluck et al., 1991; Chang and Meng, 1995; Webb et al., 1998). However, in these studies, the exact positions of the furrow ends were not identified simultaneously with observation of Ca waves. In Xenopus eggs, buffering the [Ca2+]i with 1,2-bis(o-aminophenoxy)ethane-N,N,N′,N′-tetraacetic acid (BAPTA)-type Ca buffers has been shown to inhibit cleavage furrow formation and also destroy already formed contractile rings (Miller et al., 1993). Although Ca signals during cleavage of dividing cultured cells and sea urchin eggs have been reported (Poenie et al., 1985; Tombs and Borisy, 1989; Kao et al., 1990; Groigno and Whitaker, 1998), the functional role of the signal has not been determined. Timings of the signal appearances are varied during cleavage. They are not restricted to the furrow formation period and sometimes occur even after cytokinesis (Tombs and Borisy, 1989). Thus, the involvement of Ca waves in cytokinesis remains uncertain.
Another mechanism has been proposed to mediate signaling for cleavage furrow formation. The small GTPase Rho has been shown to play a key role in furrow signaling (Kishi et al., 1993; Mabuchi et al., 1993; Drechsel et al., 1996). Moreover, it has been suggested that the Rho and cdc42 pathway might regulate myosin II ATPase activity through target proteins (Uehata et al., 1997; Kawano et al., 1999). Such a mechanism for cleavage furrow formation would not require Ca waves. Therefore, we wanted to establish whether such a wave could be detected.
In previous experiments using Xenopus eggs, Muto and colleagues (1996) suggested that a Ca wave along the cleavage furrow initiates after cleavage furrow formation begins. However, in the report, the fertilization membranes were not removed, and the eggs were observed from the vegetal hemisphere. In this configuration, the growing ends of the cleavage furrow are inside the cleft between the two blastomeres and covered with the fertilization membrane, making clear observation difficult. To overcome these disadvantages, we removed the fertilization membrane and labeled the egg surface with rhodamine-wheat germ agglutinin (WGA) to visualize the growing ends of the early cleavage furrow (Noguchi and Mabuchi, 2001). We imaged wave type Ca signals with Calcium Green-1 dextran (CalG-dx) from the animal hemisphere of the egg. In addition to the Ca wave, which is the orchestrated Ca release from a global area of the cell (Marchant et al., 1999), smaller classes of Ca signal have been described. These are Ca puffs, which are thought to be Ca release from 10–30 coordinately opened Ca channels, and Ca blips, which are Ca released from single open Ca channels (Parker et al., 1996; Bootman et al., 1997; Sun et al., 1998; Marchant et al., 1999). These signals were also examined during cleavage furrow formation. Furthermore, we manipulated [Ca2+]i in the egg, and the effects on cytokinesis were examined with simultaneous monitoring of [Ca2+]i.
Our observation and characterization of Ca waves revealed that two waves have distinct characteristics that would provide a new insight for the mechanism of propagation of wave type Ca signal and its role in embryogenesis during cleavage stage.
MATERIALS AND METHODS
Handling of Animals and Eggs
Females of albino Xenopus laevis were induced to ovulate by injection of 400 U of human chorionic gonadotropin (Denka Seiyaku, Tokyo, Japan) a day before use. The eggs were inseminated and cultured as described previously (Noguchi and Mabuchi, 2001).
Preparation of Fluorescently Labeled Dextran
To prepare the volume indicator for dual imaging, 5-(and 6-)-carboxynaphthofluorescein succinimidyl ester (CNF; Molecular Probes, Inc., Eugene, OR) was conjugated to amino dextran of 10,000 MW (Molecular Probes, Inc.), for 1 h at room temperature in reaction buffer (10 mM HEPES, pH 7.5) at 9:1 molar ratio of dye and amino dextran. The reaction was stopped by addition of stop solution (50 mM Tris-HCl, 10 mM K-glutamate). Uncoupled dye was removed by centrifugation at 10,000 × g and Sephadex G-25 gel filtration.
Imaging for Ca Wave
The vitelline membrane of the fertilized egg was manually removed. The volume of injectant was determined by measuring the diameter of the droplets injected into a salad oil droplet. The fluorescent indicators were introduced within 30 min after fertilization. For imaging [Ca2+]i, 10 nl of a solution of 0.5 mM calcium Green 1-dextran 10,000 MW (CalG-dx; Molecular Probes, Inc.) and 0.5 mM rhodamine-dextran (Rhod-dx; Molecular Probes, Inc.) was injected. In case of simultaneous imaging of the cortex and [Ca2+]i, 10 nl of a solution of 0.33 mM CalG-dx and 0.67 mM CNF-dx were injected. Then, the cell surface was labeled with 2.5 μg/ml rhodamine-WGA (Vector Laboratories, Burlingame, CA) for 5 min, just before cleavage was initiated. This staining enabled us to monitor cleavage furrow progression without affecting furrow formation.
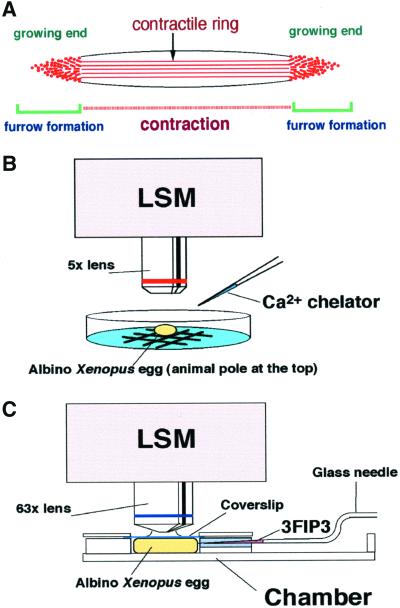
Time-lapse imaging of [Ca2+]i was carried out under a confocal laser scanning microscope (LSM; Zeiss LSM510, Carl Zeiss, Iena, Germany), equipped with a 5× Fluar lens (see Figure 1). CalG-dx was excited at 488 nm using an Argon laser line, and emitted fluorescence was collected through a 505-550 nm bandpass filter. Rhodamine dye was excited at 543 nm using a He-Ne laser line, and fluorescence was collected through a 560-615 nm bandpass filter. CNF dye was excited at 633 nm using a He-Ne laser line, and the fluorescence was collected through a 650 nm longpass filter. Each fluorescent dye was excited sequentially. Before recording, detection gains of the photomultipliers were set to make fluorescence intensities of the images of CalG-dx and that of volume indicator (Rhod-dx or CNF-dx) to be equal at the resting level. The data were processed with LSM 510 software for further analysis. Increase of fluorescent intensity is calculated as FCalG − Fvolume indicator (Rhod or CNF).
Figure 1.
Calcium imaging systems. (A) Schematic representation of the cleavage furrow and the F-actin structures. The two growing ends are the sites where the contractile ring structure is continuously formed. However, the middle region is where contraction occurs. It has been shown that rhodamine-WGA staining colocalizes with F-actin staining at the growing end of the cleavage furrow. See Noguchi and Mabuchi (2001) for detail. (B) Imaging of Ca waves was carried out using LSM at low magnification. Albino eggs were observed from the animal hemisphere to monitor the early cleavage furrow. Ca chelators were injected from the side during imaging. (C) Imaging of Ca puffs and Ca blips was carried out in a handmade chamber for scanning at high magnification using the LSM. In the chamber, the egg was compressed by a coverslip in order to flatten the cortex. The chamber has a slit at one side to introduce the glass needle for microinjection.
Microinjection of Ca Chelator during Ca Wave Imaging
Imaging of [Ca2+]i was started as described above and then paused right after the first cleavage was initiated. The LSM was switched to the bright field microscopy mode, and the Ca buffer was injected from the perpendicular position to the division plane. Then the LSM was switched back to the LSM mode, and the time-lapse recording was restarted. In the injection experiments, eggs from more than three individual female frogs were used.
Imaging of Ca Puffs and Ca Blips
Ten nanoliters of 2 mM Fluo-4 (Molecular Probes, Inc.) was injected into an albino egg within 30 min after fertilization. The growing ends of the cleavage furrow were visualized by rhodamine-WGA staining as described above. The egg was settled in a handmade chamber designed for scanning the subcortical layer of the Xenopus egg and compressed by a coverslip in order to flatten the cortex (see Figure 1). In this chamber cleavage occurred normally. Images of the growing end of the cleavage furrow and the [Ca2+]i were recorded sequentially using the LSM equipped with a 63× Plan-apochromat oil immersion lens (Zeiss). The subcortical layer a few micrometers deep from the cell surface was scanned. The thickness of the optical section was set at 3 μm. To investigate the Ca dynamics in Ca puffs and Ca blips, serial linescans in a fixed line position were performed. In Figure 3, in order to examine dynamics of the Ca in Ca puffs and Ca blips, increase of fluorescent intensity was calculated as Fincrease = F − Frest. Frest was recorded in the same position of the egg just before the Ca puff or the Ca blip. In Figure 4, increase of fluorescent intensity was calculated as Fincrease = Fn − Fn−1. Fluo-4 was compartmentalized in small vesicles in subcortical layer in the egg and made bright spots in the image. The vesicles move slowly depending on the contraction of the cleavage furrow. To minimize the noise, we subtracted the next frame. Most of the signal from the vesicles are subtracted by the same vesicle in the next frame. Although relatively large noise is left in the images, the real events are distinguishable from noise because an event is a spark in one frame that disappears in the next frame, but the noise exists continuously and moves gradually. Therefore, real events were defined as signals that appeared in a single frame and had a diameter of >1.5 μm.
Figure 3.
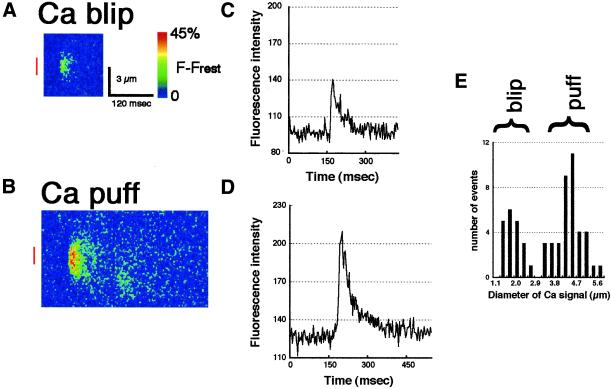
Line-scan images of Ca blips and puffs that were induced by the injection of 3FIP3 detected in the animal hemisphere. (A and B) Pseudocolor representations of local increase of free [Ca2+]i at a single Ca blip (A) and puff (B) recorded by confocal line-scanning. The changes of fluorescence intensity every 3 ms on a line at a fixed position is depicted. The abscissa represents the time and ordinate represents scale (μm). The traces in C and D show the fluorescence intensities monitored across the area indicated by red bars in A and B, respectively. Note that the signal in A is well distinguished from the background noise. Diameters, durations, and total signal masses are significantly different between Ca blips and Ca puffs. (E) A histogram showing the size distribution of Ca signal events. The half-maximal diameters of 59 Ca signals obtained from 8 eggs were measured. There are two groups of signals observed with different half-maximal diameters. The averages of the half-maximal diameters are 1.8 ± 0.45 μm in the left group (Ca blips) and 4.3 ± 0.65 μm in the right group (Ca puffs).
Figure 4.
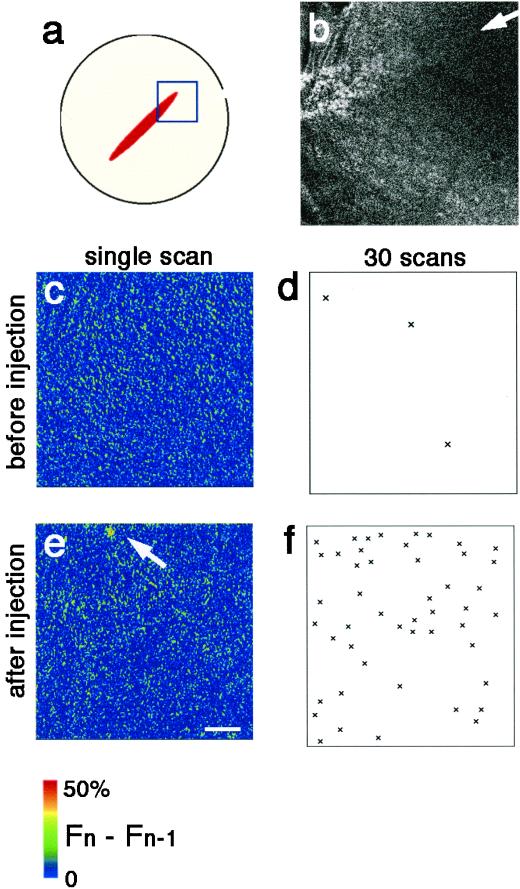
Neither Ca puffs nor Ca blips appear at the growing end of the cleavage furrow. (a) An egg at an early stage of cytokinesis was labeled with rhodamine-WGA to mark the cleavage furrow, and [Ca2+]i was monitored using Fluo-4. The area indicated by the square in a was scanned for the Fluo-4 fluorescence. Thirty frames were obtained at the speed of 0.78 s/frame. This scan speed is equal to that of the line-scan in Figure 3. After this data collection, 3FIP3 was injected near the scan area. Again 30 frames of scan images were obtained at the same speed in the same area. (b) Rhodamine-WGA staining of the growing end of the cleavage furrow shown in a. The white arrow indicates the position of the growing end of the cleavage furrow. (c and e) Representative single confocal frame scan images, showing increased free [Ca2+]i: (Fn − Fn−1) × 2 in a pseudocolor scale before (c) and after (e) 3FIP3 injection in the area shown in a. The arrow indicates a Ca blip detected after 3FIP3 injection. (d and f) Patterns of subcortical Ca release before (d) and after (f) 3FIP3 injection. The total Ca signals and their position identified in all 30 frame scans, in the same field shown in a, c, and e are marked (×). Ca signals are clearly distinguishable from noise based on their signal mass and diameters (>1.5 μm). Only three signals are detected around the growing end of the cleavage furrow before 3FIP3 injection, whereas 48 Ca microspikes including both Ca blips and Ca puffs were detected in the respective 30-frame scans after injection. Scale bar, 25 μm.
RESULTS
Ca Waves Do Not Associate with the Growing End of the Cleavage Furrow
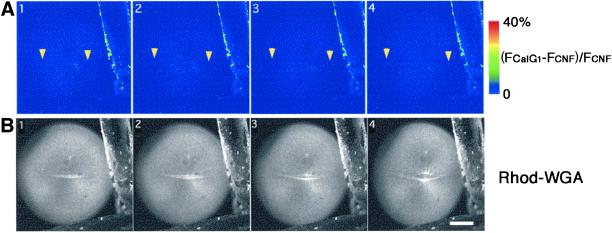
To detect any Ca signals that may propagate along the cleavage furrow, the cleavage furrow was visualized by staining with a low concentration of rhodamine-WGA. We have previously demonstrated that WGA-binding sites colocalize with F-actin and myosin in the furrow region (Figure 1A; Noguchi and Mabuchi, 2001). Figure 1 shows two types of Ca imaging system we used: one for Ca waves and the other for Ca blips and Ca puffs. To detect changes of [Ca2+]i by possible Ca wave, we injected the eggs with a Ca indicator CalG-dx. The cleavage furrow and [Ca2+]i were simultaneously monitored from the animal hemisphere of the egg, by time-lapse recording using an LSM (Figure 1B). Recordings were begun 5–10 min before cleavage initiation, and images were taken every 30 s for 20 min. This time period is long enough to monitor the advancement of the cleavage furrow from the animal pole to the vegetal hemisphere. However, no Ca wave was observed at the growing end of the cleavage furrow in any of the 200 eggs examined (Figure 2). Our inability to detect Ca waves at the cleavage furrow could not be explained by insensitivity of the imaging system or other technical problem, because this experimental system could properly detect other wave-type Ca signals (see below). Therefore, we conclude that no Ca wave accompanies cleavage furrow formation in Xenopus eggs.
Figure 2.
Dual time-lapse imaging of [Ca2+]i and the newly emerging cleavage furrow. (A) Time-lapse images at an interval of 90 s depict increasing fluorescence intensity of CalG-dx (increasing free [Ca2+]i: (FCalG− FCNF)/FCNF × 2.5) on a pseudocolor scale as indicated by the color bar. The positions of the growing ends in B are indicated with yellow arrowheads. Note that no obvious elevation of the free [Ca2+]i was detected at the growing end of the cleavage furrow. (B) Serial images of a newly emerging and elongating cleav-age furrow stained with rhodamine-WGA (the white line in the middle of the egg). Each image was simultaneously obtained with those shown in A. Scale bar, 0.2 mm.
Neither Ca Puffs nor Ca Blips Occur at the Growing End of the Cleavage Furrow
It remained possible that Ca signals occurred but were much smaller in size than could be detected using the system for wave type Ca signal. Therefore, we next asked whether smaller Ca signals such as Ca puffs and/or Ca blips might take place at the growing end of the cleavage furrow. We used a highly sensitive fluorescent Ca indicator, Fluo-4 (Haugland, 1999; Thomas et al., 2000), and the subcortical layer of the egg was scanned at a high speed and at a higher magnification (Figure 1C). To demonstrate that this system is sensitive enough to detect these small Ca releases, Ca puffs and blips were induced by injection of a poorly metabolizable derivative of InsP3, 3FIP3 (d-myo-inositol 1,4,5-triphosphate, 3-deoxy-3-fluoro-, hexasodium salt; Calbiochem, San Diego, CA), as described previously (Parker et al., 1996). The subcortical layer was subsequently scanned to reveal the Ca dynamics (See MATERIALS AND METHODS). Serial line scans (3 ms/one line scan; Figure 3) were performed to measure the temporal change of fluorescent intensity and the diameter of half-maximum intensity of the signal, respectively (Figure 3). This revealed that there were two classes of Ca signals based on their signal properties. The duration and the diameter of half-maximum intensity of Ca puff were 150–500 ms and 4.3 ± 0.65 μm, respectively, and those of Ca blips were <100 ms and 1.8 ± 0.45 μm, respectively. These data fit well with previously reported values (Sun et al., 1998). Therefore, this system is sensitive enough to detect both Ca puffs and Ca blips. Using this system, we performed scanning of the subcortical layer around the growing end of the cleavage furrow. We imaged each growing end. Total time for 30 scans is 23.4 s at a rate of 0.78 s/frame. In this time period, the cleavage furrow advances ∼50 μm. Therefore, any localized and concentrated Ca signal should be detected. We plotted the position of Ca signals to reveal the distribution of Ca releasing site. At the growing end of the cleavage furrow, almost no microspikes were detected in any of the eggs examined. (0–3 signals/egg, n = 15; Figure 4). However, in all of these eggs, numerous Ca blips and Ca puffs were seen after microinjection of 3FIP3 (30–60 signals/egg). This indicates that there was no Ca microspike occurring at the growing end of the cleavage furrow. Moreover, the plotting of Ca signal after 3FIP3 injection revealed that although Ca releasing sites are present around the growing end of the cleavage furrow, they are not noticeably concentrated there. Furthermore, there was no Ca microspike in the region of the contractile ring itself (0–2 signals in 9 eggs examined; our unpublished data). Combined with the results of the Ca wave imaging, we conclude that no localized Ca signal accompanies the propagating furrow end during the first cleavage in Xenopus eggs.
A Ca Wave that Propagates within the New Membrane Region Is Detectable
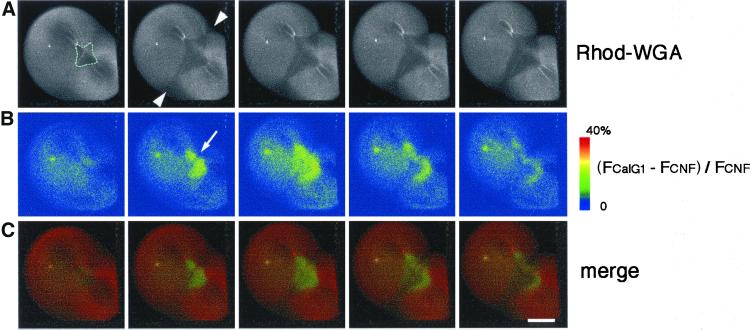
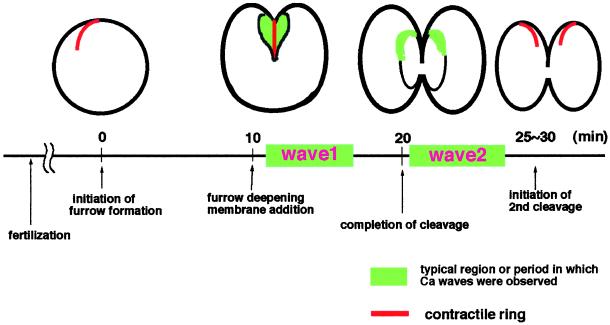
Despite the fact that we did not detect a Ca wave at the growing end of the cleavage furrow, we were able to detect other Ca waves using the CalG-dx system (Figures 5 and 6). One type of Ca wave (wave 1) appeared a few minutes after membrane insertion started in the furrow region, namely, ∼10 min after furrow emergence at the animal pole, and lasted for 5 min. Wave 1 showed some remarkable characteristics. It traversed only the region of newly inserted membranes but never propagated into the old membrane region (Figure 5C). The timing of its initiation corresponded to that of the furrow deepening. Therefore, wave 1 is likely to be the counterpart of the furrow deepening wave that has been observed in zebrafish eggs (Chang and Meng, 1995; Webb et al., 1998). However, its duration was short (∼5 min), it did not propagate into the vegetal hemisphere, and it was not seen in the contractile ring region (Figure 5B). These results strongly suggest that wave 1 is involved neither in the cleavage furrow formation nor in the contraction of the contractile ring. The speed of propagation of wave 1 was 1.66 ± 0.46 μm/s (n = 9), as measured by tracing the wave front. Thus, it is categorized as a slow Ca wave, which has been reported in some cell types (Fluck et al., 1991; Muto et al., 1996; Jaffé and Créton, 1998; Webb et al., 1998).
Figure 5.
Dual imaging of rhodamine-WGA staining and Ca wave 1. (A) A time-lapse recording of rhodamine-WGA staining of the egg surface during furrow deepening at 2-min intervals. The region where the membrane is newly inserted appears as a dark region (the area encircled by a dotted line). The arrowheads indicate the division plane. (B) Pseudocolored images of increased free [Ca2+]i; (FCalG − FCNF)/FCNF × 2.5, simultaneously obtained with the images in a, demonstrating that Ca wave 1 propagates in the furrow region. Duration of Ca wave 1 is significantly shorter than that of cytokinesis. It is excluded from the contractile ring area (arrow). (C) Merged images of (A, red) and (B, green). Wave 1 is restricted to the area of newly inserted membrane. Scale bar, 0.2 mm.
Figure 6.
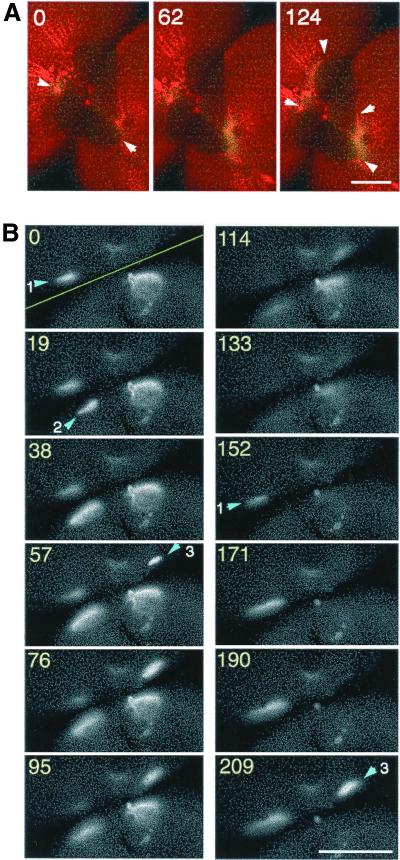
Ca wave 2 propagates along the border of old and new membranes after completion of cytokinesis. (A) Representative merged image of rhodamine-WGA staining (red) and increasing free [Ca2+]i: (FCalG − FCNF) × 2 (green) during Ca wave 2 after completion of the first cleavage. Wave 2 emerged at the animal pole and traversed along the border of old and new membranes. Arrowheads in the image at 0 s indicate the starting point of wave 2, and those in the image at 124 s indicate the wave front. Note that the egg had already divided into two blastomeres before wave 2 first appeared. (B) Gray scale images of increased free [Ca2+]i; (FCalG − FRhod) during a typical wave 2. The yellow line in “time 0” indicates the position of the division plane. Wave 2 does not propagate continuously, but often skips a distance of several hundred micrometers, reappearing along the border of the two membranes or flickering at some particular site several times. Arrowheads indicate initiation sites of wave 2. At site 1, Ca signal is flickering (the signal is seen during 0–95 s, disappears and then reappears after 152 s). There seemed to be no synchrony between the waves in the two blastomeres. Numbers indicate the recording time (seconds). Scale bars, 0.2 mm.
A Second Ca Wave Traverses along the Border of Old and New Membrane Region after Cytokinesis
A second Ca wave (wave 2) appeared after completion of the first cleavage, that is, 20–25 min after cleavage initiated (Figure 6). Thus, the time of wave 2 indicates it cannot be involved in cytokinesis. Interestingly, wave 2 was distinct from wave 1. It began mostly at the animal pole and traversed along the border of the old and the new membrane regions. It did not propagate continuously but showed a skipping and/or flickering manner of movement, but still moved only along the border. Based on these features, it is likely that wave 2 corresponds to the Ca wave previously observed along the cleavage furrow in Xenopus eggs (Muto et al., 1996). The speed of wave 2 was measured during periods when it propagated without skipping. Its speed was 1.66 ± 0.45 μm/s (n = 12), suggesting that it also belongs to the slow Ca wave class. The characteristics and time periods of wave 1 and wave 2 are summarized in Figure 7.
Figure 7.
Schematic drawings of Ca waves along the cleavage furrow during first cleavage.
Suppression of Both Wave 1 and Wave 2 by Ca Chelators Did Not Inhibit Cytokinesis
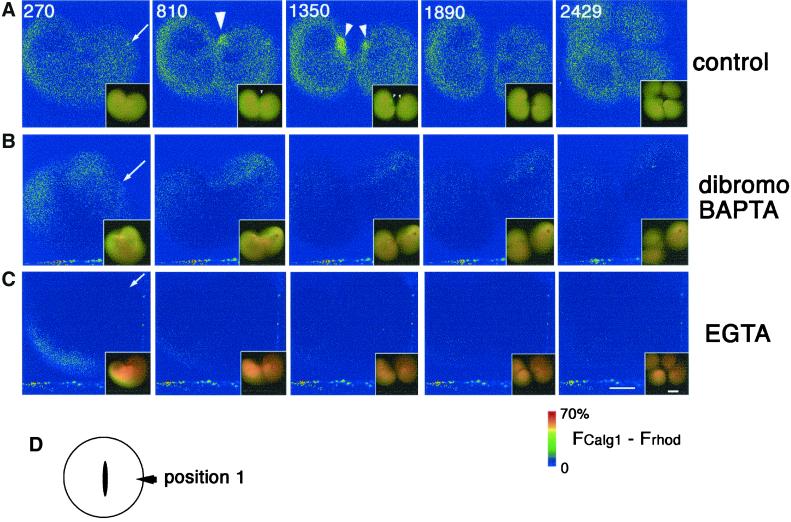
The two Ca waves that were detected along the cleavage furrow are not likely to play a role in cytokinesis because of their distribution and the timing of their appearances. To further confirm that these two Ca waves are not involved in cytokinesis, we suppressed the waves by microinjecting two types of Ca chelators into dividing eggs. We monitored [Ca2+]i and the effects on cytokinesis simultaneously (Figure 8). The results are summarized in Table 1. EGTA at an intracellular concentration of 0.9 mM effectively lowered the [Ca2+]i and suppressed both waves 1 and 2 without affecting either the first or second cleavages. Injection of dibromoBAPTA at the same concentration also clearly suppressed both waves although the extent of decrease in the [Ca2+]i was little lower than that of EGTA. The first cleavage continued and was accomplished normally. These results strongly suggest that the two Ca waves along the cleavage furrow are not involved in cytokinesis. In dibromoBAPTA injected eggs, the second cleavage occurred normally in the blastomere on the noninjected side, while it was inhibited in the blastomere on the injected side. In the control, neither the Ca wave nor cytokinesis was inhibited.
Figure 8.
dibromoBAPTA or EGTA effectively suppresses both Ca wave 1 and 2 without affecting cytokinesis. Pseudocolored time-lapse images showing the change of free [Ca2+]i after Ca chelator injections. Four nanoliters each of the injection buffer alone as control (A), 0.9 mM (final concentration in the cytosol) dibromoBAPTA (B), or 0.9 mM (final concentration) EGTA (C), were injected into dividing eggs during early furrowing at a polar region (D and arrows in A–C), and the effects on both cytokinesis and free [Ca2+]i;(FCalG − FRhod) × 1.4, were monitored. The merged raw data for CalG-dx and Rhod-dx are also presented in the right bottom of each pseudocolor image to show the appearance of the embryos. Yellow color represents the resting level of the [Ca2+]i. As the [Ca2+]i was lowered by Ca chelators, the color turned to reddish. The numbers in A indicate times (seconds) after injection. Images in B and C were obtained at the same time points. (A) In the control egg, Ca wave 1 and 2 were detected at 810 s and 1350 s, respectively (arrowheads). (B) Injection of dibromoBAPTA did not alter the free [Ca2+]i significantly as expected from its Kd for Ca ion. In the dibromoBAPTA-injected egg, both wave 1 and wave 2 were suppressed but the first cleavage was not affected or only slightly delayed. The second cleavage of the blastomere on the injection side was inhibited. Deformation occurred frequently around the site of the injection (inset of the picture of 270 s). (C) The injection of EGTA lowered the [Ca2+]i immediately and significantly. Both Ca wave 1 and wave 2 were suppressed. However, the first and second cleavages occurred normally. (D) Position of injection site. Position 1, position away from both ends of the cleavage furrow. Scale bars, 0.2 mm.
Table 1.
Effects of Ca-buffer injection on the first and second cleavages
| wave1a | wave2a | 1st cleavageb | 2nd cleavageb | |
|---|---|---|---|---|
| 45 mM KCl | 7 /9 | 9 /9 | 9 /9 | 9 /9 |
| dibromoBAPTA, 0.9 mM | 2 /13c | 4 /13c | 13 /13 | 1 /13 |
| EGTA, 0.9 mM | 0 /9 | 1 /9 | 9 /9 | 9 /9 |
Number of the eggs in which Ca wave was observed/total number examined.
Number of the eggs with normal cleavage/total number examined.
Weak signal was observed in the noninjection side of the furrow. Volume of the injectants was adjusted to 4 nl.
dibromoBAPTA Induces Aberrant and Irreversible Cortical Contraction of the Xenopus Egg
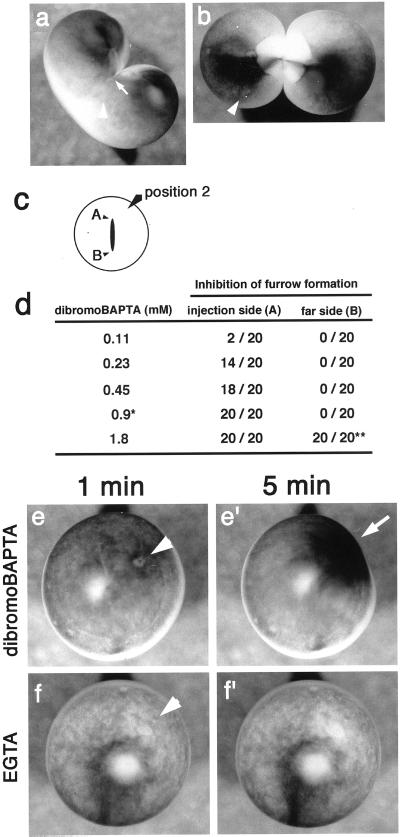
dibromoBAPTA was previously shown to inhibit furrow formation at the growing end (Miller et al., 1993). However, our data suggest that this effect is not due to change in [Ca2+]i. To investigate this inhibitor, we reexamined the effect of dibromoBAPTA on furrow formation. We injected various concentrations of dibromoBAPTA near one growing end of a furrow (Figure 9). On the side of the injection, the furrow formation was clearly inhibited in a dose-dependent manner as described previously, although it progressed normally at the other end. Combined with the result shown in Figure 8, it seems that dibromoBAPTA injection affected furrow formation only when it was injected near the growing end. This is the case even if the concentration is high enough for suppressing Ca waves (Figure 9).
Figure 9.
Effect of dibromoBAPTA and EGTA on the cortex of Xenopus eggs. (a and b) Thirty minutes after the injection of 0.45 mM dibromoBAPTA (a) or injection buffer (b) into dividing wild-type Xenopus egg. Arrowheads, injection sites; white arrow, the position of the growing end. (a) Furrow formation was clearly inhibited on the side of the injection. The growing end was drawn back to the center of the egg after its progression had stopped. On the other hand, the furrow progressed normally at the other end. In the control egg (b), both ends grew and the egg cleaved normally. (c) Positions of injection sites. Position 2, injection carried out at a position near the growing end of the cleavage furrow. (d) Dose-dependent inhibition of furrow formation by dibromoBAPTA. Progression of the furrow at the growing ends (A or B) was examined 30 min after injection. ∗, concentration (0.9 mM) used in Ca monitoring experiment in Figure 8. ∗∗, at 1.8 mM, progression of the furrow at the end B was very slow, and the egg was severely deformed. Ca buffers were injected into fertilized wild-type Xenopus eggs, and changes of the cortex were monitored 1 min (e and f) and 5 min (e′ and f′) after the injections. Arrowheads in (e) and (f) indicate the positions of injection site. Injection of 1.8 mM dibromoBAPTA (e′), induced deformation of cortex and concentration of pigment granules around the injection site (arrow). (f and f′) Injection of 6.3 mM EGTA did not cause such contraction in the cortex.
We found that aberrant cortical contraction was induced by injection of dibromoBAPTA, which led to deformation of the egg around the injection site (Figure 9, e–f′). Contraction was recognized at final concentrations from 0.45 to 3.6 mM. The deformation was irreversible for at least 6 h (n = 12 at 1.8 mM). It was also detected in the experiment shown in Figure 8. In contrast, EGTA did not show any effect on both the cortex and the furrow formation even when it was injected at concentrations up to 6.3 mM. These observations suggest that the effect of dibromoBAPTA on cleavage furrow progression is not due to its Ca-chelating ability.
DISCUSSION
Ca Signal Is Not Involved in the Furrow Formation at the Growing End of the Cleavage Furrow
Recent studies have suggested that the Ca blip is the smallest unit of Ca release in vivo (Parker et al., 1996; Bootman et al., 1997; Sun et al., 1998). We demonstrated that our experimental system for Ca imaging is sensitive enough for detecting Ca puffs and Ca blips and that these small Ca signals do not accompany cleavage furrow formation. Furthermore, suppression of the Ca waves along the cleavage furrow by lowering the [Ca2+]i did not affect the progression of the cleavage furrow. Therefore, at least in Xenopus eggs, a Ca signal is not directly involved in the formation of the contractile ring. There has been a speculation that free Ca ions might be relevant to the contractile ring formation by the following mechanism: 1) [Ca2+]i increases and Ca ions bind to calmodulin, 2) Ca calmodulin activates myosin light-chain kinase, 3) myosin light-chain kinase phosphorylates myosin regulatory light chain at the activation sites, and 4) the phosphorylated myosin somehow contributes to contractile ring formation (Matsumura et al., 1998). However, the present results indicate that in Xenopus eggs, Ca increase does not occur during formation of the contractile ring at the growing end of the cleavage furrow. Our results do not exclude the possibility that the amount of phosphorylated myosin may increase somewhere other than the cleavage furrow region by this mechanism (Mabuchi and Takano-Ohmuro, 1990; Satterwhite et al., 1992), because we could not see deep inside of the whole Xenopus egg. Then the phosphorylated myosin could be recruited to the cleavage furrow region. Alternatively, myosin might already be phosphorylated before or during mitosis. However, double staining with antibodies against phosphorylated myosin light chain and myosin heavy chain in dividing cultured cells (Matsumura et al., 1998) has shown that phosphorylation and assembly of myosin occur in close temporal proximity. In addition, biochemical experiments have been shown that myosin II is kept in an inactive state during mitosis and activated through phosphorylation after the end of mitosis in Xenopus eggs and cultured cells (Satterwhite et al., 1992; Yamakita et al., 1994). Because our data suggest that Ca ions are not directly involved in the cleavage signaling process, the alternate mechanism of myosin activation through the low-molecular-weight GTPase Rho is more likely to be involved in cleavage signaling (Kishi et al., 1993; Mabuchi et al., 1993). The pathway containing rho does not utilize free Ca ions as an activator.
Two Ca Waves along the Cleavage Furrow Are Not Involved in Cytokinesis
We also demonstrated that the two Ca waves detected along the cleavage furrow during the first cleavage are not required for cytokinesis of Xenopus eggs by two observations: 1) the Ca waves are not seen at the proper time and place. The observed waves were seen after formation and contraction of the contractile ring and even after new membranes were added in the cleavage furrow. Moreover, these waves were observed in a region of the egg spatially separated from the contractile ring. 2) Suppressing the two Ca waves with an appropriate concentration (0.9 mM) of dibromoBAPTA or EGTA did not affect cleavage. In a previous report (Miller et al., 1993), it was shown that injection of dibromoBAPTA inhibits furrow formation more effectively than EGTA. To account for the differences of their inhibitory activities, a “shuttle buffer model” was proposed. In this model, dibromoBAPTA, which has a Kd for Ca (0.15 μM) close to the [Ca2+]i of a Xenopus egg (0.3 μM), would bind to a Ca ion in an area of high [Ca2+]i and then release it immediately after diffusing to an area of low [Ca2+]i, becoming active again. On the other hand, EGTA, which has a Kd for Ca ion of 0.01 μM, would not release the Ca ion once bound. Thus, dibromoBAPTA is proposed to lower the [Ca2+]i more smoothly than does EGTA (Speksnuder et al., 1989; Miller et al., 1993; Webb et al., 1998). However, our imaging data suggest that this is not the case. In fact, EGTA suppressed the Ca waves more effectively than dibromoBAPTA. In addition, it is reported in cultured astrocytes that EGTA suppresses the wave type Ca signals more effectively than dibromoBAPTA (Wang et al., 1997). Moreover, the concentration required to suppress the Ca waves, which was 0.9 mM when injected away from the furrow ends (position 1), was lower than the concentration that inhibits cytokinesis, which was 1.8 mM when injected at the same position (our unpublished data). This may support the idea that the inhibitory activity of dibromoBAPTA on cytokinesis is not due to suppression of the Ca signal itself.
Why Does dibromoBAPTA Inhibit Furrow Formation?
We found that there was no Ca signal at the growing end as mentioned above. In addition, suppression of Ca waves by injection of Ca buffers did not affect cytokinesis. Therefore, we reexamined the dose dependency of the inhibition of furrow formation by dibromoBAPTA. Furrow formation was inhibited in dose-dependent manner; however, it is most likely that this effect is a side effect of dibromoBAPTA based on two reasons: 1) We found that the cortical region where dibromoBAPTA was injected may be structurally damaged: aberrant cortical contraction was induced and the region was deformed. This may not be induced by reducing the [Ca2+]i near the injection site because EGTA did not show any such effect. This cortical damage did not seem to be reversible, because the second division in the blastomere in the side of injection did not take place (Table 1). In addition, we found that once the cortex was damaged and deformed, it did not recover for at least 6 h after injection. 2) The inhibition took place only if dibromoBAPTA was injected near the furrow end. dibromoBAPTA inhibited furrow formation at low concentration (0.23–0.9 mM) on the side of injection, and the furrow progressed normally at the other growing end (Figure 9). When 0.9 mM dibromoBAPTA was injected at position 1 away from both ends of the cleavage furrow, the Ca wave was suppressed completely, but the egg cleaved normally (Figure 8 and Table 1).
Therefore, even at low concentration, the cortical damage by dibromoBAPTA might inhibit furrow formation if dibromoBAPTA were injected near the growing end.
Mechanism and Role of Propagation of Wave 1 and Wave 2
We demonstrated that wave 1 and wave 2 are categorized as slow Ca waves on the basis of the speed of propagation. Despite the fact that the two waves are both slow Ca waves, these two waves were markedly different from one another in location and character of propagation. The mechanism of propagation of slow Ca waves has not yet been determined, although it is suggested that IP3 is involved in Ca release (Muto et al., 1996; Webb et al., 1998).
Wave 1 propagates only within the new membrane region. The reason for this is not clear. However, one hypothesis is that just after its formation, the new membrane is immature compared with the old membrane, and the content of phospholipids might be different between the two membranes. This is the first report that Ca waves selectively propagate in different areas of the cell because of differences in the membrane.
In contrast, wave 2 propagates along the border of the old and the new membrane regions. It is known that tight junctions are formed between the two blastomeres along this region after the first cleavage is accomplished (Merzdorf et al., 1998). Moreover, [Ca2+]i rises during tight junction formation in tissue culture cells (Nigam et al., 1992). Therefore, wave 2 might be involved in tight junction formation between the blastomeres to seal up the embryo body. Another interesting aspect of this data is that along the border of the old and new membrane region, several initiation sites of Ca waves are formed in a short period at the end of the first cleavage. The distinct timing and orientation of these waves lead us to speculate that slow Ca wave propagation may involve distinct pathways for IP3 production in particular positions of the cell.
ACKNOWLEDGMENTS
We thank Dr. Andrew Miller for advice on this project and Dr. K. Miller, Dr. D. Frank, Dr. R. Hoppman, and Mr. A. Rogat for critical reading of the manuscript. This work was supported by research grants from the Ministry of Education, Culture, and Science in Japan (10213202 and 1249008). T.N. was supported by a predoctoral fellowship from the Japan Society for the Promotion of Science for Young (Doctoral) Scientists.
Footnotes
DOI: 10.1091/mbc.01–10–0501.
REFERENCES
- Bootman MD, Berridge MJ, Lipp P. Cooking with calcium: the recipes for composing global signals from elementary events. Cell. 1997;91:367–373. doi: 10.1016/s0092-8674(00)80420-1. [DOI] [PubMed] [Google Scholar]
- Chang DC, Meng C. A localized elevation of cytosolic free calcium is associated with cytokinesis in the Zebrafish embryo. J Cell Biol. 1995;131:1539–1545. doi: 10.1083/jcb.131.6.1539. [DOI] [PMC free article] [PubMed] [Google Scholar]
- Drechsel DN, Hyman AA, Hall A, Glotzer M. A requirement for Rho and Cdc42 during cytokinesis in Xenopus embryos. Curr Biol. 1996;7:12–23. doi: 10.1016/s0960-9822(06)00023-6. [DOI] [PubMed] [Google Scholar]
- Fluck RA, Miller AL, Jaffe LF. Slow calcium waves accompany cytokinesis in Medaka fish eggs. J Cell Biol. 1991;115:1259–1265. doi: 10.1083/jcb.115.5.1259. [DOI] [PMC free article] [PubMed] [Google Scholar]
- Groigno L, Whitaker M. An anaphase calcium signal controls chromosome disjunction in early sea urchin embryos. Cell. 1998;92:193–204. doi: 10.1016/s0092-8674(00)80914-9. [DOI] [PubMed] [Google Scholar]
- Haugland RP. Handbook of fluorescent probes and research chemicals. Eugene, OR: Molecular Probes; 1999. [Google Scholar]
- Jaffé LF, Creton R. On the conservation of calcium wave speeds. Cell Calcium. 1998;24:1–8. doi: 10.1016/s0143-4160(98)90083-5. [DOI] [PubMed] [Google Scholar]
- Kao JPY, Alderton JM, Tsien RY, Steinhardt RA. Active involvement of Ca2+ in mitotic progression of Swiss 3T3 fibroblasts. J Cell Biol. 1990;111:183–196. doi: 10.1083/jcb.111.1.183. [DOI] [PMC free article] [PubMed] [Google Scholar]
- Kawano Y, Fukata Y, Oshiro N, Amano M, Nakamura T, Ito M, Matsumura F, Inagaki M, Kaibuchi K. Phosphorylation of myosin-binding subunit (MBS) of myosin phosphatase by Rho-kinase in vivo. J Cell Biol. 1999;147:1023–1037. doi: 10.1083/jcb.147.5.1023. [DOI] [PMC free article] [PubMed] [Google Scholar]
- Kishi K, Sasaki T, Kuroda S, Itoh T, Takai Y. Regulation of cytoplasmic division of Xenopus embryo by rho p21 and its inhibitory GDP/GTP exchange protein (rho GDI) J Cell Biol. 1993;120:1187–1195. doi: 10.1083/jcb.120.5.1187. [DOI] [PMC free article] [PubMed] [Google Scholar]
- Mabuchi I, Hamaguchi Y, Fujimoto H, Morii N, Mishima M, Narumiya S. A rho-like protein is involved in the organization of the contractile ring in dividing sand dollar eggs. Zygote. 1993;1:325–331. doi: 10.1017/s0967199400001659. [DOI] [PubMed] [Google Scholar]
- Mabuchi I, Okuno M. The effect of myosin antibody on the division of starfish blastomeres. J Cell Biol. 1977;74:251–263. doi: 10.1083/jcb.74.1.251. [DOI] [PMC free article] [PubMed] [Google Scholar]
- Mabuchi I, Takano-Ohmuro H. Effects of inhibitors of myosin light chain kinase and other protein kinases on the first cell division of sea urchin eggs. Dev Growth Differ. 1990;32:549–556. doi: 10.1111/j.1440-169X.1990.00549.x. [DOI] [PubMed] [Google Scholar]
- Marchant J, Callamaras N, Parker I. Initiation of IP3-mediated Ca2+ waves in Xenopus oocytes. EMBO J. 1999;18:5285–5299. doi: 10.1093/emboj/18.19.5285. [DOI] [PMC free article] [PubMed] [Google Scholar]
- Matsumura F, Ono S, Yamakita Y, Totsukawa G, Yamashiro S. Specific localization of serine 19 phosphorylated myosin II during cell locomotion and mitosis of cultured cells. J Cell Biol. 1998;140:119–129. doi: 10.1083/jcb.140.1.119. [DOI] [PMC free article] [PubMed] [Google Scholar]
- Merzdorf CS, Chen Y-H, Goodenough DA. Formation of functional tight junctions in Xenopus embryos. Dev Biol. 1998;195:187–203. doi: 10.1006/dbio.1997.8846. [DOI] [PubMed] [Google Scholar]
- Miller LA, Fluck RA, McLaughlin JA, Jaffe LF. Calcium buffer injections inhibit cytokinesis in Xenopus eggs. J Cell Sci. 1993;106:523–534. doi: 10.1242/jcs.106.2.523. [DOI] [PubMed] [Google Scholar]
- Muto A, Kume S, Inoue T, Okuno H, Mikoshiba K. Calcium waves along the cleavage furrows in cleavage-stage Xenopus embryos and its inhibition by heparin. J Cell Biol. 1996;135:181–190. doi: 10.1083/jcb.135.1.181. [DOI] [PMC free article] [PubMed] [Google Scholar]
- Nigam SK, Roudriguez-Boulan E, Silver RB. Changes in intracellular calcium during the development of epithelial polarity and junctions. Proc Natl Acad Sci USA. 1992;89:6162–6166. doi: 10.1073/pnas.89.13.6162. [DOI] [PMC free article] [PubMed] [Google Scholar]
- Noguchi T, Mabuchi I. Reorganization of actin cytoskeleton at the growing end of cleavage furrow of Xenopus egg. J Cell Sci. 2001;114:401–412. doi: 10.1242/jcs.114.2.401. [DOI] [PubMed] [Google Scholar]
- Parker I, Choi J, Yao Y. Elementary events of InsP3-induced Ca2+ liberation in Xenopus oocytes: hot spots, puffs and blips. Cell Calcium. 1996;20:105–121. doi: 10.1016/s0143-4160(96)90100-1. [DOI] [PubMed] [Google Scholar]
- Poenie M, Alderton J, Tsien RY, Steinhardt R. Changes of free calcium levels with stages of the cell division cycle. Nature. 1985;315:147–149. doi: 10.1038/315147a0. [DOI] [PubMed] [Google Scholar]
- Satterwhite LL, Lohka MJ, Wilson KL, Scherson TY, Cisek LJ, Corden JL, Pollard TD. Phosphorylation of myosin-II regulatory light chain by cyclin-p34cdc2: A mechanism for the timing of cytokinesis. J Cell Biol. 1992;118:595–605. doi: 10.1083/jcb.118.3.595. [DOI] [PMC free article] [PubMed] [Google Scholar]
- Scholey JM, Taylor KA, Kendrick-Jones J. Regulation of non-muscle myosin assembly by calmodulin-dependent light-chain kinase. Nature. 1980;287:233–235. doi: 10.1038/287233a0. [DOI] [PubMed] [Google Scholar]
- Schroeder TE. Dynamics of the contractile ring. In: Inoué S, Stephens RE, editors. Molecules and Cell Movement. New York: Raven Press; 1975. pp. 305–334. [PubMed] [Google Scholar]
- Speksnuder JE, Miller AL, Weisenseel MH, Chen T-H, Jaffe LF. Calcium buffer injections block fucoid egg development by facilitating calcium diffusion. Proc Natl Acad Sci USA. 1989;86:6607–6611. doi: 10.1073/pnas.86.17.6607. [DOI] [PMC free article] [PubMed] [Google Scholar]
- Sun X-P, Callamaras N, Marchantand JS, Parker I. A continuum of InsP3-mediated elementary Ca2+ signaling events in Xenopus oocytes. J Physiol. 1998;509:67–80. doi: 10.1111/j.1469-7793.1998.067bo.x. [DOI] [PMC free article] [PubMed] [Google Scholar]
- Thomas D, Tovey SC, Collins TJ, Bootman MD, Berridge MJ, Lipp P. A comparison of fluorescent Ca2+ indicator properties and their use in measuring elementary and global Ca2+ signals. Cell Calcium. 2000;28:213–223. doi: 10.1054/ceca.2000.0152. [DOI] [PubMed] [Google Scholar]
- Tombs RM, Borisy GG. Intracellular free calcium and mitosis in mammalian cells: anaphase onset is calcium modulated, but is not triggered by a brief transient. J Cell Biol. 1989;109:627–636. doi: 10.1083/jcb.109.2.627. [DOI] [PMC free article] [PubMed] [Google Scholar]
- Uehata M, Ishizaki T, Satoh H, Ono T, Kawahara T, Morishita T, Tamakawa H, Yamagami K, Inui J, Maekawa M, Narumiya S. Calcium sensitization of smooth muscle mediated by a Rho-associated protein kinase in hypertension. Nature. 1997;386:990–994. doi: 10.1038/40187. [DOI] [PubMed] [Google Scholar]
- Wang Z, Tymianski M, Jones OT, Nedergaard M. Impact of cytoplasmic calcium buffering on the spatial and temporal characteristics of intracellular calcium signal in astrocytes. J Neurosci. 1997;17:7359–7371. doi: 10.1523/JNEUROSCI.17-19-07359.1997. [DOI] [PMC free article] [PubMed] [Google Scholar]
- Webb SE, Lee KW, Karplus E, Miller AL. Localized calcium transients accompany furrow positioning, propagation, and deepening during the early cleavage period of zebrafish embryos. Dev Biol. 1998;192:78–92. doi: 10.1006/dbio.1997.8724. [DOI] [PubMed] [Google Scholar]
- Yamakita Y, Yamashiro S, Matsumura F. In vivo phosphorylation of regulatory light chain of myosin II during mitosis of cultured cells. J Cell Biol. 1994;124:129–137. doi: 10.1083/jcb.124.1.129. [DOI] [PMC free article] [PubMed] [Google Scholar]


