

Summary
Failure of inherently protective cellular processes and misfolded protein-associated stress contribute to the progressive loss of dopamine (DA) neurons characteristic of Parkinson’s disease (PD). A disease-modifying role for the microbiome has recently emerged in PD, representing an impetus to employ the soil-dwelling nematode, Caenorhabditis elegans, as a preclinical model to correlate changes in gene expression with neurodegeneration in transgenic animals grown on distinct bacterial food sources. Even under tightly controlled conditions, hundreds of differentially expressed genes and a robust neuroprotective response were discerned between clonal C. elegans strains overexpressing human alpha-synuclein in the DA neurons fed either one of only two subspecies of Escherichia coli. Moreover, this neuroprotection persisted in a transgenerational manner. Genetic analysis revealed a requirement for the double-stranded RNA (dsRNA)-mediated gene silencing machinery in conferring neuroprotection. In delineating the contribution of individual genes, evidence emerged for endopeptidase activity and heme-associated pathway(s) as mechanistic components for modulating dopaminergic neuroprotection.
Subject areas: Neuroscience, Cognitive neuroscience
Graphical abstract
Highlights
-
•
Bacterial diet alters α-synuclein-induced Caenorhabditis elegans dopamine neuron loss
-
•
Even a subspecies-level distinction in Escherichia coli diet alters expression of >500 genes
-
•
Neuroprotective dietary effects can be transmitted in a transgenerational manner
-
•
Neuroprotection conferred by bacterial diet requires import of dsRNA into cells
Neuroscience
Introduction
The energy sources and nutrients obtained by organisms through diet are critical for all aspects of cellular physiology but can also exert influence on the predisposition to pathologies.1,2,3,4,5,6 This may be further exacerbated in many cases by health disparities in nutritional deficiencies and food insecurity that influence the composition of gut microbiota.7 Discerning dietary effects on microbial composition through advances in genomic analysis and bacterial identification (microbiome-seq; bacterial barcoding) will continue to drive discovery and expedite descriptive cataloging of clinical information.8 However, systematic analyses of bacterial influences and the mechanisms by which they exert an effect(s) on neuron health remain limited, especially in the context of their implications for disease.
The nematode model system, Caenorhabditis elegans, has been utilized to investigate the cellular, genetic, and organismal consequences of differing bacterial food sources on life history traits such as lifespan, fertility, developmental rate, quiescence, fat storage, and triacylglycerol levels.9,10,11 Indeed, different diets alter these and other phenotypes in C. elegans. C. elegans, a non-parasitic, soil and aquatic dwelling nematode species, is routinely maintained in research laboratories using several strains of E. coli that have traditionally been employed as food sources for growth and husbandry.12 Choice of bacterial source by an investigator is typically linked to methodologies designed to achieve distinct experimental outcomes. For example, specific E. coli strains that naturally grow to higher densities are used to facilitate robust growth of animals for subsequent extraction of macromolecules, biochemical analyses, or other quantitative measurements of metabolic components of C. elegans.13 Other E. coli strains have been engineered to maximize double-stranded RNA (dsRNA) production for use in RNA interference (RNAi) by bacterial feeding.14 More recent studies have already validated the prospect of identifying neuroprotective metabolites, including neurotransmitters like GABA and probiotics, from specific bacteria fed to C. elegans.15,16
The increasing burden of neurodegenerative disease across the world population represents an urgent and unmet challenge with catastrophic societal and economic consequences. The availability of well-characterized transgenic strains of C. elegans generated for investigation of human neurodegenerative diseases presents an exceptional opportunity to accelerate discovery at the knowledge interface of gut-neuron signaling. C. elegans models of multiple neurodegenerative disorders, including amyotrophic lateral sclerosis (ALS), Huntington’s disease (HD), Alzheimer’s disease (AD), frontotemporal lobar dementia (FTLD), and Parkinson’s disease (PD), have reproducibly been proven informative in discerning molecular etiologies, cellular pathways, and prospective targets for therapeutic development.17,18,19
We examined the relative impact of bacterial diet in our established C. elegans PD model of dopaminergic neurodegeneration that recapitulates the progressive, age- and dose-dependent toxicity of multicopy expression of human α-synuclein (α-syn), an intrinsically disordered protein central to the pathology of PD.20,21,22 Through a combination of genetic mutant analysis, temporal evaluation, tissue-specific RNAi knockdown, transcriptional profiling, and multi-generational growth strategies, we elucidated the response of animals hatched and reared on two common and extensively used E. coli strains (OP50 and HB101). Although OP50 and HB101 are both species of E. coli, there are some notable differences between the two. For instance, HB101 produces a visibly thicker lawn compared to OP50.9 In addition, C. elegans will actively seek higher-quality food sources over closer but harder to consume sources through foraging behavior; in food-choice assays worms preferentially eat HB101 over OP50, indicating HB101 is a higher-quality food source.23 Furthermore, worms store less fat,9 have an accelerated growth rate,10 have increased quiescence,10 and have an extended lifespan24 when grown on HB101 compared to OP50. In the context of macronutrient profile, HB101 contains 3–5x the level of carbohydrates compared to OP50, the standard laboratory food source for C. elegans.9,10
We discovered reproducible distinctions in neuroprotection were conferred by growth on HB101 when compared to OP50 E. coli; differences were further delineated through transcriptional analysis by RNA sequencing (RNA-seq) to categorize differential gene expression. Moreover, the robust neuroprotection of dopaminergic neurons elicited by growth on HB101 was sustained in a transgenerational manner. Strikingly, dopaminergic neuroprotection from α-syn overexpression was abolished in animals carrying genomic deletion or loss-of-function mutations in genes required for gene silencing by exogenous dsRNAs in C. elegans. This represents a previously unreported means through which the “gut-brain axis” exerts an influence in epigenetic response in the regulation of neurodegeneration, with potential implications for understanding environmental contributions to sporadic PD.25
The dopaminergic system functions within tightly regulated parameters that enable adaptation to external influences but also contributes to differential susceptibilities displayed by individuals in their capacity to withstand pathogenic challenges. In this regard, the set of evolutionarily conserved, functional effectors of neuroprotection identified herein represents putative genetic susceptibility factors, in addition to new therapeutic targets for PD. Among these modifiers of α-syn-induced dopaminergic neurodegeneration, we report that genes encoding conserved endopeptidases, endopeptidase inhibitors, and components of heme-signaling exhibited the highest significance of altered gene expression. Functional analysis using tissue-specific, RNAi-sensitive C. elegans strains revealed distinctions in temporal, autonomous, and cell non-autonomous effects on dopaminergic neuroprotection. This research highlights the impact that even a subtle change in the fundamental bacterial diet composition of a simple roundworm can have on susceptibility to dopaminergic neurodegeneration. By proxy, these collective results reveal potential mechanisms through which the intestinal microbiome of humans might confer enhanced susceptibility— or resilience — to PD.
Results
A diet of HB101 E. coli reduces α-syn-induced dopaminergic neurodegeneration in a transgenerational manner
While conducting routine bioassays in the context of an unrelated study using our transgenic C. elegans α-syn model of dopaminergic neurodegeneration, we anecdotally observed that worms maintained for multiple generations on HB101 E. coli reproducibly exhibited enhanced neuroprotection when compared to those grown on OP50 E. coli. We sought to formally investigate this phenomenon in more detail. To properly control for the effects of these different bacterial food sources on neurodegeneration, bacterial growth studies were first performed on both OP50 and HB101 E. coli to systematically establish consistent conditions for nematode maintenance. The quantity of viable cells and the density of liquid bacterial cultures were determined for each type of E. coli by ascertaining the colony forming units (CFUs)/mL and the optical density at 600 nm (OD600) of liquid cultures every 2 h for a total of 16 h of growth (Figures 1A and 1B). Comparable CFUs/mL and OD600 values were found when OP50 was grown for 5 h and HB101 was grown for 10 h in liquid cultures at 37°C (Figures 1A and 1B). Therefore, all subsequent investigation of phenotypes comparing OP50 and HB101 adhered to these specific bacterial growth conditions to equate exposure densities.
Figure 1.

A diet of HB101 E. coli reduces α-syn-induced dopaminergic neurodegeneration in a transgenerational manner
(A and B) Bacterial growth curve depicting (A) CFUs/mL and (B) absorbance at 600 nm (OD600) of OP50 E. coli vs. HB101 E. coli. Data points represent values obtained every 2 h of growth for a total of 16 h. Error bars represent ±SD (3 independent replicates).
(C) DA neurons scored for neurodegeneration on day 7 post-hatching, in the P0-F5 generations, in α-syn worms. Values represent mean ± S.D. (n = 30 worms per group per replicate, 3 independent replicates). Two-way ANOVA with Šídák’s post hoc analysis was used to compare OP50 and HB101 E. coli conditions to each other, in each generation. Black bars with blue border indicate groups that were grown on OP50 E. coli, but whose ancestors were grown on HB101 E. coli; ns p ≥ 0.05, ∗∗p < 0.01, ∗∗∗∗p < 0.0001.
(D) DA neurons scored for neurodegeneration on day 7 post-hatching, in the P0-F5 generations, in α-syn worms. The data in this graph are from the same dataset shown in Figure 1C; the bars represent the distribution of the entire population of 90 worms with the indicated number of degenerating dopaminergic neurons (0 through 5). The horizontal lines compare the number of worms with zero (yellow) or two (brown) degenerating neurons in OP50 vs. HB101. Values represent mean ± S.D. (n = 30 worms per group per replicate, 3 independent replicates). ns p ≥ 0.05; ∗p < 0.05; ∗∗∗p < 0.001; ∗∗∗∗p < 0.0001; two-way ANOVA with an uncorrected Fisher’s LSD post hoc test. In generations F4 and F5, the blue box around “O” refers to populations of worms whose ancestors were grown on HB101 in the previous generations, but who themselves were grown on OP50.
(E–G) These images represent the six anterior DA neurons in characteristic worms expressing GFP in the six head neurons on day 7 post-hatching. Arrowheads indicate intact DA neurons while arrows indicate degenerated DA neurons in exemplar animals as described as follows. Scale bar, 20 μm. (E) An animal grown on OP50 E. coli to the F3 generation and expresses GFP only, with a full complement of 6 anterior DA neurons. (F) An animal grown on OP50 E. coli to the F3 generation; both GFP and α-syn are independently expressed in DA neurons; 3 neurons are intact, and 3 neurons are degenerating. (G) An animal grown on HB101 E. coli to the F3 generation; both GFP and α-syn are independently expressed in DA neurons; the 6 anterior DA neurons are intact.
(H) α-syn mRNA expression levels in α-syn + OP50 and α-syn + HB101 worms. Expression is normalized to the α-syn + OP50 group. Total RNA for the comparison was isolated at the F1 generation, at day 7 post-hatching; ns p ≥ 0.05, unpaired, two-tailed Student’s t test.
(I) DA neurons were scored for degeneration on days 4 and 10 post-hatching, all in the F3 generation, in α-syn worms. Values represent mean ± S.D. (n = 30 worms per group per replicate, 3 independent replicates). Two-way ANOVA with Šídák’s post hoc analysis was used to compare OP50 and HB101 E. coli conditions to each other; ∗p < 0.05, ∗∗p < 0.01.
(J) DA neurons scored for neurodegeneration on day 4 and 10 post-hatching in the F3 generation, in α-syn worms. The data in this graph are from the same dataset shown in Figure 1I; the bars represent the distribution of the entire population of 90 worms with the indicated number of degenerating dopaminergic neurons (0 through 5). The horizontal lines compare the number of worms with zero (yellow), one (dark yellow), or three (red) degenerating neurons in OP50 (black text) vs. HB101 (blue text). Values represent mean ± S.D. (n = 30 worms per group per replicate, 3 independent replicates). ∗p < 0.05; ∗∗p < 0.01; ∗∗∗∗p < 0.0001; two-way ANOVA with an uncorrected Fisher’s LSD post hoc test.
(K and L) These images represent the six anterior DA neurons in characteristic worms expressing GFP in the six head neurons on day 4 post-hatching. Arrowheads indicate intact DA neurons while arrows indicate degenerating DA neurons. Scale bar, 20 μm. (K) This animal was grown on OP50 E. coli to the F3 generation; both GFP and α-syn are independently expressed in DA neurons; 1 neuron is degenerated. (L) The animal displayed was grown on HB101 E. coli to the F3 generation; GFP and α-syn are both expressed in DA neurons; all 6 anterior DA neurons are intact.
(M and N) These images represent the six anterior DA neurons in characteristic worms expressing GFP in the six head neurons on day 10 post-hatching. Arrowheads indicate intact DA neurons while arrows indicate degenerated DA neurons. Scale bar, 20 μm. (M) This animal was grown on OP50 E. coli to the F3 generation; GFP and α-syn are expressed in DA neurons; 5 neurons are degenerated. (N) This animal was grown on HB101 E. coli to the F3 generation; all 6 anterior DA neurons are intact.
Worms overexpressing both GFP and human wild-type α-syn under the control of the dopaminergic neuron-specific DA transporter promoter, Pdat-1, have been previously shown to display progressive neurodegeneration that worsens with age.18,26,27 α-syn-expressing hermaphrodites from the same source plate of animals were cultivated separately on either OP50 or HB101 and scored for evidence of dopaminergic neurodegeneration at day 7 post-hatching, a time point that reproducibly displays strong neurodegeneration. In the initial P0 generation, α-syn worms grown on either OP50 or HB101 exhibited similar levels of DA neuron loss (Figures 1C and 1D). Worms overexpressing only GFP under the control of the dat-1 promoter do not display any significant DA neurodegeneration (Figure 1E). Subsequent generations of animals were maintained by consistent growth on the same bacterial source, either OP50 or HB101, respectively. Starting in the F1 generation and persisting through the F3 generation, transgenic worms grown on HB101 displayed significant neuroprotection from α-syn-induced dopaminergic neurodegeneration compared to those grown on OP50 (Figures 1C, 1D, 1F, and 1G). These results were consistent on both the population and individual neuron levels (Figures 1C and 1D).
Although the transgenerational neuroprotection seen in worms grown on HB101 compared to worms grown on OP50 E. coli (neuroprotectionHB101) may be a consequence of HB101 influencing biological processes inherent to the worms, it is also possible that the HB101 induces silencing of the α-syn transgene, which would itself reduce DA neurodegeneration. To rule out either of these possibilities, real-time quantitative PCR (RT-qPCR) was performed on worms grown on OP50 and HB101 to determine the α-syn transgene expression levels. This RT-qPCR was performed at the F1 generation, a time point where neuroprotectionHB101 is observed (Figures 1C and 1D). The α-syn expression levels in the OP50 and HB101 groups were statistically insignificant from each other, indicating that neuroprotectionHB101 is not caused by a silencing of the α-syn transgene (Figure 1H).
Next, we wanted to determine if the neuroprotectionHB101 would be reduced or abolished if the diet was switched to OP50 in the next generation. To obtain the F4 generation, animals grown on OP50 in the F3 generation were used as the source to again obtain a generation of worms also grown on OP50. However, this time, worms grown on HB101 in the F3 generation were also used to establish a subsequent generation of animals grown on OP50. Interestingly, this switch in bacterial diet did not dampen the neuroprotection exhibited by the worms whose ancestors were grown on HB101 (Figures 1C and 1D). We next sought to determine how long this inherited neuroprotectionHB101 would last and so again obtained subsequent generations of both worm populations on OP50. In this final, F5 generation, worms grown on HB101 in the P0-F3 generations displayed DA neurodegeneration levels insignificantly different from animals grown on OP50 in the P0-F5 generations (Figures 1C and 1D).
Having demonstrated that neuroprotectionHB101 is robust at day 7 post-hatching, we proceeded to determine if a diet of HB101 induces neuroprotection at both an earlier and later time point. Worms were grown on either OP50 or HB101 E. coli to the F3 generation and scored for DA neurodegeneration at day 4 and 10 post-hatching. In comparison to growth on OP50, worms grown on HB101 through the F3 generation exhibited neuroprotectionHB101 at both days 4 and 10 post-hatching, both at the population and individual neuron levels (Figures 1I–1N). These results collectively illustrate the transgenerational nature of the neuroprotection that a diet of HB101 confers to worms burdened by the chronic temporal effects of multicopy α-syn expression in DA neurons.
Transcriptomic comparison of C. elegans grown on OP50 vs. HB101 E. coli
To determine genes and associated molecular pathways that may be responsible for neuroprotection HB101, we sought to employ a transcriptomic approach. Although another group has performed RNA-seq and uncovered differential transcriptional responses on worms reared on OP50 E. coli and other bacterial diets, including HB101,24 this was done in N2 worms, in the absence of α-syn. Furthermore, the aforementioned study was performed on populations of worms grown on each bacterial food source for a minimum of 30 generations, and RNA-seq was performed at the L4 larval stage of development. To accurately capture the DA neuron response to α-syn overexpression, we performed transcriptomic analyses by RNA-seq on worms grown on either OP50 or HB101 at the P0 generation, when there is an absence of neuroprotection exhibited in the HB101 group, and then again at the F3 generation, when neuroprotection exhibited in the HB101 group is robust. Table 1 details the differentially expressed genes (DEGs) with human orthologs that were upregulated and downregulated in HB101 in the F3 generation, some of which were functionally evaluated in this study. Therefore, Table 1 represents a subset of the total DEGs, all of which can be accessed in the Gene Expression Omnibus (GEO), Dataset Series: GSE210005. This analysis revealed 20 DEGs upregulated in worms grown on HB101 in the P0 generation and 23 DEGs that were upregulated in the F3 generation (Figures 2A–2C, and Table 1). Conversely, 50 DEGs were downregulated in worms grown on HB101 in the P0 generation, and 515 DEGs in the F3 generation (Figures 2A–2C and Table 1). Focusing on DEGs stemming from the F3 generation, among the 23 DEGs upregulated in the worms grown on HB101, eight (∼35%) have human orthologs (Figure 2D and Table 1). Interestingly, none of these eight genes with human orthologs are classified as being expressed in DA neurons (Figure 2D), according to the worm neuronal transcriptome database (C. elegans Neuronal Gene Expression Map & Network [CeNGEN]28). Notably, two of these DEGs exhibited a markedly higher significance (adjusted p value, Table 1) in differential gene expression: a heme-associated endopeptidase (hrg-7) and a mitochondrial creatine kinase (argk-1). The raw RNA-seq data also indicated that hrg-7 displayed the highest total level of transcripts, by far, among the eight upregulated DEGs with human orthologs identified; argk-1 had the next most abundant transcripts (GEO Dataset Series: GSE210005).
Table 1.
Differentially Expressed Genes (DEGs) (F3 generation) in transgenic C. elegans expressing human α-syn in DA neurons fed either OP50 or HB101 E. coli
| Gene | log2Fold change | p value (adjusted) | Human ortholog(s) | Function/disease relevance |
|---|---|---|---|---|
| Upregulated in transgenic worms expressing α-syn in DA neurons and fed HB101 E. coli | ||||
| hrg-7 | 2.51 | 2.52E-227 |
CTSE PGA3-5 BACE1,2 |
Predicted to enable aspartic-type endopeptidase activity. Predicted to be involved in cell death. Involved in intestine to neuron signaling and heme translocation in C. elegans. |
| argk-1 | 4.17 | 1.65E-194 |
CKMT1A, B CKB, CKM CKMT2 |
Predicted to have creatine kinase activity. Involved in ATP and hydrogen peroxide-associated metabolic processes; longevity effector of S6K. |
| H02F09.3 | 2.62 | 1.82E-8 | MUC4,5B,6, 12,16,17 | Predicted to be integral component of membrane. Uncharacterized protein with homology to mucin family. Among the most highly upregulated genes in C. elegans host-defense to S. aureus infection. |
| gsto-1 | 2.06 | 9.36E-8 | GSTO1,2 | Enables glutathione dehydrogenase (ascorbate) and glutathione transferase activity. Involved in cellular response to extracellular stimuli and response to superoxide. Human ortholog(s) implicated in Alzheimer’s and Parkinson’s disease and asthma. |
| hrg-2 | 4.40 | 8.48E-5 | FAXC | Enables heme-binding activity; metaxin-like GST domain-containing protein. |
| K09C4.1 | 4.2 | 9.62E-8 | SLC2A4, GLUT4 | Predicted integral membrane protein with homology to insulin-responsive hexose transporter; associated with type 2 diabetes. |
| nep-8 | 2.56 | 0.005 | MELL1 | Neprilysin metalloendopeptidase homolog; integral plasma membrane protein; predicted protein processing activity |
| cyp-35B2 | 2.50 | 0.014 | CYP2U1, CYP2C8 | Predicted to enable heme-binding activity; Predicted to be involved in xenobiotic metabolic processes. Human ortholog(s) implicated in hereditary spastic paraplegia. |
| Downregulated in transgenic worms expressing α-syn in DA neurons and fed HB101 E. coli | ||||
| aqp-2 | 2.28 | 3.79E-181 | AQP3-5,7,9,10 | Enables water channel activity. Involved in water transport. Human AQP orthologs are linked to PD. |
| F30H5.3 | 3.00 | 5.02E-106 | TFPI | Predicted to be involved in negative regulation of endopeptidase activity. |
| K04H4.2 | 2.84 | 2.97E-102 | LTBP4 | Predicted to enable chitin-binding activity. |
| mlt-11 | 2.59 | 1.83E-99 |
SPINT1-3 TFPI TFPI2 |
Predicted to be involved in negative regulation of endopeptidase activity. Associated with epithelia that form a protective layer against biotic and abiotic threats. Regulator of molting in C. elegans. |
| clec-78 | 2.61 | 6.09E-90 |
NOTCH2 JAG1,2 |
Predicted to enable calcium ion binding activity, metal ion binding activity; carbohydrate binding activity; homology to human NOTCH2; defense against Gram-positive bacterial infection |
| hbl-1 | 2.13 | 3.71E-42 |
ZNF131 ZNF518A, B |
Enables RNA polymerase II transcription regulatory region sequence-specific DNA-binding activity. |
| Y43F8B.3 | 2.79 | 5.68E-31 | SPINT2 WFIKKN1,2 | Predicted to be involved in negative regulation of endopeptidase activity. |
| agr-1 | 2.44 | 2.87E-24 |
AGRN EYS |
Homolog of human neuromuscular junction protein, agrin. Predicted to be involved in basement membrane assembly; cell migration; substrate adhesion-dependent cell spreading. Associated with dystroglycanopathies. |
| zag-1 | 2.35 | 5.10E-24 |
ZEB1,2 ZNF219 ZNF787 ZNF853 |
DNA-binding transcription factor, RNA polymerase II-specific and RNA polymerase II cis-regulatory region sequence-specific DNA-binding activity. Positive regulation of axon guidance and extension; regulation of neuron differentiation. |
| egl-46 | 2.47 | 6.07E-24 | INSM1,2 | Enables RNA polymerase II-specific DNA-binding transcription factor binding activity. Involved in cell fate commitment; generation of neurons; and positive regulation of exit from mitosis. |
| atf-2 | 2.42 | 1.14E-22 | NFIL3 | Enables RNA polymerase II transcriptional regulatory region sequence-specific DNA binding. Involved in negative regulation of transcription. |
| B0393.5 | 2.51 | 6.83E-16 |
LTBP1 NELL1,2 |
Predicted to enable calcium ion-binding activity. Predicted to be an extracellular matrix structural constituent involved in cell-matrix adhesion. |
Figure 2.

Transcriptomic comparison of worms grown on OP50 vs. HB101 E. coli
(A) Venn diagrams depicting number of DEGs found in various comparisons (bacteria type and generation shown) from the transcriptomic study of worms grown on HB101 vs. OP50 E. coli. The red Venn diagram shows DEGs upregulated in worms grown on HB101 E. coli, and the blue Venn diagram shown DEGs downregulated in worms grown on HB101 E. coli. Numbers in interlocking circles represent the number of DEGs that are similar between comparisons.
(B and C) Heatmaps depicting regulatory status of the differentially expressed genes (DEGs) (columns) from the transcriptomic analysis comparing worms grown on HB101 vs. OP50 E. coli (rows). Both the HB101 and OP50 E. coli groups constitute 3 replicates each. RNA was isolated at day 6 post-hatching. (B) Heatmap of the DEGs (both up- and downregulated) uncovered from worms grown on HB101 vs. OP50 E. coli at the P0 generation. (C) Heatmap of a subset of the DEGs (both up and down regulated) uncovered from worms grown on HB101 vs. OP50 E. coli at the F3 generation.
(D) A table depicting the number and percent of DEGs upregulated and downregulated in worms grown on HB101 E. coli with human orthologs, with human orthologs that are expressed in DA neurons (verified with CeNGEN), and with human orthologs that are linked to disease (wormbase.org).
Of the 515 DEGs that were downregulated in worms grown on HB101 E. coli to the F3 generation, 217 (∼42%) have human orthologs (Figure 2D and Table 1). Among these DEGs with human orthologs, 105 (∼48%) are expressed in DA neurons and 69 (∼32%) are associated with disease (Figure 2D). Among this subset of orthologous downregulated DEGs, 31 (∼14%) are associated with transcriptional regulation. Additionally, 19 (∼9%) others are associated with endopeptidase activity, with 11 (∼5%) predicted to have endopeptidase inhibitor activity and eight (∼4%) having metalloendopeptidase activity. Furthermore, seven (∼3%) DEGs with human orthologs are involved in calcium ion binding. Strikingly, only three additional DEGs were upregulated in worms grown on HB101 E. coli in the F3 generation compared to the P0 generation, whereas 465 more DEGs were downregulated in the F3 vs. P0 generation. This strongly indicates that depletion and/or suppression of transcripts represents a primary mechanism and functional outcome of the HB101-dependent dietary response.
Functional analysis of DEGs downregulated in worms grown on HB101 E. coli via RNAi knockdown
Since worms grown on HB101 exhibit dopaminergic neuroprotection from α-syn-induced neurotoxicity, we hypothesized that knockdown of the DEGs that were downregulated in response to an HB101 E. coli diet would similarly lead to neuroprotection. As our RNA-seq analysis was performed using whole animals, we further wished to discern the putative source of neuroprotective signal for individual DEGs. To address this, we utilized a tripartite comparative functional genomic approach using RNAi: 1) DA neuron-specific RNAi, 2) systemic RNAi, and 3) gut-specific RNAi. Twelve representative DEGs with human orthologs that were downregulated in worms grown on HB101 E. coli at the F3 generation were knocked down via these tissue-specific RNAi approaches. These twelve representative DEGs were chosen because of both their robust significance (low adjusted p values) and functional category. These included endopeptidase inhibitors (mlt-11, Y43F8B.3, and F30H5.3), factors that regulate gene transcription (zag-1, hbl-1, atf-2, and egl-46), genes categorized as having calcium ion binding activity (B0393.5 and clec-78), a gene that exhibits chitin binding activity (K04H4.2), an agrin-related gene involved in neuromuscular junction and cell communication (agr-1), and an aquaporin water channel (aqp-2). It is important to note that these RNAi experiments were performed using the standardized method for bacterial feeding in C. elegans, where HT115 E. coli was the type of bacteria in which target-specific dsRNA expression was engineered.14 Although using HB101 as the bacterial type for the RNAi feeding might be considered preferable, we reasoned that knocking down DEGs in animals fed HT115 E. coli would provide an unbiased approach to evaluation of gene targets identified in worms grown on HB101 compared to OP50 E. coli. Furthermore, unlike HT115 E. coli, a strain that has been engineered and optimized for its use in RNAi feeding,29 the efficacy of dsRNA production and accumulation in HB101 (or OP50) has not been scrutinized for knockdown and therefore represented an uncharacterized variable itself.
Since ∼48% of downregulated DEGs with human orthologs at the F3 generation are expressed in DA neurons (Figure 2D), we first sought to determine if knockdown of these genes cell-autonomously (only in DA neurons) induced the hypothesized dopaminergic neuroprotection. For these analyses, a DA neuron-specific RNAi strain was utilized that: 1) overexpresses both GFP and wild-type human α-syn under the control of the DA neuron-specific promoter, Pdat-1; 2) has a genetic background that is a functional null mutant of the dsRNA transporter gene sid-1; and 3) also overexpresses wild-type sid-1 in just the DA neurons.30 This promoter-directed rescue of RNAi sensitivity allows for knockdown of genes specifically in the cell type of interest and has been widely adopted to achieve selective knockdown in vivo.31 The twelve downregulated DEGs were knocked down via RNAi in this DA neuron-specific RNAi strain at day 4 and 7 post-hatching (Figures 3B and 3C). The DEGs examined are involved in various cellular processes, including water channel activity, cell communication, chitin binding activity, calcium ion binding activity, transcriptional regulation, and endopeptidase inhibitor activity (Figure 3A). On day 4 post-hatching, knockdown of five of the twelve DEGs led to significant neuroprotection, when compared to empty vector (EV) RNAi controls; this included all three endopeptidase inhibitors (mlt-11, Y43F8B.3, and F30H5.3), one out of three of the transcriptional regulators (hbl-1), and a gene that exhibits chitin binding activity (K04H4.2) (Figure 3B). On day 7 post-hatching, only one of the DEGs, egl-46, which encodes a transcriptional repressor of neuronal cell fate,32 exhibited significant neuroprotection upon knockdown (Figure 3C). Thus, the functional characterization of individual targets of transcriptomic regulation by dietary response signifies the involvement of these processes, notably endopeptidase inhibition, in the attenuation of α-syn-mediated neurotoxicity.
Figure 3.

Functional analysis of DEGs downregulated in worms grown on HB101 E. coli via RNAi knockdown
(A) Color-coded key depicting known or predicted functional classifications of DEGs shown in the bar graphs of panels.
(B and C) DA neurons were scored for degeneration on (B) day 4 and (C) day 7 post-hatching. RNAi was performed in a DA neuron RNAi-sensitive α-syn model strain (UA196). Gene transcripts knocked down are specified on the x axis, and functional category is depicted in the associated legend (A). Values represent mean ± S.D. (n = 30 worms per group per replicate, 3 independent replicates). One-way ANOVA with Dunnett’s post hoc analysis was used to compare RNAi knockdowns to empty vector (EV) controls; ∗p < 0.05, ∗∗p < 0.01.
(D and E) DA neurons were scored for degeneration on (D) day 4 and (E) day 7 post-hatching. RNAi was performed in a DA neuron RNAi-sensitive model strain, in the absence of α-syn (UA202). Gene transcripts knocked down are specified on the x axis, and functional category is depicted in the associated legend (A). Knockdown of mcu-1 (gray bars) was used as a positive control and is known to enhance dopaminergic neurodegeneration at later time points. Values represent mean ± S.D. (n = 30 worms per group per replicate, 3 independent replicates). One-way ANOVA with Dunnett’s post hoc analysis was used to compare RNAi knockdowns to empty vector (EV) controls; ns p ≥ 0.05; ∗p < 0.05, ∗∗p < 0.01; ∗∗∗p < 0.001.
(F and G) DA neurons were scored for degeneration on (F) day 4 and (G) day 7 post-hatching. RNAi was performed in a systemic RNAi α-syn model (UA44), where genes have the potential to be knocked down anywhere that sid-1 is endogenously expressed. Gene transcripts knocked down are specified on the x axis, and gene function category is depicted in the associated legend. Values represent mean ± S.D. (n = 30 worms per group per replicate, 3 independent replicates). One-way ANOVA with Dunnett’s post hoc analysis was used to compare RNAi knockdowns to empty vector (EV) controls; ns p ≥ 0.05; ∗∗p < 0.01; ∗∗∗p < 0.001.
(H and I) DA neurons were scored for degeneration on (H) day 4 and (I) day 7 post-hatching. RNAi was performed in an intestinal-specific RNAi-sensitive α-syn model (UA310). Gene transcripts knocked down are specified on the x axis, and gene function category is depicted in the associated legend. Values represent mean ± S.D. (n = 30 worms per group per replicate, 3 independent replicates). One-way ANOVA with Dunnett’s post hoc analysis was used to compare RNAi knockdowns to empty vector (EV) controls; ns p ≥ 0.05; ∗p < 0.05; ∗∗p < 0.01.
In order to determine if these twelve downregulated DEGs impact DA neuron health when they were knocked down in the absence of α-syn, a DA neuron-specific RNAi strain was utilized that: 1) overexpresses only GFP under the control of the DA neuron-specific promoter, Pdat-1; 2) has a genetic background that is a functional null mutant of the dsRNA transporter gene sid-1; and 3) also overexpresses wild-type sid-1 in just the DA neurons. This strain, similar to the strain used in Figures 3B and 3C but without overexpression of α-syn, facilitates determining if knockdown of a gene of interest, in and of itself, enhances neurodegeneration in an α-syn-independent manner. On day 4 post-hatching, none of the twelve DEGs led to enhanced neurodegeneration when knocked down, when compared to EV RNAi controls (Figure 3D). On day 7 post-hatching, however, three of the twelve DEGs (aqp-2, K04H4.2, and zag-1) enhanced neurodegeneration when knocked down in the absence of α-syn, indicating that these genes are at least partly involved in maintaining DA neuron health (Figure 3E).
Although half of the twelve downregulated DEGs exhibited neuroprotection in α-syn worms when knocked down specifically in the DA neurons, we wanted to determine if knockdown of the other six DEGs that did not exhibit neuroprotection would affect neurodegeneration when knocked down in a cell non-autonomous manner. To address this, these six genes were targeted by RNAi in a strain that still had α-syn and GFP overexpressed only in DA neurons but in a wild-type background (vs. sid-1 mutant); we termed this “systemic” knockdown. C. elegans neurons have been previously established as being normally recalcitrant to RNAi, presumably due to lower levels of sid-1 expression than other somatic cells.33 Therefore “systemic”, as defined here, is more precisely described as being sensitive to dsRNA gene silencing everywhere except in the nervous system. On day 4 post-hatching, none of the six DEGs (agr-1, aqp-2, B0393.5, clec-78, atf-2, and zag-1) that had exhibited a loss of neuroprotective activity when knocked down in the DA neuron-specific RNAi strain with α-syn were protective when knocked down in the systemic RNAi strain (Figure 3F). On day 7 post-hatching, however, knockdown of three of these six DEGs, including aqp-2 (an aquaporin), clec-78 (a predicted carbohydrate and calcium ion binding factor involved in pathogen defense response), and zag-1 (a transcriptional regulator), each independently resulted in robust neuroprotection when compared to EV RNAi controls (Figure 3G). Considering that aqp-2, clec-78, and zag-1 were only neuroprotective at the later time point, we aimed to gain a better understanding as to what tissue type was responsible for the temporally distinctive neuroprotection observed when these genes are depleted.
Since neuroprotectionHB101 is rooted in a bacterial diet that is processed in the gut, we reasoned this organ to be a logical contributor to neuroprotection, especially since increasing evidence of a connection between the gut and neurodegeneration has emerged.25,34,35,36,37,38 We approached this by utilizing a modified version of an established gut-specific RNAi strain that still overexpresses both GFP and human α-syn in the DA neurons (Figures 3H and 3I). This strain contains a mutation in a primary argonaut protein-encoding gene, rde-1, that renders animals resistant to RNAi but is also engineered to overexpress wild-type rde-1 under control of the gut-specific nhx-2 promoter39; RNAi knockdown is therefore delimited to the gut in this strain. None of the three DEGs (clec-78, aqp-2, and zag-1) that were neuroprotective when knocked down in the systemic RNAi background displayed neuroprotection in the gut-specific RNAi strain when knocked down on day 4, post-hatching (Figure 3H). However, on day 7 post-hatching, two of these three DEGs, aqp-2 and zag-1, were significantly neuroprotective following knockdown in the gut-specific RNAi strain (Figure 3I). Thus, the functional consequences on DA neurons observed with these targets emanate from the gut. The combined results of these tissue-specific comparative RNAi analyses serve to describe how dietary distinctions manifest in the cumulative functional effects conveyed by downregulation of specific genes that contribute to neuroprotectionHB101.
hrg-7 is required for HB101 E.coli-induced neuroprotection
Although the vast majority of DEGs identified in the F3 generation were downregulated in response to growth on HB101 E. coli, 23 other DEGs were upregulated (Figure 2A). Among these DEGs with human orthologs, two of the most highly upregulated genes with the strongest adjusted p values of significance were those encoding a heme-associated endopeptidase, hrg-7 (an ortholog of human CTSE [cathepsin E]), and a mitochondrial-associated creatine kinase ortholog, argk-1 (Table 1). Endopeptidases have been implicated in the etiology of PD and other neurodegenerative diseases; cathepsins specifically have been shown to modulate α-syn degradation.40,41,42 Likewise, mitochondrial creatine kinase has been identified as a potential biomarker for PD, as levels of this protein are decreased in the blood serum of PD patients.43 This is consistent with our observations since there are significantly more argk-1 transcripts in neuroprotective worms grown on HB101 E. coli, compared to the relatively more neurodegenerative group fed OP50 E. coli.
Since transgenic α-syn worms grown on HB101 E. coli exhibit dopaminergic neuroprotection (Figures 1C and 1D), we hypothesized that animals harboring genomic mutations in upregulated DEGs would no longer maintain this neuroprotective capability. To determine if loss of the heme-associated endopeptidase encoding gene, hrg-7, in an α-syn background limits neuroprotectionHB101, α-syn worms were crossed to hrg-7(tm6801) deletion mutants and then similarly cultivated through the F2 generation (Figure 4A). NeuroprotectionHB101 was completely lost in α-syn worms harboring the hrg-7(tm6801) mutation (Figure 4A). This points to the differential expression of hrg-7 in response to a diet of HB101 E. coli as being necessary for neuroprotectionHB101. Importantly, the HRG-7 protein has been shown to act as a secreted signaling factor from the intestine to neurons and functions to regulate heme homeostasis.44 Given that hrg-7 expression is highly upregulated in worms cultivated on HB101, heme homeostasis may represent a critical process underlying the observed difference in neuroprotection. Significantly, the worm hrg-2 gene, encoding a hypodermal heme-binding membrane protein, exhibited the greatest fold change in differential upregulation (4.4-fold increase in transcripts) between animals fed either HB101 or OP50 E. coli (Table 1). Expression of hrg-2 was previously reported to be substantially increased (>200-fold) in response to heme deficiency in C. elegans, and hrg-2 functionally complemented a growth defect in a heme-deficient mutant strain of yeast.45
Figure 4.

hrg-7 is required for HB101 E. coli-induced neuroprotection
(A and B) DA neurons scored for neurodegeneration on day 7 post-hatching, in the P0-F2 generations. Genotypes tested were (A) α-syn expressed in the DA neurons of animals with the hrg-7(tm6801) mutation and (B) α-syn expressed in the DA neurons of animals the argk-1(ok2973) mutation. GFP was co-expressed in the DA neurons of all animals to visualize neuron morphology and survival. Values represent mean ± S.D. (n = 30 worms per group per replicate, 3 independent replicates). Two-way ANOVA with Šídák’s post hoc analysis was used to compare OP50 (black text) and HB101 (blue text) E. coli conditions to each other; ns p ≥ 0.05; ∗∗p < 0.01.
To ascertain whether the creatine kinase gene ortholog, argk-1, independently impacted neuroprotectionHB101, α-syn worms crossed to argk-1(ok2973) deletion mutants were employed in the comparative transgenerational diet scheme through the F2 generation (Figure 4B). Whereas no protection on either HB101 or OP50 was observed in the P0 generation, growth on HB101 E. coli remained significantly protective starting in F1 and persisting through the F2 generation of worms with the argk-1 mutation. In contrast to the hrg-7 deletion (Figure 4A), this indicates that argk-1 is not essential for the sustained neuroprotection conferred by an HB101 diet.
Mutations in genes required for dsRNA-induced gene silencing impede HB101-mediated neuroprotection
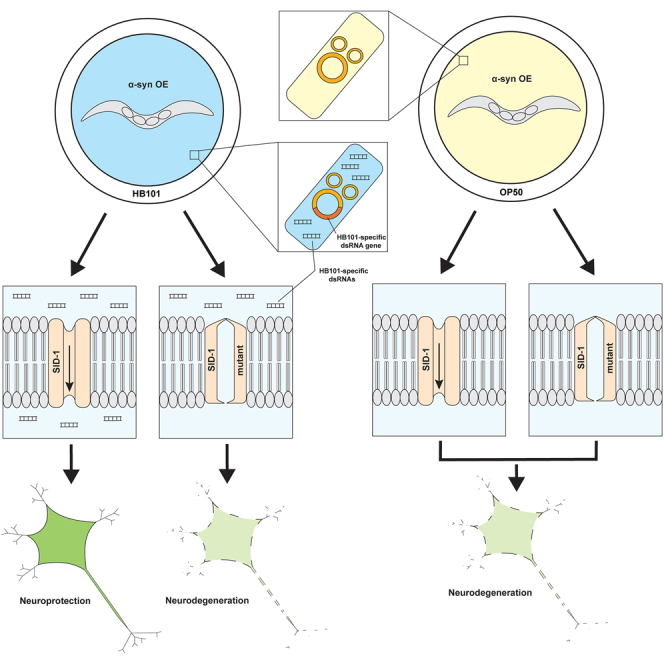
The fact that considerably more DEGs were downregulated in response to a diet of HB101 E. coli compared to genes that were upregulated suggested that an organismal mechanism for gene silencing might be triggered in this scenario. To examine this prospect, α-syn animals were crossed to mutants characterized as being deficient in distinct aspects of dsRNA-mediated gene silencing in C. elegans (Figure 5A–5E). We first evaluated if dsRNA transport into cells affected neuroprotectionHB101 by crossing our transgenic α-syn animals to worms mutant in the sid-1 gene. Systemic RNAi defective 1 (SID-1) is a conserved dsRNA transporter that allows for the silencing of genes by dsRNAs originating from outside of target cells, such as other cells in the animal or exogenous, bacterially produced dsRNAs.46,47 Thus, sid-1 mutants are resistant to RNAi. Using a characterized sid-1 mutant previously shown to be resistant to RNAi,48 we found that α-syn worms with the sid-1(pk3321) mutation did not exhibit neuroprotectionHB101 (Figure 5A), implying that gene silencing by mobile dsRNAs is critical for the effect of diet. Conversely, to discern if overexpression of sid-1 in the DA neurons in the same sid-1(pk3321) mutant background was sufficient to rescue neuroprotectionHB101, the DA neuron-specific RNAi strain with α-syn previously used (Figure 3) was employed to evaluate differences in bacterial diet. In this scenario, the transport of mobile dsRNA into cells to induce gene silencing is limited exclusively to the DA neurons. Significantly, the capacity for dietary neuroprotectionHB101 remained absent in these animals, indicating that SID-1 function, and thus dsRNA transport in cell types other than DA neurons, are essential for the attenuation of α-syn-induced dopaminergic neurodegeneration associated with HB101-fed animals (Figure 5B).
Figure 5.

Mutations in genes associated with dsRNA-mediated gene silencing impede HB101 E. coli-induced neuroprotection from α-syn toxicity to DA neurons
(A–E) DA neurons scored for neurodegeneration on day 7 post-hatching, in the P0-F2 generations. Neurodegeneration data corresponding to both the population (top) and individual neuron (bottom) levels are present. Genotypes tested here include (A) α-syn overexpression in DA neurons with the sid-1(pk3321) mutation, (B) α-syn in DA neuron-specific RNAi strain with sid-1(pk3321) rescued only in the DA neurons, (C) α-syn in DA neurons of animals with the sid-3(ok973) mutation, (D) α-syn in DA neurons of animals with the sid-2 (gk505) mutation, and (E) α-syn in DA neurons of animals with the hrde-1(tm1200) mutation. GFP was co-expressed in the DA neurons of all strains to visualize neuron morphology and survival. In the population degeneration graphs (top), values represent mean ± S.D. (n = 30 worms per group per replicate, 3 independent replicates). Two-way ANOVA with Šídák’s post hoc analysis was used to compare OP50 (black text) and HB101 E. coli (blue text) conditions to each other; ns p ≥ 0.05, ∗p < 0.05. In the individual neuron degeneration graphs (bottom), the bars represent the distribution of the entire population of 90 worms with the indicated number of degenerating dopaminergic neurons (0 through 5); the horizontal lines compare the number of worms with zero (yellow), one (dark yellow), or two (brown) degenerating neurons in OP50 vs. HB101. Values represent mean ± S.D. (n = 30 worms per group per replicate, 3 independent replicates). ns p ≥ 0.05; ∗p < 0.05; ∗∗p < 0.01; ∗∗∗p < 0.001; ∗∗∗∗p < 0.0001; two-way ANOVA with an uncorrected Fisher’s LSD post hoc test.
Another established factor involved in gene silencing, sid-3, was also investigated in the context of differential diet effect. Like sid-1, the sid-3 gene encodes a protein involved in the import of dsRNA but in a distinct way as it is a cytoplasmic non-receptor tyrosine kinase that functions to prevent clathrin-dependent endocytosis and thereby impedes internalization membrane proteins.49,50 It has been demonstrated that sid-3 mutants exhibit reduced sensitivity to RNAi, likely due to increased endocytosis of the SID-1 dsRNA transporter on plasma membrane surfaces in these animals.49 It therefore follows that when α-syn worms with the sid-3(ok973) mutation were grown on either OP50 or HB101, neuroprotectionHB101 was lost (Figure 5C). Although, this loss of neuroprotection in sid-3 mutants was to a lower extent compared to sid-1 mutants, as can be seen in the individual neuron data (Figure 5C). This provides further evidence that dsRNA-mediated gene silencing is critical for the mechanism underlying dietary neuroprotectionHB101.
Next, we wanted to determine if HB101 E. coli may be altering expression of endogenous dsRNAs within C. elegans, or alternatively, if these bacteria were an actual source of dsRNAs that accessed tissues of C. elegans to induce the observed neuroprotectionHB101. To address this, we crossed α-syn worms to sid-2 mutants. The SID-2 protein functions to transport dsRNAs from the lumen of the intestine into the intestinal cells themselves.51,52 Therefore, sid-2 mutant worms are largely resistant to bacterial-derived dsRNA feeding.52 When sid-2 mutants overexpressing α-syn in the DA neurons were fed either OP50 or HB101 for three generations, neuroprotectionHB101 was not observed (Figure 5D). This suggests that the previously observed neuroprotectionHB101 was a likely result of dsRNAs originating from the bacteria themselves. Although this effect is novel in the specific context of α-syn-induced dopaminergic neurodegeneration, precedent exists for E. coli-derived small RNAs impacting C. elegans physiology, including processes such as chemosensation and longevity.53,54 Likewise, small RNAs from the C. elegans pathogen, Pseudomonas aeruginosa, have been identified as triggers of transgenerational and heritable avoidance behavior.55,56
To determine if defects in RNAi and gene silencing influence neuroprotectionHB101 in another mechanistic manner, transgenic α-syn worms were crossed to animals mutant for hrde-1. HRDE-1 is an argonaut protein involved in RNAi; maintenance of heritable, transgenerational gene silencing by small interfering RNAs (siRNAs) is mediated through the germline and is hrde-1 dependent.57,58 Due to the established function of HRDE-1, we hypothesized that neuroprotectionHB101 would not be observed in hrde-1 mutants, due to the transgenerational nature of the phenomenon. Alternatively, any neuroprotectionHB101 that was exhibited would be unable to persist. Interestingly, when α-syn worms with the hrde-1(tm1200) deletion mutation were examined for differential dietary effects, in contrast to growth on OP50, neuroprotection was observed in animals grown on HB101 in the initial P0 generation; an effect not observed in α-syn-only worms in the wild-type background or with any other mutation tested herein (Figure 5E). Moreover, this initial HB101-induced neuroprotection was lost and did not persist in the subsequent F1 and F2 generations (Figure 5E).
Along with the results obtained using the sid (systemic RNAi-defective) mutant strains, these combined data implicate the C. elegans dsRNA-mediated gene silencing machinery as being mechanistically critical for the selective dietary influence on dopaminergic neuroprotection afforded by growth on HB101 E. coli. Consequently the neuroprotection observed is an outcome of substantial organismal transcriptional reprogramming, evidenced by way of the differential regulation of gene expression that has been revealed (Figure 2). The mechanistic significance of these genes is bolstered by the evolutionary conservation between the worm and human proteins they encode and the functional consequences on dopaminergic neurodegeneration discerned.
Discussion
Distinctions in nutrient and energy content of dietary choices can have drastic and far-reaching consequences for overall health and can dictate the predisposition to a variety of life history traits and disease states. Recent research integrating human microbiome analysis with clinical datasets strongly indicates that changes in gastrointestinal bacterial flora coincide with pathogenesis among PD patient populations and can be impacted by medications.59,60 While important and exciting, the myriad of familial, pharmacological, dietary, epigenetic, and aging-associated influences involved in such human studies represent a daunting task to interpret. Moreover, experimental strategies aimed at mechanistically addressing the topic of dietary influences across generational barriers are inherently challenging to implement in mammalian systems given the complexities associated with controlling for numerous variables, in addition to the time and cost involved.
At first glance, it is tempting to underestimate the putative outcomes that might be expected from the overt simplicity of an analysis that consists of growing statistically robust numbers of isogenic nematodes, under tightly controlled conditions (temperature, time, synchronized age, bacterial density, etc.), where the primary experimental variable evaluated is limited to one of two bacterial food sources—of the same genus and species (E. coli). The fact that this study identified numerous, evolutionarily conserved factors associated with neuroprotection selectively conferred by feeding animals HB101 E. coli illustrates just how complex and intricate an organismal response can be elicited by even a subtle microbial change in diet. Specifically, this is reflected by the altered expression of hundreds of genes coordinately yielding a benefit for DA neurons in the context of α-syn toxicity.
The data presented here implicate small RNAs originating from HB101 themselves as a cause and/or trigger for neuroprotection. Evidence for this comes from the observation that C. elegans sid-2 mutants, which are unable to import dsRNAs originating from within the lumen of the worm intestine,51,52 do not exhibit neuroprotectionHB101 (Figure 5D). It is also likely that siRNAs, specifically, are the type of bacterial-derived small RNAs responsible for neuroprotectionHB101 since hrde-1 mutants, in which transgenerational inheritance of siRNAs is blocked,57 displayed neuroprotection initially in P0 animals that was eliminated in subsequent generations (Figure 5E). Our original observation showing that an initial generation (P0) of transgenic α-syn worms reared on HB101 does not exhibit neuroprotection, but that the decedents of these animals are protected (Figures 1C and 1D), indicates that a priming period may be involved for subsequent neuroprotection to emerge. Therefore, since the hrde-1 mutation was immediately protective in the P0 generation, this perhaps indicates that, in the absence of HRDE-1 argonaut activity, the transcriptional response to HB101 was more robustly impacted by siRNAs originating directly from HB101, compared to when HRDE-1 function is intact. In fact, a recent study suggests that HRDE-1 simultaneously acts to initiate heterochromatin silencing and stimulate small-RNA amplification.61 Here we hypothesize that dsRNAs originating from HB101 itself silence target genes in worms, which leads to neuroprotection. However, it is apparent from numerous experiments (Figures 1C, 1D, 4B, and 5) that the silencing from these dsRNAs must be inherited and presumably amplified for neuroprotection to rise to the level of detection with our neurodegeneration assays. Taking this into consideration, hrde-1 mutants may exhibit an enhanced heterochromatin state in the P0 generation, and therefore genes may be silenced to a larger degree compared to when hrde-1 is wild-type. Moreover, dsRNAs may be more abundant in hrde-1 mutants. This may at least partially explain the HB101-induced neuroprotection in the P0 generation in hrde-1 mutants.
Furthermore, since sid-1 and sid-3 mutants abolish dopaminergic neuroprotectionHB101 (Figures 5A and 5C), this suggests that dsRNAs are imported into cells and silence the target genes that subsequently lead to neuroprotectionHB101. More specifically, the cells that these dsRNAs directly affect are unlikely to be the DA neurons themselves, given the results described in Figure 5B, demonstrating that neuroprotectionHB101 does not occur when sid-1 expression is selectively restored to the DA neurons but remains mutant in all other tissues, thereby preventing systemic sensitivity to RNAi. We recently reported that SID mutants provide neuroprotection in the same transgenic model used in this study and, in addition, modulate dsRNA-induced neurodegeneration.62 Whereas that prior analysis focused on the effect of sid-1-dependent changes in gene expression, without varying bacterial food sources, we observed no overlap between genes identified as effectors of α-syn-induced dopaminergic neurodegeneration in that former study with the DEGs reported herein.
So, while we provide further evidence that SID mutants and, by extension, the process of dsRNA-mediated gene silencing modulate the susceptibility to α-syn-induced neurodegenerative states; this current study establishes newfound, inciting factors underlying the organismal response surrounding neuroprotection—and how it is differentially modulated by microbial food sources.
One of the most intriguing results from this investigation was the observation that worms reared on the neuroprotective HB101 E. coli for multiple generations, but then transferred to OP50 E. coli for growth and reproduction of a subsequent generation, still retained the neuroprotectionHB101 acquired by their ancestors (Figures 1C and 1D). This persistence of neuroprotection in the absence of the trigger (HB101) alludes to an inheritance of epigenetic signal(s) for at least one subsequent generation. This may either come in the form of dsRNAs themselves or as a consequence of dsRNA action. Perhaps a multi-generational diet of HB101 alters the global pattern of histone post-translational modifications such as methylation or acetylation, thereby changing the epigenetic landscape and leading to a neuroprotective phenotype in the context of this study. Indeed, small non-coding RNAs have been shown to augment the epigenetic landscape in this way.63 Neuron to germline transmission of endogenous siRNAs has already been demonstrated in C. elegans, representing a means by which sensory signaling and behaviors can be inherited in a transgenerational manner.64,65 Additional investigations involving small RNA transcriptomic analyses may provide clarity about the specific type(s) of molecular factors involved in transmission of an HB101-dependent neuroprotective signal.66 While our focus here is on dopaminergic neuron degeneration (in the context of PD); experimental strategies that delve into RNA editing or processing, or chromatin modifications, such as methylation or acetylation site differences, could potentially discern relevant epigenetic marks or modifiers associated with the heritability of the neuroprotection observed.67,68
The preponderance of transcriptional repression uncovered in the HB101-dependent neuroprotective response is indicative of altered transcription factor activity. Thus, it was significant to also find that knockdown of both the hbl-1 and egl-46 genes in DA neurons of α-syn worms led to neuroprotection (Figures 3B and 3C). Both of these genes facilitate transcription factor binding activity, and their depletion could, in turn, decrease the abundance of other transcripts characterized as downregulated in worms grown on HB101 E. coli. Three other targets (aqp-2, clec-78, and zag-1) originating from the downregulated transcriptomic dataset did not induce neuroprotection when knocked down only in DA neurons of α-syn worms (Figures 3B and 3C). However, dopaminergic knockdown of these same targets systemically induced robust neuroprotection (Figure 3G). Of course, other genes among the hundreds of DEGs identified likely influence neuroprotection; the independent contribution of these three conserved genes alone amounts to a substantial impact on DA neuron survival. Indeed, evidence already exists for an aquaporin in humans, AQP4, as being implicated in PD.69 Both aqp-2 and zag-1 also provided neuroprotection when knocked down solely in the gut; therefore, neuroprotection resulting from systemic knockdown is at least partially due to the depletion of these transcripts in this tissue. In contrast, since knockdown of clec-78 did not modulate neurodegeneration in the gut-sensitive RNAi strain, the systemic knockdown of this target likely confers neuroprotection through another tissue type (Figure 3I). The spatial and temporal distinctions surrounding transcriptional repression of these, and other modulators of neuroprotection, necessitate further functional delineation.
In considering the extensive downregulation of >500 genes (∼1/40 of the C. elegans genome) stemming from transcriptomic profiling of dopaminergic neuroprotectionHB101, the paucity of upregulated DEGs modulated appeared comparatively minor to those in which expression was diminished (Figure 2D and Table 1). However, among this more limited set of genes, the beneficial effects derived from HB101 were revealing, particularly with respect to being dependent on HRG-7 function, as in the α-syn background, hrg-7 mutants abolished the protection previously observed (Figure 4A). Although neuroprotectionHB101 did not depend on the function of the worm mitochondrial creatine kinase ortholog, ARGK-1, the genome of C. elegans is predicted to encode at least seven arginine kinase-like proteins.70 Thus, loss of ARGK-1 kinase activity could be masked, or potentially compensated for, by one or more of these paralogs. Evidence of ARGK-1-dependent extension of C. elegans lifespan71 and the activity of mammalian creatine kinase in bolstering mitochondrial energetics suggest that the correlation between dopaminergic neuron survival and argk-1 upregulation likely has functional significance. While a specific role for creatine kinase/ARGK-1 in response to changes in bacterial diet (or microbiota in humans) remains to be discerned, the substantial increase of argk-1 transcripts ascertained is a contribution to neuroprotection that warrants further investigation.
At least partial corroboration of these transcriptional alterations in response to a diet of HB101 can be found in a prior study characterizing phenotypic and transcriptional changes in response to differential bacterial diets in C. elegans.24 This report used N2 animals at the L4 larval stage reared on either OP50 or HB101 for 30+ generations, as opposed to this study which used animals overexpressing α-syn in DA neurons at day 6 post-hatching reared on OP50 or HB101 for 4 generations. Despite these differences, this study performed by Stuhr and Curran found both argk-1 and hrg-7 to be significantly upregulated in worms grown on HB101 (log2foldchange = 4.83, adj. p value = 4.28E-10 and log2foldchange = 2.83, adj. p value = 4.26E-08, respectively). Likewise, Stuhr and Curran also found B0393.5, atf-2, and mlt-11 to be significantly downregulated in worms grown on HB101 (log2foldchange = 3.28, adj. p value = 4.26E-08; log2foldchange = 2.26, adj. p value = 0.02; log2foldchange = 4.59, adj. p value = 2.74E-24, respectively), as discerned in our study. These correlations reinforce the results of our transcriptomic findings and fortify the notion that the processes and factors we have identified as functional effectors of DA neuroprotection from α-syn-mediated neurotoxicity are valid modifying factors originating from a dietary distinction.
Importantly, HRG-7 has been shown to be secreted from the intestine in C. elegans and localized to distal tissues, including head neurons.44 HRG-7 secretion functions to regulate heme homeostasis, specifically during heme starvation.44 Therefore, it is interesting to speculate that HB101 causes an imbalance in heme levels, in turn promoting the upregulation of hrg-7 transcription. Similarly, the differential increase we observed in hrg-2 expression in animals fed HB101 correlates with published evidence that demonstrated that this additional, endoplasmic reticulum (ER)-associated, hypodermal heme-binding protein was robustly upregulated in response to heme deficiency.45 HRG-7 secretion from the intestine is regulated by DBL-1, a ligand involved in the transforming growth factor β (TGF-β) signaling pathway, and a signal that is dependent on DBL-1 function originating from neurons.44,72 In an innovative use of C. elegans as a screening platform to evaluate putative probiotic bacteria, DBL-1 was also identified as an essential regulatory factor required for Lactobacillus sp. to confer resistance to pathogenic methicillin-resistant Staphylococcus aureus (MRSA), the leading cause of hospital-acquired infections and mortality.73 Nevertheless, dbl-1 was not a DEG uncovered in this study, having approximately the same average number of transcripts in worms cultivated on either OP50 or HB101 (available at GEO Dataset Series: GSE210005). Of course, this does not preclude steady-state levels of DBL-1 as sufficient in effecting HRG-7 secretion.
HRG-7 is also predicted to have endopeptidase activity, consistent with other DEGs related to endopeptidase function being increased in response to a diet of HB101 E. coli (Table 1). It is therefore unlikely to be coincidental that mlt-11, Y43F8B.3, and F30H5.3, which all encode endopeptidase inhibitors, are downregulated in response to a diet of HB101 E. coli. It is also notable that nep-8 was among the few genes with conserved human orthologs upregulated (Table 1); human neprilysin (NEP) is an integral membrane protein and metalloendopeptidase with wide substrate specificity, including the degradation of the neurotoxic amyloid-beta (1–42) peptide associated with Alzheimer’s disease.74 In general, increased endopeptidase activity (or diminished inhibition), and therefore a concomitant increase in the hydrolysis of proteins, represent a multitude of potential effectors with respect to which specific proteins could be degraded and contribute to neuroprotection, including α-syn itself. Notably, we previously discovered that another conserved lysosomal endopeptidase, cathepsin D, protects against α-syn aggregation and neurotoxicity.41 This functional association has since been further confirmed through identification of human genetic variants in the CTSD gene of patients with PD.40
Since C. elegans is a heme auxotroph, it is fascinating to consider the conservation of heme or iron import, export, and trafficking proteins that are encoded in the worm genome and have been shown to function in vivo.75,76 We previously demonstrated a requirement for evolutionarily conserved genes encoding iron exporter homologs, fpn1.1 (ferroportin) and F25D5.3 (hephaestin), in conferring neuroprotection from α-syn-dependent dopaminergic neurodegeneration in C. elegans.77 Conversely, depletion of SMF-3, the worm homolog of the human iron importer, DMT1, enhanced dopamine neuron loss, but it was rescued by treatment with the iron chelator, desferoxamine. The prevalence and multifactorial effects of iron dyshomeostasis and ferroptosis in neurodegenerative conditions highlight the imperative for directed therapeutic development.78 Strides in the identification of small molecules that combat the consequences of brain hemorrhage led to the realization that the efficacy of iron chelators in treatment was a result of their activity on a class of oxygen-sensing prolyl hydroxylase enzymes that contain iron rather than a more general sequestration of cellular iron load.79 This therapeutic effect was independent of hypoxia-related pathway activation and was instead mediated through activating transcription factor 4 (ATF4), a transcriptional regulator of the integrated stress response (ISR).80 The ISR is initiated by phosphorylation of eIF2α, a pivotal translational regulator induced by overexpression of misfolded proteins, including α-syn, as well as in response to bacterial pathogens that trigger the innate immune response. The heme-regulatory inhibitor (HRI) is an eIF2α kinase that functions in response to heme deprivation, oxidative stress, and at a signaling axis for protein folding and solubility. With relevance for PD, the silencing of HRI expression resulted in endogenous α-syn accumulation in neuroblastoma cell cultures.81 Interestingly, another protein involved in phosphorylation of eIF2α is PKR, a kinase that was originally characterized for being uniquely activated by dsRNA binding.82 The convergence of heme signaling, proteostasis, neurodegeneration, and bacterially induced transcriptional response, in a manner that is also dependent on small RNA transport, opens a new window into the dynamics of epigenetic regulation of neuroprotection.
The collective outcomes of this research bring to light the importance that exogenous sources of epigenetic signals, including bacterial, have on neurodegeneration. Susceptibility to PD, like most diseases, involves the dysregulation or inherent deficiency of protective mechanisms that function to buffer cells and organisms from changes in environmental conditions and exposures. The dopaminergic system, in particular, functions within tightly regulated parameters that allow for exquisite response and adaptation to external influences. The same mechanisms underlying this biological responsiveness are likely pivotal in explaining the differential capacities of individuals to withstand pathogenic challenges.83 As the expanding deluge of human genomic data becomes more systematically parsed for functional significance, application of invertebrate models will be invaluable for corroboration of organismal responses to microbial effectors, by using worms or flies engineered to evaluate the consequences of conserved genomic variants.84 Likewise, the plethora of descriptive metagenomic datasets emerging in the characterization of human gut microbiome dysbiosis in PD calls for increasingly well-defined and carefully controlled strategies,85 in addition to a next level of functional scrutiny be applied to assign metabolic mediators of neuronal activity and survival. The fact that the diet of C. elegans can be experimentally delimited to defined bacterial sources allows for rigorous, carefully controlled analyses to be conducted as an in vivo proxy, or predicate, for the evaluation of constituent bacteria as well as their secondary products of metabolism. The impunity with which neurodegenerative diseases continue to devastate millions demands a sense of urgency in addressing this worldwide burden. The foundation provided here serves to inform the design of necessary follow-up studies in mammalian models of PD, for purposes of corroboration, application and, hopefully, inspiration—to hasten discovery.
Limitations of the study
The RNA isolation for transcriptional analysis was conducted in animals that were fed either HB101 or OP50 E. coli at the P0 and F3 generations, as outlined in the STAR Methods. This essentially represents a “snapshot” in the temporal sense, with respect to DEGs identified (Figure 2). Costs limited additional time points being analyzed, and, ideally, we would have also liked to profile transcription after the switch from one bacterial source to the other (Figures 1C and 1D) as these data might reveal contributors to the persistence of neuroprotection into a final generation. Additionally, the RNAi knockdown studies conducted to examine the contribution of individual DEGs were limited in scope to a subset of targets that were downregulated in response to a diet of HB101 E. coli that had human orthologs (twelve genes in total). While this bias is readily justified in terms of our end goals, it would be valuable to have knockdown data on all downregulated genes for purposes of comparison and to potentially reveal other mechanistic insights. The same could be said for the functional analyses performed on upregulated targets; however, the two upregulated DEGs evaluated (argk-1 and hrg-7) were far and away the most significant out of the eight upregulated DEGs with human orthologs. An obvious limitation to our strategy is our choice of bacterial strains. It is significant to note that numerous studies from other worm labs have evaluated pathogenic bacteria, putative probiotic strains, and a variety of other logical choices based on the known literature for the human microbiome. We would like to expand our efforts to include specific strains that have been shown to be elevated in PD patient stool samples and compare those to age-matched and/or twin-derived samples. Nevertheless, in considering the plentiful outcomes of even our limited, but simplified and rigorously controlled comparisons, we would anticipate that interpreting results from increasingly complex, albeit more representative microbiota, would be challenging.
STAR★Methods
Key resources table
| REAGENT or RESOURCE | SOURCE | IDENTIFIER |
|---|---|---|
| Bacterial and virus strains | ||
| OP50-1 E. coli | CGC | Cat# WBStrain00041971 |
| OP50 E. coli | CGC | Cat# WBStrain00041969 |
| HB101 E. coli | CGC | Cat# WBStrain00041075 |
| HT115 E. coli | CGC | Cat# WBStrain00041079 |
| Chemicals, peptides, and recombinant proteins | ||
| Trizol | ThermoFisher Scientific | Cat# 15596026 |
| chloroform | MP Biomedicals | Cat# 0219400280 |
| ampicillin | G-Biosciences | Cat# RC-020 |
| IPTG | ENZO Biochem | Cat# 582-001-G025 |
| Critical commercial assays | ||
| RNeasy Micro Kit | Qiagen | Cat# 74004 |
| iScript Reverse Transcription Supermix | Bio-Rad Laboratories | Cat# 1708840 |
| IQ SYBR Green Supermix | Bio-Rad Laboratories | Cat# 1708880 |
| Deposited data | ||
| RNA sequencing (whole-worm, mRNA) | Gene Expression Omnibus (GEO) https://www.ncbi.nlm.nih.gov/geo/ | Dataset Series: GSE210005 |
| Experimental models: Organisms/strains | ||
| C. elegans: UA44 (Figures 1,2,3): (baIn11[Pdat-1:: α-syn (human, wild-type), Pdat-1::GFP]) | Caldwell Lab | WB Cat# WBStrain00047167 |
| C. elegans: UA196 (Figures 3,5): (baIn11[Pdat-1::α-syn (human, wild-type), Pdat-1::GFP] ; baIn33 [Pdat-1::sid-1, Pmyo-2::mCherry]; sid-1(pk3321)) | Caldwell Lab | WB Cat# WBStrain00035179 |
| C. elegans: UA202 (Figure 3): (vtIs7 [Pdat-1::GFP]; baIn36 [Pdat-1::sid-1, Pmyo-2::mCherry]; sid-1(pk3321)) | Caldwell Lab | WB Cat# WBStrain00047168 |
| C. elegans: BY250 (Figure 1): (vtIs7 [Pdat-1::GFP]) | Dr. Randy Blakely | WB Cat# WBStrain00004027 |
| C. elegans: UA310 (Figure 3): (baIn11[Pdat-1:: α-syn (human, wild-type), Pdat-1::GFP]; rde-1(ne219); kbIs7 [Pnhx-2::rde-1, rol-6(su1006)] | Caldwell Lab | N/A |
| C. elegans: UA415 (Figure 5): (baIn11[Pdat-1::α-syn (human, wild-type), Pdat-1::GFP]; sid-1(pk3321)) | This study | N/A |
| C. elegans: UA416 (Figure 5): (baIn11[Pdat-1::α-syn (human, wild-type), Pdat-1::GFP]; sid-3(ok973)) | This study | N/A |
| C. elegans: UA439 (Figure 5): (baIn11[Pdat-1::α-syn (human wild-type), Pdat-1::GFP];dyf-2;ZK520.2(gk505)) | This study | N/A |
| C. elegans: UA440 (Figure 4): (baIn11[Pdat-1::α-syn (human, wild-type), Pdat-1::GFP]; argk-1(ok2973)) | This study | N/A |
| C. elegans: UA438 (Figure 4): (baIn11[Pdat-1::α-syn (human, wild-type), Pdat-1::GFP]; hrg-7(tm6801)) | This study | N/A |
| C. elegans: UA441 (Figure 5): (baIn11[Pdat-1::α-syn (human, wild-type), Pdat-1::GFP]; hrde-1(tm1200)) | This study | N/A |
| Oligonucleotides | ||
| RT-qPCR primer: α-synuclein, (human wild-type cDNA) Forward 5' - ATGTAGGCTCCAAAACCAAGG - 3' |
Fisher Scientific | N/A |
| RT-qPCR primer: α-synuclein, (human wild-type cDNA) Reverse 5' - ACTGCTCCTCCAACATTTGTC - 3' |
Fisher Scientific | N/A |
| RT-qPCR primer:snb-1 Forward 5' - CCGGATAAGACCATCTTGACG - 3' | Fisher Scientific | N/A |
| RT-qPCR primer: snb-1 Reverse 5' - GACGACTTCATCAACCTGAGC - 3' | Fisher Scientific | N/A |
| RT-qPCR primer: tba-1 Forward 5' - ATCTCTGCTGACAAGGCTTAC - 3' | Fisher Scientific | N/A |
| RT-qPCR primer: tba-1 Reverse 5' - GTACAAGAGGCAAACAGCCAT - 3' | Fisher Scientific | N/A |
| RT-qPCR primer: ama-1 Forward 5' - TCCTACGATGTATCGAGGCAA - 3' | Fisher Scientific | N/A |
| RT-qPCR primer: ama-1 Reverse 5' - CTCCCTCCGGTGTAATAATGA - 3' | Fisher Scientific | N/A |
| Recombinant DNA | ||
| pPdat-1::α-syn::unc-54 3'UTR | Caldwell Lab | N/A |
| pPdat-1::GFP::unc-54 3'UTR | Caldwell Lab | N/A |
| pCFJ90 | Frøkjaer-Jensen et al., 200886 | Addgene, Plasmid #19327 |
| pPdat-1::sid-1::unc-54 3'UTR | Caldwell Lab | N/A |
| pPdat-1::GFP | Dr. Randy Blakely | N/A |
| pPnhx-2::rde-1 | Dr. Kevin Strange | N/A |
| Software and algorithms | ||
| GraphPad Prism 9.0 | GraphPad Software Dotmatics, Inc. | https://www.graphpad.com/ |
| MetaMorph | Molecular Devices | https://www.moleculardevices.com/ |
| HISAT2 version 2.1.0-beta | Kim et al., 201987 | N/A |
| HTSeq version 0.6.1 | Anders et al., 201588 | N/A |
| DESeq2 version 1.10.1 | Anders and Huber, 201089 | N/A |
| WormCat | Holdorf et al., 202090 | http://www.wormcat.com/ |
| R | N/A | https://www.r-project.org/ |
| CFX Manager Software | Bio-Rad Laboratories | https://www.bio-rad.com/ |
| GeNorm | N/A | https://genorm.cmgg.be/ |
Resource availability
Lead contact
Further information and requests for resources and reagents should be directed to and will be fulfilled by the lead contact, Guy A. Caldwell (gcaldwel@ua.edu).
Materials availability
All C. elegans strains used in this study are available from the lead contact upon request.
Experimental model and subject participant details
C. elegans strains
Experimental nematodes were reared and maintained on either OP50-1, OP50, HB101, or HT115 E. coli at 20°C under standard laboratory conditions.12 The hrg-7(tm6801) mutant strain, which strain UA438 was derived from, was a gift from Dr. Iqbal Hamza, University of Maryland. Integrated transgenic strain BY250 (vtIs7 [Pdat-1::GFP]) was a gift from Randy Blakely (Florida Atlantic Univ.). UA202 (vtIs7 [Pdat-1::GFP]; baIn36 [Pdat-1::sid-1, Pmyo-2::mCherry]; sid-1(pk3321)) is derived from BY250. Three α-syn neurodegeneration models were used in this study: UA44 (baIn11[Pdat-1:: α-syn (human, wild-type), Pdat-1::GFP]), UA196 (baIn11[Pdat-1:: α-syn (human, wild-type), Pdat-1::GFP] ; baIn33 [Pdat-1::sid-1, Pmyo-2::mCherry]; sid-1(pk3321)), and UA310 (baIn11[Pdat-1:: α-syn (human, wild-type), Pdat-1::GFP]; rde-1(ne219); kbIs7 [Pnhx-2::rde-1, rol-6(su1006)]. Integrated transgenic lines crossed to UA44 include: UA415 (baIn11[Pdat-1::α-syn (human, wild-type), Pdat-1::GFP]; sid-1(pk3321)), UA416 (baIn11[Pdat-1::α-syn (human, wild-type), Pdat-1::GFP]; sid-3(ok973)), UA439 (baIn11[Pdat-1::α-syn (human, wild-type), Pdat-1::GFP]; dyf-2;ZK520.2(gk505)), UA440 (baIn11[Pdat-1::α-syn (human, wild-type), Pdat-1::GFP]; argk-1(ok2973)), UA441 (baIn11[Pdat-1::α-syn (human, wild-type), Pdat-1::GFP]; hrde-1(tm1200)), and UA438 (baIn11[Pdat-1::α-syn (human, wild-type), Pdat-1::GFP]; hrg-7(tm6801)).
Bacterial culture growth conditions
All experiments involving OP50 and HB101 E. coli were performed by using OP50 and HB101 grown for 10 and 5 hours respectively in LB liquid cultures shaking at 200 rpm at 37°C. For RNAi experiments, HT115 E. coli was grown for 16-18 hours in LB liquid cultures shaking at 200 rpm at 37°C. Please see the “method details” section that follows for more detailed information regarding experimental procedures.
Method details
Bacterial growth curve analysis
Standard aseptic microbiology techniques and practices were used to obtain growth curve data. To determine the growth rate of both OP50 and HB101 E. coli, both optical density at 600nm (OD600) and Colony Forming Unit (CFU)s/mL data were collected as the bacteria grew in liquid culture (LB) starting immediately following inoculation (t=0 hours) and every 2 hours after, for 16 hours (9 time points). LB plates were streaked using the quad streak technique with both OP50 and HB101 E. coli and allowed to grow at 37°C for 14.5 hours to generate spatially separated colonies. After this incubation period, single colonies of either OP50 or HB101 E. coli were used to inoculate 6mL of LB in 10mL culture tubes. This was done in triplicate for both OP50 and HB101 E. coli. During the 16 hours of growth, the culture tubes were shaken at 200 rpm at 37°C. The OD600 at each time point was determined using a spectrophotometer (Thermo Scientific Genesys 10vis), and this was accomplished by vortexing each liquid culture tube thoroughly, and then dispensing 0.1mL into a 1.5 mL semi-micro disposable cuvette. 0.9mL of LB was then dispensed into the cuvette to bring the total volume to 1mL. This 1:10 dilution was used to obtain the OD600 using the spectrophotometer. To calculate the actual OD600 of the undiluted liquid cultures, the values were multiplied by 10, for each of the 3 replicates. The CFUs/mL were determined immediately following the acquisition of OD600 data by dispensing 0.1mL of each liquid culture from each replicate into the very left most column of a 96 well plate. Then 0.09mL of LB was dispensed into the 5 columns to the right of the left-most column containing the fully concentrated (100) liquid cultures. 10-fold serial dilutions were then performed using a multi-channel pipette, which involved mixing the 100 liquid cultures by pipetting up and down 30 times, then aspirating 0.01mL and dispensing this into the 0.09mL of LB in the columns directly to the right. This same process was performed for the next 4 columns containing LB but starting with the more dilute liquid culture, producing 10-fold serial dilutions ranging from 100-10-5. 5μL of each of these dilutions, for each replicate, of both OP50 and HB101 E. coli, was dispensed onto separate LB plates. The plates were stored at 4°C to limit bacterial growth until the 9th and final time point plate was generated, at which time the plates were incubated at 37°C for 14 hours. The number of CFUs produced from each replicate was divided by 5 (corresponding to the volume of liquid culture dispensed onto the LB plates; 5 μL) and then multiplied by the dilution factor to obtain the CFUs/mL for each replicate, for each timepoint, for both OP50 and HB101 E. coli. Only dilutions producing between 30-300 colonies were used.
Differential diet experiments
These methods pertain to the transgenerational experiments. The following set of procedures were performed to make all plates destined for egg lays and maintenance. All plates were made fresh, the day before intended use. To first generate spatially separated bacterial colonies, LB plates were streaked using the quad streak technique with both OP50 and HB101 E. coli and allowed to grow at 37°C for 14.5 hours. After this incubation period, single colonies of either OP50 or HB101 E. coli were used to inoculate 6mL of LB in 10mL culture tubes. The OP50 E. coli liquid cultures were grown at 37°C and shook at 200 rpm for 5 hours, and the HB101 E. coli liquid cultures were grown in the same manner for 10 hours. This is in accordance with the results of the growth curve analysis, which indicated that both the OD600 and CFUs/mL were equivalent for both bacterial types at these time points. 200μL of each liquid culture was dispended onto NGM plates and allowed to dry in a biological safety cabinet. Once dry, the plates were incubated at 37°C for 14 hours. The plates were allowed to cool to room temperature before they were used for either egg lays or transfers.
To ensure that well-fed worms were used for all experiments, egg lays were performed on OP50-1 E. coli plates (same bacterial type as maintenance stock plates) to obtain large amounts of well-fed gravid adults. Before worms were transferred to either OP50 or HB101 experimental plates to initiate experimental egg lays, gravid adults from OP50-1 egg lay plates were washed 3 times with water in glass conical tubes via centrifugation. This same water-washing procedure was also preformed to obtain populations for generations in which the bacterial food source was switched from HB101 to OP50 E. coli (after the F3 generation, Fig. 1C). For all egg lays and transfers to maintain or initiate generations, only plates with smooth, uncontaminated bacterial lawns were used. Great care was taken to ensure that the type of bacteria (OP50 vs. HB101) was the only independent variable in these experiments.
RNAi experiments: Plates and bacterial growth conditions
RNAi plates were made by adding ampicillin and Isopropyl β-D-1 thiogalactopyranoside (IPTG) at a final concentration of 100 μg/mL and 1 mM respectively to Nematode Growth Media (NGM). RNAi bacteria (HT115 E. coli) containing either the empty L4440 feeding vector or this same vector containing sequences anti- to target genes desired to be knocked down were grown in LB media with the addition of ampicillin at a final concentration of 100 μg/mL at 37°C while shaking for 16-18 hours. RNAi bacteria were seeded onto RNAi plates and allowed to fully dry in a biological safety cabinet. Plates were then incubated at 20°C overnight to allow for dsRNA induction prior to initiating egg lays.
Dopaminergic neurodegeneration analysis
Worms were age synchronized by performing 3-5-hour egg lays. All worms were kept at 20°C for the duration of each experiment. The extent of neurodegeneration was determined for each replicate by placing worms in a 6 μL drop of 10 mM levamisole (dissolved in 0.5x S Basal buffer) on a glass coverslip. This drop of levamisole on the coverslip was inverted and placed on a 2% agarose pad made on a microscope slide, immobilizing worms to aid in visualization. Using a Nikon Eclipse E600 epifluorescence microscope with the addition of a Nikon Intensilight C-HGFI fluorescent light source, the 6 DA neurons in the anterior head region of worms (4 CEPs and 2 ADEs) were scored for the extent of neurodegeneration by using GFP fluorescence as a proxy, and each worm was scored as either normal or degenerative. Normal DA neurons retain complete GFP fluorescence in all 4 CEP and 2 ADE neurons, while neurons that have a loss of or incomplete GFP expression are categorized as degenerative.91,92 Worms were considered normal only if all 6 DA neurons in the head region had completely intact cell bodies and dendritic processes. Worms were considered degenerative if at least 1 out of the 6 DA neurons was absent, had broken dendritic processes, or exhibited cell body abnormalities. All experiments consisted of 3 biological replicates, and each biological replicate consisted of 30 worms. Statistical significance between groups was determined with GraphPad Prism Software.
Neuron image acquisition
Images of DA neurons were obtained by placing worms in a 6 μL drop of 10 mM levamisole (dissolved in 0.5x S basal Buffer) on a glass coverslip. This drop of levamisole on the coverslip was inverted and placed on a 2% agarose pad made on a microscope slide, immobilizing worms to aid in visualization. Fluorescence microscopy was performed with a Nikon Eclipse E800 epifluorescence microscope equipped with an Endow GFP HYQ filter cube. Images were captured using a Cool Snap CCD camera (Photometrics) with Metamorph software (Molecular Devices).
Transcriptomic analysis
RNA was isolated from the strain UA44 and cultivated on either OP50 or HB101 E. coli at day 6 post-hatching, at both the P0 and F3 generations. 3 separate replicates were isolated for each group. Large quantities of worms were obtained by performing 2-hour egg lays with 20-30 gravid adults on 100 mm NGM plates seeded with either OP50 or HB101 E. coli. All worms destined for RNA isolation were grown at 20°C. Starting at day 4 post-hatching, worms were transferred to 100 mm fresh seeded plates to prevent starvation and mixing of target worms and progeny. At day 6 post-hatching, for each group, for each replicate, worms were transferred to an unseeded NGM plate. Great care was taken to only transfer target worms and to avoid carryover of embryos. Worms were washed off unseeded plates with 0.5x M9 into sterilized glass conical tubes. Worms were washed 4 times with 0.5x M9 to reduce bacteria in samples. After the 4th wash, worms were purged for 20 minutes to reduce the number of bacteria in the gut of the worms, and this was done by rocking the tubes back and forth on a nutator. Worms were then washed 2 times with double-distilled deionized water to rid of any remaining bacteria. Worms were then transferred to 1.5 mL RNAse-free low protein-binding microcentrifuge tubes and as much supernatant was removed as possible. 500 μL of Trizol (ThermoFisher Scientific) was then added to each tube, and then immediately vortexed for 30 seconds and placed in liquid nitrogen until frozen completely. Tubes were then thawed at 37°C. This freeze/thaw process was then performed the same way 6 more times. After the last thaw, all tubes were vortexed for 30 seconds and then put on ice for 30 seconds. This vortex/ice process was then performed the same way 7 more times. All tubes were then allowed to incubate at room temperature for 5 minutes. Then 100 μL of chloroform (MP Biomedicals) was added to each tube, and each tube was immediately inverted continuously for 15 seconds. The tubes were then allowed to incubate at room temperature for 5 minutes to allow for phase separation. The tubes were then centrifuged for 15 minutes at 4°C at 12,000 rpm. The top aqueous phase from each tube was then transferred to new 1.5 mL RNAse-free microcentrifuge tubes, and an equal volume of RNAse-free 70% ethanol was added to each tube and mixed by gentle inversion. At this point, the aqueous phase mixed with ethanol was subjected to the protocol outlined in the Qiagen RNeasy Micro Kit, and reagents and materials from this kit were used for the remainder of the isolation. Ultimately, RNA was eluted with 35 μL of RNAse-free water.
RNA samples were sent to the Novogene Corporation, Inc. (Sacramento, CA) for eukaryotic mRNA-sequencing. Novogene also performed bioinformatic analysis to determine DEGs, along with transcript levels, log2fold changes, and adjusted and non-adjusted p-values. An Illumina Novaseq platform was used for a paired-end 150 basepair sequencing strategy (short reads) to sequence cDNA libraries corresponding to RNA samples. Transcript expression levels were determined using the RPKM (Reads Per Kilobases per Million reads) method.93 Data were filtered by removing adaptors and low-quality reads. Bioinformatic analysis was done using HISAT2, version 2.1.0-beta87, with a parameter of “mismatch=2” to map samples to the N2 reference genome (ftp://ftp.ebi.ac.uk/pub/databases/wormbase/parasite/releases/WBPS13/species/caenorhabditis_elegans/PRJNA13758/caenorhabditis_elegans.PRJNA13758.WBPS13.genomic.fa.gz). The resultant BAM files from HISAT2 were input for quantification of reads with HTSeq, version 0.6.1, with parameter “-m union”.88 Differentially Expressed Genes (DEGs) were extracted using DESeq2 version 1.10.1 in R.89 Significance was determined if the p-adjusted value was less than 0.05. DESeq2 utilized a Benjamini-Hochberg method of normalization to calculate the adjusted p-value, a powerful method for controlling the false discovery rate. Heatmaps were created in R using package “pheatmap” (Kolde, 2015). Gene ontology (GO) analyses were created using WormCat bioinformatics resource90 Genes that were significantly up- or down-regulated as determined by an adjusted p-value of less 0.05 were used in the analysis. All RNA-seq data can be accessed through the Gene Expression Omnibus (GEO) Dataset Series: GSE210005.
Real-time quantitative PCR
Total RNA was isolated from 100 young adult (α-syn + OP50, α-syn + HB101: day 4 post-hatching) animals from each group using TRI reagent (Molecular Research Center). Genomic DNA contamination was removed from samples with 1 μl of DNaseI (Promega) treatment for 60 minutes at 37°C, then with DNase Stop solution for 10 minutes at 65°C. cDNA was synthesized with 1μg of RNA using the iScript Reverse Transcription Supermix for RT-qPCR (Bio-Rad) following the manufacturer’s protocol. RT-qPCR was performed using IQ-SYBR Green Supermix (Bio-Rad) with the Bio-Rad CFX96 Real-Time System. These reagents and procedure are like previously described.94,95 Reactions consisted of 7.5 μl of IQ SYBR Green Supermix, 200 nM of forward and reverse primers, and 5 ng of cDNA, to a final volume of 15 μl. The thermocycling conditions were as follows: polymerase activation and DNA denaturation for 3 minutes at 95°C, then 35 cycles of 10 seconds at 95°C, 30 seconds at 60°C., A melting curve analysis was performed after the final cycle using the default setting of CFX96 Real-Time System. For each targeted gene, single melt peaks were observed. The PCR efficiency for each primer pair was calculated from standard curves generated using serial dilutions: Eα-syn = 99.0%, Esnb-1 = 99.8%, Etba-1 = 99.5%, Eama-1 = 103.1%. The expression levels of α-syn were normalized to three reference genes: snb-1, tba-1, and ama-1. The NTC and NRT controls exhibited no amplification. All reference genes used were analyzed by GeNorm and passed for target stability. Each group tested consisted of 3 independent biological replicates, each consisting of 3 technical replicates, for each target gene tested. Data analysis was executed by the Gene Expression Module of CFX Manager software. The following primers (shown 5' to 3') were used:
α-syn Forward: ATGTAGGCTCCAAAACCAAGG
α-syn Reverse: ACTGCTCCTCCAACATTTGTC
snb-1 Forward: CCGGATAAGACCATCTTGACG
snb-1 Reverse: GACGACTTCATCAACCTGAGC
tba-1 Forward: ATCTCTGCTGACAAGGCTTAC
tba-1 Reverse: GTACAAGAGGCAAACAGCCAT
ama-1 Forward: TCCTACGATGTATCGAGGCAA
ama-1 Reverse: CTCCCTCCGGTGTAATAATGA
Quantification and statistical analysis
All statistical analysis was performed with GraphPad Prism Software (Version 9.0.0). Specific statistical details for each individual experiment can be found in the figure legends associated with each figure. When analyses were performed with data containing multiple days, comparing every group to every other group, a Two-Way ANOVA was used with Tukey’s post hoc analysis. When analyses were performed with data containing multiple days or generations, comparing only groups within the same day to each other, a Two-Way ANOVA was used with Šídák’s post hoc analysis. When analyses were performed with data containing a single day or generation, and there were only two groups, an unpaired, two-tailed t-test was used. When analyses were performed with data containing a single day or generation, with more than two groups and only comparing back to a control, a One-Way ANOVA was used with Dunnett’s post hoc analysis. For all statistical analyses, significance was defined as follows: ns P ≥ 0.05, ∗ P < 0.05, ∗∗ P < 0.01, ∗∗∗ P <0.001, ∗∗∗∗ P < 0.0001.
Acknowledgments
We thank the members of the Caldwell Lab for their collegiality and teamwork. Much of this research was conducted during the COVID-19 pandemic. Our ability to persevere through these circumstances would not have been possible without the extraordinary efforts of our lab manager, Dr. Laura Berkowitz. We are grateful to Dr. Xiaohui Yan for her assistance with RT-qPCR experiments, Dr. Janna Fierst for bioinformatics advice, and Drs. Iqbal Hamza, Kevin Strange, and Randy Blakley for sharing plasmids and strains, and Wormbase. Some strains were provided by the CGC, which is funded by NIH Office of Research Infrastructure Programs (P40OD010440). This research was funded by a grant from the National Institute of Neurological Disorders and Stroke (R15NS104857 to G.A.C). L.E.M. was supported by a Summer Research Fellowship from the Parkinson's Foundation. Additional support came from the UA College of Arts & Sciences Undergraduate Research and Creative Activity Grants (L.E.M., C.M.K.), Hill Crest Foundation, and Parkinson’s Disease Support Group of Huntsville, Alabama.
Author contributions
Conceptualization: A.L.G., K.A.C., and G.A.C.; Methodology: A.L.G., K.W., K.A.C., and G.A.C.; Investigation: A.L.G., K.W., C.WW., L.E.M, C.M.K., T.J.A., L.C.K., and A.L.Y.; Writing – Original Draft, A.L.G.; Writing – Review & Editing: A.L.G., K.A.C., and G.A.C.; Funding Acquisition: G.A.C.; Resources: A.L.G., K.A.C., and G.A.C.; Visualization: A.L.G. and K.A.C.; Supervision: A.L.G., K.A.C., and G.A.C.; Project Administration: G.A.C.
Declaration of interests
The authors declare no competing interests.
Inclusion and diversity
We support inclusive, diverse, and equitable conduct of research.
Published: May 12, 2023
Data and code availability
-
•
RNA-seq data have been deposited in the Gene Expression Omnibus (GEO) and are publicly available as of the date of publication. Accession numbers are listed in the key resources table.
-
•
This paper does not report original code.
-
•
Any additional information required to reanalyze the data reported in this paper is available from the lead contact upon request.
References
- 1.Bourre J.M. Effects of nutrients (in food) on the structure and function of the nervous system: update on dietary requirements for brain. part 1: micronutrients. J. Nutr. Health Aging. 2006;10:377–385. [PubMed] [Google Scholar]
- 2.Bourre J.M. Effects of nutrients (in food) on the structure and function of the nervous system: update on dietary requirements for brain. part 2: macronutrients. J. Nutr. Health Aging. 2006;10:386–399. [PubMed] [Google Scholar]
- 3.McCann S.E., Moysich K.B., Mettlin C. Intakes of selected nutrients and food groups and risk of ovarian cancer. Nutr. Cancer. 2001;39:19–28. doi: 10.1207/S15327914nc391_3. [DOI] [PubMed] [Google Scholar]
- 4.Molteni R., Barnard R.J., Ying Z., Roberts C.K., Gómez-Pinilla F. A high-fat, refined sugar diet reduces hippocampal brain-derived neurotrophic factor, neuronal plasticity, and learning. Neuroscience. 2002;112:803–814. doi: 10.1016/s0306-4522(02)00123-9. [DOI] [PubMed] [Google Scholar]
- 5.Carla de Oliveira B.R., Dos Santos C.A., Leite J.I.A., Caldas A.P.S., Bressan J. Impact of nutrients and food components on dyslipidemias: what is the evidence? ASN. 2015;6:703–711. doi: 10.3945/an.115.009480. [DOI] [PMC free article] [PubMed] [Google Scholar]
- 6.Turnbaugh P.J., Ridaura V.K., Faith J.J., Rey F.E., Knight R., Gordon J.I. The effect of diet on the human gut microbiome: a metagenomic analysis in humanized gnotobiotic mice. Sci. Transl. Med. 2009;1:6ra14. doi: 10.1126/scitranslmed.3000322. [DOI] [PMC free article] [PubMed] [Google Scholar]
- 7.Bixby M., Gennings C., Malecki K.M.C., Sethi A.K., Safdar N., Peppard P.E., Eggers S. Individual nutrition is associated with altered gut microbiome composition for adults with food insecurity. Nutrients. 2022;14:3407. doi: 10.3390/nu14163407. [DOI] [PMC free article] [PubMed] [Google Scholar]
- 8.Zheng W., Zhao S., Yin Y., Zhang H., Needham D.M., Evans E.D., Dai C.L., Lu P.J., Alm E.J., Weitz D.A. High-throughput, single-microbe genomics with strain resolution, applied to a human gut microbiome. Science. 2022;376:eabm1483. doi: 10.1126/science.abm1483. [DOI] [PubMed] [Google Scholar]
- 9.Brooks K.K., Liang B., Watts J.L. The influence of bacterial diet on fat storage in C. elegans. PLoS One. 2009;4:e7545. doi: 10.1371/journal.pone.0007545. [DOI] [PMC free article] [PubMed] [Google Scholar]
- 10.MacNeil L.T., Walhout A.J. Food, pathogen, signal. Worm. 2013;2:e26454. doi: 10.4161/worm.26454. [DOI] [PMC free article] [PubMed] [Google Scholar]
- 11.MacNeil L.T., Watson E., Arda H.E., Zhu L.J., Walhout A.J.M. Diet-induced developmental acceleration independent of TOR and insulin in C. elegans. Cell. 2013;153:240–252. doi: 10.1016/j.cell.2013.02.049. [DOI] [PMC free article] [PubMed] [Google Scholar]
- 12.Brenner S. The genetics of Caenorhabditis elegans. Genetics. 1974;77:71–94. doi: 10.1093/genetics/77.1.71. [DOI] [PMC free article] [PubMed] [Google Scholar]
- 13.Zhang S., Kuhn J.R. In: WormBook. Hobert O., editor. The C.elegans Research Community; 2013. Cell isolation and culture. [DOI] [Google Scholar]
- 14.Timmons L., Court D.L., Fire A. Ingestion of bacterially expressed dsRNAs can produce specific and potent genetic interference in Caenorhabditis elegans. Gene. 2001;263:103–112. doi: 10.1016/s0378-1119(00)00579-5. [DOI] [PubMed] [Google Scholar]
- 15.Urrutia A., García-Angulo V.A., Fuentes A., Caneo M., Legüe M., Urquiza S., Delgado S.E., Ugalde J., Burdisso P., Calixto A. Bacterially produced metabolites protect C. elegansneurons from degeneration. PLoS Biol. 2020;18:e3000638. doi: 10.1371/journal.pbio.3000638. [DOI] [PMC free article] [PubMed] [Google Scholar]
- 16.Goya M.E., Xue F., Sampedro-Torres-Quevedo C., Arnaouteli S., Riquelme-Dominguez L., Romanowski A., Brydon J., Ball K.L., Stanley-Wall N.R., Doitsidou M. Probiotic Bacillus subtilis protects against α-synuclein aggregation in C. elegans. Cell Rep. 2020;30:367–380.e7. doi: 10.1016/j.celrep.2019.12.078. [DOI] [PMC free article] [PubMed] [Google Scholar]
- 17.Griffin E.F., Yan X., Caldwell K.A., Caldwell G.A. Distinct functional roles of Vps41-mediated neuroprotection in Alzheimer’s and Parkinson’s disease models of neurodegeneration. Hum. Mol. Genet. 2018;27:4176–4193. doi: 10.1093/hmg/ddy308. [DOI] [PMC free article] [PubMed] [Google Scholar]
- 18.Gaeta A.L., Caldwell K.A., Caldwell G.A. Found in translation: the utility of C. elegans alpha-synuclein models of Parkinson’s disease. Brain Sci. 2019;9:73. doi: 10.3390/brainsci9040073. [DOI] [PMC free article] [PubMed] [Google Scholar]
- 19.Caldwell K.A., Willicott C.W., Caldwell G.A. Modeling neurodegeneration in Caenorhabditis elegans. Dis. Model. Mech. 2020;13:dmm046110. doi: 10.1242/dmm.046110. [DOI] [PMC free article] [PubMed] [Google Scholar]
- 20.Cao S., Gelwix C.C., Caldwell K.A., Caldwell G.A. Torsin-mediated protection from cellular stress in the dopaminergic neurons of Caenorhabditis elegans. J. Neurosci. 2005;25:3801–3812. doi: 10.1523/JNEUROSCI.5157-04.2005. [DOI] [PMC free article] [PubMed] [Google Scholar]
- 21.Hamamichi S., Rivas R.N., Knight A.L., Cao S., Caldwell K.A., Caldwell G.A. Hypothesis-based RNAi screening identifies neuroprotective genes in a Parkinson’s disease model. Proc. Natl. Acad. Sci. USA. 2008;105:728–733. doi: 10.1073/pnas.0711018105. [DOI] [PMC free article] [PubMed] [Google Scholar]
- 22.Singleton A.B., Farrer M., Johnson J., Singleton A., Hague S., Kachergus J., Hulihan M., Peuralinna T., Dutra A., Nussbaum R., et al. α-Synuclein locus triplication causes Parkinson’s disease. Science. 2003;302:841. doi: 10.1126/science.1090278. [DOI] [PubMed] [Google Scholar]
- 23.Shtonda B.B., Avery L. Dietary choice behavior in Caenorhabditis elegans. J. Exp. Biol. 2006;209:89–102. doi: 10.1242/jeb.01955. [DOI] [PMC free article] [PubMed] [Google Scholar]
- 24.Stuhr N.L., Curran S.P. Bacterial diets differentially alter lifespan and healthspan trajectories in C. elegans. Commun. Biol. 2020;3:653. doi: 10.1038/s42003-020-01379-1. [DOI] [PMC free article] [PubMed] [Google Scholar]
- 25.Ghaisas S., Maher J., Kanthasamy A. Gut microbiome in health and disease: linking the microbiome-gut-brain axis and environmental factors in the pathogenesis of systemic and neurodegenerative diseases. Pharmacol. Ther. 2016;158:52–62. doi: 10.1016/j.pharmthera.2015.11.012. [DOI] [PMC free article] [PubMed] [Google Scholar]
- 26.Cooper A.A., Gitler A.D., Cashikar A., Haynes C.M., Hill K.J., Bhullar B., Liu K., Xu K., Strathearn K.E., Liu F., et al. α-Synuclein blocks ER-Golgi traffic and Rab1 rescues neuron loss in Parkinson’s models. Science. 2006;313:324–328. doi: 10.1126/science.1129462. [DOI] [PMC free article] [PubMed] [Google Scholar]
- 27.Harrington A.J., Hamamichi S., Caldwell G.A., Caldwell K.A. C. elegans as a model organism to investigate molecular pathways involved with Parkinson’s disease. Dev. Dynam. 2010;239:1282–1295. doi: 10.1002/dvdy.22231. [DOI] [PubMed] [Google Scholar]
- 28.Taylor S.R., Santpere G., Weinreb A., Barrett A., Reilly M.B., Xu C., Varol E., Oikonomou P., Glenwinkel L., McWhirter R., et al. Molecular topography of an entire nervous system. Cell. 2021;184:4329–4347.e23. doi: 10.1016/j.cell.2021.06.023. [DOI] [PMC free article] [PubMed] [Google Scholar]
- 29.Kamath R.S., Fraser A.G., Dong Y., Poulin G., Durbin R., Gotta M., Kanapin A., Le Bot N., Moreno S., Sohrmann M., et al. Systematic functional analysis of the Caenorhabditis elegans genome using RNAi. Nature. 2003;421:231–237. doi: 10.1038/nature01278. [DOI] [PubMed] [Google Scholar]
- 30.Harrington A.J., Yacoubian T.A., Slone S.R., Caldwell K.A., Caldwell G.A. Functional analysis of VPS41-mediated neuroprotection in Caenorhabditis elegans and mammalian models of Parkinson’s disease. J. Neurosci. 2012;32:2142–2153. doi: 10.1523/JNEUROSCI.2606-11.2012. [DOI] [PMC free article] [PubMed] [Google Scholar]
- 31.Calixto A., Chelur D., Topalidou I., Chen X., Chalfie M. Enhanced neuronal RNAi in C. elegans using SID-1. Nat. Methods. 2010;7:554–559. doi: 10.1038/nmeth.1463. [DOI] [PMC free article] [PubMed] [Google Scholar]
- 32.Wu J., Duggan A., Chalfie M. Inhibition of touch cell fate by egl-44 an egl-46 in C. elegans. Genes Dev. 2001;15:789–802. doi: 10.1101/gad857401. [DOI] [PMC free article] [PubMed] [Google Scholar]
- 33.Asikainen S., Vartiainen S., Lakso M., Nass R., Wong G. Selective sensitivity of Caenorhabditis elegans neurons to RNA interference. Neuroreport. 2005;16:1995–1999. doi: 10.1097/00001756-200512190-00005. [DOI] [PubMed] [Google Scholar]
- 34.Foster J.A., McVey Neufeld K.A. Gut-brain axis: how the microbiome influences anxiety and depression. Trends Neurosci. 2013;36:305–312. doi: 10.1016/j.tins.2013.01.005. [DOI] [PubMed] [Google Scholar]
- 35.Hirschberg S., Gisevius B., Duscha A., Haghikia A. Implications of diet and the gut microbiome in neuroinflammatory and neurodegenerative diseases. Int. J. Mol. Sci. 2019;20:3109. doi: 10.3390/ijms20123109. [DOI] [PMC free article] [PubMed] [Google Scholar]
- 36.Lin-Moore A.T., Oyeyemi M.J., Hammarlund M. rab-27 acts in an intestinal pathway to inhibit axon regeneration in C. elegans. PLoS Genet. 2021;17:e1009877. doi: 10.1371/journal.pgen.1009877. [DOI] [PMC free article] [PubMed] [Google Scholar]
- 37.Peng H., Yu S., Zhang Y., Yin Y., Zhou J. Intestinal dopamine receptor D2 is required for neuroprotection against 1-methyl-4phenyl-1,2,3,6-tetrahydropyridine-induced dopaminergic neurodegeneration. Neurosci. Bull. 2022;38:871–886. doi: 10.1007/s12264-022-00848-3. [DOI] [PMC free article] [PubMed] [Google Scholar]
- 38.Sampson T.R., Mazmanian S.K. Control of brain development, function, and behavior by the microbiome. Cell Host Microbe. 2015;17:565–576. doi: 10.1016/j.chom.2015.04.011. [DOI] [PMC free article] [PubMed] [Google Scholar]
- 39.Espelt M.V., Estevez A.Y., Yin X., Strange K. Oscillatory Ca2+ signaling in the isolated Caenorhabditis elegans intestine: role of the inositol-1,4,5-triphosphate receptor and phospholipases Cβ and γ. J. Gen. Physiol. 2005;126:379–392. doi: 10.1085/jgp.200509355. [DOI] [PMC free article] [PubMed] [Google Scholar]
- 40.Bunk J., Prieto Huarcaya S., Drobny A., Dobert J.P., Walther L., Rose-John S., Arnold P., Zunke F. Cathepsin D variants associated with neurodegenerative diseases show dysregulated functionality and modified α-synuclein degradation properties. Front. Cell Dev. Biol. 2021;9:581805. doi: 10.3389/fcell.2021.581805. [DOI] [PMC free article] [PubMed] [Google Scholar]
- 41.Qiao L., Hamamichi S., Caldwell K.A., Caldwell G.A., Yacoubian T.A., Wilson S., Xie Z.L., Speake L.D., Parks R., Crabtree D., et al. Lysosomal enzyme cathepsin D protects against alpha-synuclein aggregation and toxicity. Mol. Brain. 2008;1:17. doi: 10.1186/1756-6606-1-17. [DOI] [PMC free article] [PubMed] [Google Scholar]
- 42.Zhang Z., Xie M., Ye K. Asparagine endopeptidase is an innovative therapeutic target for neurodegenerative diseases. Expert Opin. Ther. Targets. 2016;20:1237–1245. doi: 10.1080/14728222.2016.1182990. [DOI] [PMC free article] [PubMed] [Google Scholar]
- 43.Xu J., Fu X., Pan M., Zhou X., Chen Z., Wang D., Zhang X., Chen Q., Li Y., Huang X., et al. Mitochondrial creatine kinase is decreased in the serum of idiopathic Parkinson’s disease patients. Aging Dis. 2019;10:601–610. doi: 10.14336/AD.2018.0615. [DOI] [PMC free article] [PubMed] [Google Scholar]
- 44.Sinclair J., Pinter K., Samuel T., Beardsley S., Yuan X., Zhang J., Meng K., Yun S., Krause M., Hamza I. Inter-organ signaling by HRG-7 promotes systemic haem homeostasis. Nat. Cell Biol. 2017;19:799–807. doi: 10.1038/ncb3539. [DOI] [PMC free article] [PubMed] [Google Scholar]
- 45.Chen C., Samuel T.K., Krause M., Dailey H.A., Hamza I. Heme utilization in the Caenorhabditis elegans hypodermal cells is facilitated by heme-responsive gene-2. J. Biol. Chem. 2012;287:9601–9612. doi: 10.1074/jbc.M111.307694. [DOI] [PMC free article] [PubMed] [Google Scholar]
- 46.Feinberg E.H., Hunter C.P. Transport of dsRNA into cells by the transmembrane protein SID-1. Science. 2003;301:1545–1547. doi: 10.1126/science.1087117. [DOI] [PubMed] [Google Scholar]
- 47.Winston W.M., Molodowitch C., Hunter C.P. Systemic RNAi in C. elegans requires the putative transmembrane protein SID-1. Science. 2002;295:2456–2459. doi: 10.1126/science.1068836. [DOI] [PubMed] [Google Scholar]
- 48.May R.C., Plasterk R.H.A. RNA interference spreading in C. elegans. Methods Enzymol. 2005;392:308–315. doi: 10.1016/S0076-6879(04)92018-6. [DOI] [PubMed] [Google Scholar]
- 49.Jose A.M., Kim Y.A., Leal-Ekman S., Hunter C.P. Conserved tyrosine kinase promotes the import of silencing RNA into Caenorhabditis elegans cells. Proc. Natl. Acad. Sci. USA. 2012;109:14520–14525. doi: 10.1073/pnas.1201153109. [DOI] [PMC free article] [PubMed] [Google Scholar]
- 50.Lažetić V., Joseph B.B., Bernazzani S.M., Fay D.S. Actin organization and endocytic trafficking are controlled by a network linking NIMA-related kinases to the CDC-42-SID-3/ACK1 pathway. PLoS Genet. 2018;14:e1007313. doi: 10.1371/journal.pgen.1007313. [DOI] [PMC free article] [PubMed] [Google Scholar]
- 51.McEwan D.L., Weisman A.S., Hunter C.P. Uptake of extracellular double-stranded RNA by SID-2. Mol. Cell. 2012;47:746–754. doi: 10.1016/j.molcel.2012.07.014. [DOI] [PMC free article] [PubMed] [Google Scholar]
- 52.Winston W.M., Sutherlin M., Wright A.J., Feinberg E.H., Hunter C.P. Caenorhabditis elegans SID-2 is required for environmental RNA interference. Proc. Natl. Acad. Sci. USA. 2007;104:10565–10570. doi: 10.1073/pnas.0611282104. [DOI] [PMC free article] [PubMed] [Google Scholar]
- 53.Liu H., Wang X., Wang H.-D., Wu J., Ren J., Meng L., Wu Q., Dong H., Wu J., Kao T.-Y., et al. Escherichia coli noncoding RNAs can affect gene expression and physiology of Caenorhabditis elegans. Nat. Commun. 2012;3:1073. doi: 10.1038/ncomms2071. [DOI] [PMC free article] [PubMed] [Google Scholar]
- 54.Zhang Y., Zhang X., Shi J., Tuorto F., Li X., Liu Y., Liebers R., Zhang L., Qu Y., Qian J., et al. Dnmt2 mediates intergenerational transmission of paternally acquired metabolic disorders through sperm small non-coding RNAs. Nat. Cell Biol. 2018;20:535–540. doi: 10.1038/s41556-018-0087-2. [DOI] [PMC free article] [PubMed] [Google Scholar]
- 55.Kaletsky R., Moore R.S., Vrla G.D., Parsons L.R., Gitai Z., Murphy C.T. C. elegansinterprets bacterial non-coding RNAs to learn pathogenic avoidance. Nature. 2020;586:445–451. doi: 10.1038/s41586-020-2699-5. [DOI] [PMC free article] [PubMed] [Google Scholar]
- 56.Legüe M., Caneo M., Aguila B., Pollak B., Calixto A. Interspecies effectors of a transgenerational memory of bacterial infection in. iScience. 2022;25:104627. doi: 10.1016/j.isci.2022.104627. [DOI] [PMC free article] [PubMed] [Google Scholar]
- 57.Buckley B.A., Burkhart K.B., Gu S.G., Spracklin G., Kershner A., Fritz H., Kimble J., Fire A., Kennedy S. A nuclear Argonaute promotes multigenerational epigenetic inheritance and germline immortality. Nature. 2012;489:447–451. doi: 10.1038/nature11352. [DOI] [PMC free article] [PubMed] [Google Scholar]
- 58.Guérin T.M., Palladino F., Robert V.J. Transgenerational functions of small RNA pathways in controlling gene expression in C. elegans. Epigenetics. 2014;9:37–44. doi: 10.4161/epi.26795. [DOI] [PMC free article] [PubMed] [Google Scholar]
- 59.Hill-Burns E.M., Debelius J.W., Morton J.T., Wissemann W.T., Lewis M.R., Wallen Z.D., Peddada S.D., Factor S.A., Molho E., Zabetian C.P., et al. Parkinson's disease and Parkinson's disease medications have distinct signatures of the gut microbiome. Mov. Disord. 2017;32:739–749. doi: 10.1002/mds.26942. [DOI] [PMC free article] [PubMed] [Google Scholar]
- 60.Tan A.H., Lim S.Y., Lang A.E. The microbiome-gut-brain axis in Parkinson disease-from basic research to the clinic. Nat. Rev. Neurol. 2022;18:476–495. doi: 10.1038/s41582-022-00681-2. [DOI] [PubMed] [Google Scholar]
- 61.Ding Y.-H., Ochoa H.J., Ishidate T., Shirayama M., Mello C.C. The nuclear Argonaute HRDE-1 directs target gene re-localization and shuttles to nuage to promote small RNA mediated inherited silencing. Cell Rep. 2023;42:112408. doi: 10.1016/j.celrep.2023.112408. [DOI] [PMC free article] [PubMed] [Google Scholar]
- 62.Gaeta A.L., Nourse J.B., Jr., Willicott K., McKay L.E., Keogh C.M., Peter K., Russell S.N., Hamamichi S., Berkowitz L.A., Caldwell K.A., et al. Systemic RNA Interference Defective (SID) genes modulate dopaminergic neurodegeneration in C. elegans. PLoS Genet. 2022;18:e1010115. doi: 10.1371/journal.pgen.1010115. [DOI] [PMC free article] [PubMed] [Google Scholar]
- 63.Wenzel D., Palladino F., Jedrusik-Bode M. Epigenetics in C. elegans: facts and challenges. Genesis. 2011;49:647–661. doi: 10.1002/dvg.20762. [DOI] [PubMed] [Google Scholar]
- 64.Posner R., Toker I.A., Antonova O., Star E., Anava S., Azmon E., Hendricks M., Bracha S., Gingold H., Rechavi O. Neuronal small RNAs control behavior transgenerationally. Cell. 2019;177:1814–1826.e15. doi: 10.1016/j.cell.2019.04.029. [DOI] [PMC free article] [PubMed] [Google Scholar]
- 65.Manterola M., Palominos M.F., Calixto A. The heritability of behaviors associated with the host gut microbiota. Front. Immunol. 2021;12:658551. doi: 10.3389/fimmu.2021.658551. [DOI] [PMC free article] [PubMed] [Google Scholar]
- 66.Rechavi O., Lev I. Principles of transgenerational small RNA inheritance in Caenorhabditis elegans. Curr. Biol. 2017;27:R720–R730. doi: 10.1016/j.cub.2017.05.043. [DOI] [PubMed] [Google Scholar]
- 67.Arribere J.A., Kuroyanagi H., Hundley H.A. mRNA editing, processing and quality control in Caenorhabditis elegans. Genetics. 2020;215:531–568. doi: 10.1534/genetics.119.301807. [DOI] [PMC free article] [PubMed] [Google Scholar]
- 68.Carelli F.N., Sharma G., Ahringer J. Broad chromatin domains: an important facet of genome regulation. Bioessays. 2017;39:1700124. doi: 10.1002/bies.201700124. [DOI] [PubMed] [Google Scholar]
- 69.Tamtaji O.R., Behnam M., Pourattar M.A., Jafarpour H., Asemi Z. Aquaporin 4: a key player in Parkinson’s disease. J. Cell. Physiol. 2019;234:21471–21478. doi: 10.1002/jcp.28871. [DOI] [PubMed] [Google Scholar]
- 70.Fraga D., Aryal M., Hall J.E., Rae E., Snider M. Characterization of the arginine kinase isoforms in Caenorhabditis elegans. Comp. Biochem. Physiol. B Biochem. Mol. Biol. 2015;187:85–101. doi: 10.1016/j.cbpb.2015.05.002. [DOI] [PubMed] [Google Scholar]
- 71.McQuary P.R., Liao C.Y., Chang J.T., Kumsta C., She X., Davis A., Chu C.C., Gelino S., Gomez-Amaro R.L., Petrascheck M., et al. C. elegans S6K mutants require a creatine-kinase-like effector for lifespan extension. Cell Rep. 2016;14:2059–2067. doi: 10.1016/j.celrep.2016.02.012. [DOI] [PMC free article] [PubMed] [Google Scholar]
- 72.Maduzia L.L., Gumienny T.L., Zimmerman C.M., Wang H., Shetgiri P., Krishna S., Roberts A.F., Padgett R.W. lon-1 regulates Caenorhabditis elegans body size downstream of the dbl-1 TGFβ signaling pathway. Dev. Biol. 2002;246:418–428. doi: 10.1006/dbio.2002.0662. [DOI] [PubMed] [Google Scholar]
- 73.Mørch M.G.M., Møller K.V., Hesselager M.O., Harders R.H., Kidmose C.L., Buhl T., Fuursted K., Bendixen E., Shen C., Christensen L.G., et al. The TGF-β ligand DBL-1 is a key player in a multifaceted probiotic protection against MRSA in C. elegans. Sci. Rep. 2021;11:10717. doi: 10.1038/s41598-021-89831-y. [DOI] [PMC free article] [PubMed] [Google Scholar]
- 74.Iwata N., Tsubuki S., Takaki Y., Watanabe K., Sekiguchi M., Hosoki E., Kawashima-Morishima M., Lee H.J., Hama E., Sekine-Aizawa Y., Saido T.C. Identification of the major Abeta1-42-degrading catabolic pathway in brain parenchyma: suppression leads to biochemical and pathological deposition. Nat. Med. 2000;6:143–150. doi: 10.1038/72237. [DOI] [PubMed] [Google Scholar]
- 75.Chambers I.G., Willoughby M.M., Hamza I., Reddi A.R. One ring to bring them all and in the darkness bind them: the Trafficking of Heme without Deliverers. Biochim. Biophys. Acta Mol. Cell Res. 2021;1868:118881. doi: 10.1016/j.bbamcr.2020.118881. [DOI] [PMC free article] [PubMed] [Google Scholar]
- 76.Dutt S., Hamza I., Bartnikas T.B. Molecular mechanisms of iron and heme metabolism. Annu. Rev. Nutr. 2022;42:311–335. doi: 10.1146/annurev-nutr-062320-112625utt. [DOI] [PMC free article] [PubMed] [Google Scholar]
- 77.Patel D., Xu C., Nagarajan S., Liu Z., Hemphill W.O., Shi R., Uversky V.N., Caldwell G.A., Caldwell K.A., Witt S.N. Alpha-synuclein inhibits Snx-3-retromer-mediated recycling of iron transporters in S. cerevisae and C. elegans models of Parkinson’s disease. Hum. Mol. Genet. 2018;27:1514–1532. doi: 10.1093/hmg/ddy059. [DOI] [PubMed] [Google Scholar]
- 78.Ratan R.R. The chemical biology of ferroptosis in the central nervous system. Cell Chem. Biol. 2020;27:479–498. doi: 10.1016/j.chembiol.2020.03.007. [DOI] [PMC free article] [PubMed] [Google Scholar]
- 79.Karuppagounder S.S., Alim I., Khim S.J., Bourassa M.W., Sleiman S.F., John R., Thinnes C.C., Yeh T.L., Demetriades M., Neitemeier S., et al. Therapeutic targeting of oxygen-sensing prolyl hydroxylases abrogates ATF4-dependent neuronal death and improves outcomes after brain hemorrhage in several rodent models. Sci. Transl. Med. 2016;8:328ra29. doi: 10.1126/scitranslmed.aac6008. [DOI] [PMC free article] [PubMed] [Google Scholar]
- 80.Costa-Mattioli M., Walter P. The integrated stress response: from mechanism to disease. Science. 2020;368:eaat5314. doi: 10.1126/science.aat5314. [DOI] [PMC free article] [PubMed] [Google Scholar]
- 81.Abdel-Nour M., Carneiro L.A.M., Downey J., Tsalikis J., Outlioua A., Prescott D., Da Costa L.S., Hovingh E.S., Farahvash A., Gaudet R.G., et al. The heme-regulated inhibitor is a cytosolic sensor of protein misfolding that controls innate immune signaling. Science. 2019;365:eaaw4144. doi: 10.1126/science.aaw4144. [DOI] [PMC free article] [PubMed] [Google Scholar]
- 82.Ranu R.S. Regulation of protein synthesis in rabbit reticulocyte lysates: the hemeregulated protein kinase (HRI) and double stranded RNA induced protein kinase (dRI) phosphorylate the same site(s) on initiation factor eIF-2. Biochem. Biophys. Res. Commun. 1979;91:1437–1444. doi: 10.1016/0006-291x(79)91227-0. [DOI] [PubMed] [Google Scholar]
- 83.Nourse J.B., Jr., Russell S.N., Moniz N.A., Peter K., Seyfarth L.M., Scott M., Park H.A., Caldwell K.A., Caldwell G.A. Integrated regulation of dopaminergic and epigenetic effectors of neurodegeneration in Parkinson’s disease models. Proc. Natl. Acad. Sci. USA. 2023;120 doi: 10.1073/pnas.2210712120. e2210712120. [DOI] [PMC free article] [PubMed] [Google Scholar]
- 84.Mew M., Caldwell K.A., Caldwell G.A. From bugs to bedside: functional annotation of human genetic variation using invertebrate models. Hum. Mol. Genet. 2022;31:R37–R46. doi: 10.1093/hmg/ddac203. [DOI] [PMC free article] [PubMed] [Google Scholar]
- 85.Wallen Z.D., Demirkan A., Twa G., Cohen G., Dean M.N., Standaert D.G., Sampson T.R., Payami H. Metagenomics of Parkinson's disease implicates the gut microbiome in multiple disease mechanisms. Nat. Commun. 2022;13:6958. doi: 10.1038/s41467-022-34667-x. [DOI] [PMC free article] [PubMed] [Google Scholar]
- 86.Frøkjaer-Jensen C., Davis M.W., Hopkins C.E., Newman B.J., Thummel J.M., Olesen S.P., Grunnet M., Jorgensen E.M. Single-copy insertion of transgenes in Caenorhabditis elegans. Nat. Genet. 2008;40:1375–1383. doi: 10.1038/ng.248. [DOI] [PMC free article] [PubMed] [Google Scholar]
- 87.Kim D., Paggi J.M., Park C., Bennett C., Salzberg S.L. Graph-based genome alignment and genotyping with HISAT2 and HISAT-genotype. Nat. Biotechnol. 2019;37:907–915. doi: 10.1038/s41587-019-0201-4. [DOI] [PMC free article] [PubMed] [Google Scholar]
- 88.Anders S., Pyl P.T., Huber W. HTseq-a Python framework to work with high-throughput sequencing data. Bioinformatics. 2015;31:166–169. doi: 10.1093/bioinformatics/btu638. [DOI] [PMC free article] [PubMed] [Google Scholar]
- 89.Anders S., Huber W. Differential expression analysis for sequence count data. Genome Biol. 2010;11:R106. doi: 10.1186/gb-2010-11-10-r106. [DOI] [PMC free article] [PubMed] [Google Scholar]
- 90.Holdorf A.D., Higgins D.P., Hart A.C., Boag P.R., Pazour G.J., Walhout A.J.M., Walker A.K. WormCat: an online tool for annotation and visualization of Caenorhabditis elegans genome-scale data. Genetics. 2020;214:279–294. doi: 10.1534/genetics.119.302919. [DOI] [PMC free article] [PubMed] [Google Scholar]
- 91.Berkowitz L.A., Hamamichi S., Knight A.L., Harrington A.J., Caldwell G.A., Caldwell K.A. Application of a C. elegans dopamine neuron degeneration assay for the validation of potential Parkinson's disease genes. J. Vis. Exp. 2008;18:835. doi: 10.3791/835. [DOI] [PMC free article] [PubMed] [Google Scholar]
- 92.Martinez B.A., Caldwell K.A., Caldwell G.A. C. elegans as a model system to accelerate discovery for Parkinson disease. Curr. Opin. Genet. Dev. 2017;44:102–109. doi: 10.1016/j.gde.2017.02.011. [DOI] [PubMed] [Google Scholar]
- 93.Mortazavi A., Williams B.A., McCue K., Schaeffer L., Wold B. Mapping and quantifying mammalian transcriptomes by RNA-Seq. Nat. Methods. 2008;5:621–628. doi: 10.1038/NMETH.1226. [DOI] [PubMed] [Google Scholar]
- 94.Locke C.J., Williams S.N., Schwarz E.M., Caldwell G.A., Caldwell K.A. Genetic interactions among cortical malformation genes that influence susceptibility to convulsions in C. elegans. Brain Res. 2006;1120:23–34. doi: 10.1016/j.brainres.2006.08.067. [DOI] [PubMed] [Google Scholar]
- 95.Knight A.L., Yan X., Hamamichi S., Ajjuri R.R., Mazzulli J.R., Zhang M.W., Daigle J.G., Zhang S., Borom A.R., Roberts L.R., et al. The glycolitic enzyme GPI, is a functionally conserved modifier of dopaminergic neurodegeneration in Parkinson’s models. Cell Metabol. 2014;20:145–157. doi: 10.1016/j.cmet.2014.04.017. [DOI] [PMC free article] [PubMed] [Google Scholar]
Associated Data
This section collects any data citations, data availability statements, or supplementary materials included in this article.
Data Availability Statement
-
•
RNA-seq data have been deposited in the Gene Expression Omnibus (GEO) and are publicly available as of the date of publication. Accession numbers are listed in the key resources table.
-
•
This paper does not report original code.
-
•
Any additional information required to reanalyze the data reported in this paper is available from the lead contact upon request.