. 2023 May 27;15(1):2217964. doi: 10.1080/19420862.2023.2217964

Figure 1.

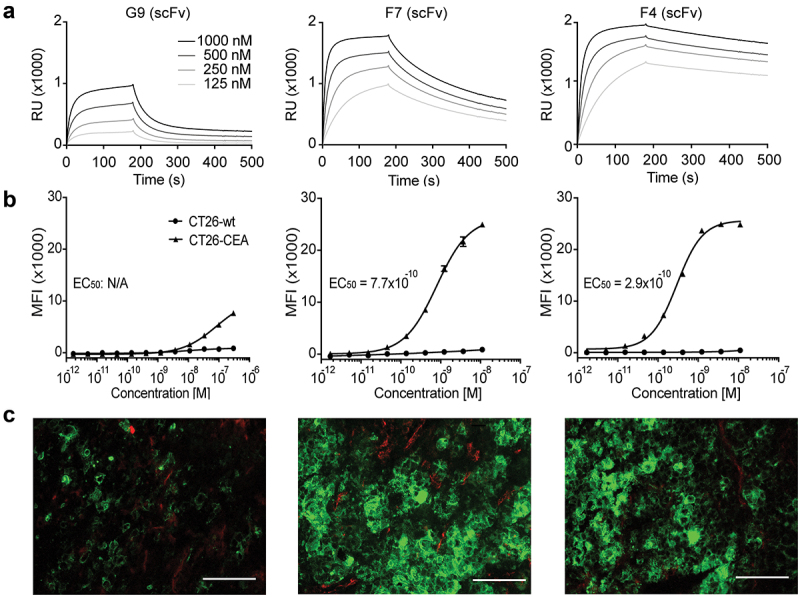
A: Three SPR line graphs plotting antibody binding over time. All clones show a fast association. G9 has fast dissociation, F7 has intermediate dissociation, and F4 has slow dissociation. B: Three titration flow cytometry graphs plotting mean fluorescence intensity over increasing concentration. G9 values on CT26-CEA cells are moderately increasing in high concentrations. F7 and F4 display an increasing sigmoidal curve on CT26-CEA cells. No clone binds to CT26-wildtype cellsC: Immunofluorescence staining with the new antibodies. Intermediate green staining is present with G9, and strong green staining is present with F7 and F4.

In vitro characterization of new anti-CEA antibodies. (a) SPR sensorgram of G9, F7, and F4 in a scFv format. KD values were calculated to be 640 nM, 50 nM, and 7.7 nM, respectively. (b) Flow cytometry analysis with the new antibodies in IgG format on CEA-expressing CT26 cells and on CEA-negative CT26 wild-type cells. (c) Immunofluorescence staining with IgG formats on the human colon adenocarcinoma xenograft LS174T. Anti-CEA antibodies were detected in green. Blood vessels were detected by CD31 staining (red). 20× magnification, scale bars = 100 μm.