Abstract
Cohesin-mediated loop extrusion has been shown to be blocked at specific cis-elements, including CTCF sites, producing patterns of loops and domain boundaries along chromosomes. Here, we explore such cis-elements, and their role in gene regulation. We find that transcription termination sites of active genes form cohesin- and RNA polymerase II-dependent domain boundaries that do not accumulate cohesin. At these sites, cohesin is first stalled and then rapidly unloaded. Start sites of transcriptionally active genes form cohesin-bound boundaries, as shown before, but are cohesin-independent. Together with cohesin loading possibly at enhancers, these sites create a pattern of cohesin traffic that guides enhancer-promoter interactions. Disrupting this traffic pattern, by removing CTCF, renders cells sensitive to knock-out of genes involved in transcription initiation, such as the SAGA complexes, and RNA processing such DEAD/H-Box RNA helicases. Without CTCF, these factors are less efficiently recruited to active promoters.
INTRODUCTION
At the scale of tens to hundreds of kilobases, the genome folds into Topologically Associating Domains (TADs) or loop domains, and locus-specific chromatin loops1–4. TADs and loops are formed by a loop extrusion mechanism mediated by cohesin complexes5–7. The cohesin complex dynamically extrudes loops and accumulates most prominently at CTCF sites during interphase8–10. Cohesin also accumulates at active promoters and, under specific conditions, near 3’ ends of genes and sites of convergent transcription11. The interplay between cohesin and CTCF drives loop extrusion leading to enrichment of interactions within TADs, depletion of interactions across TAD boundaries (insulation) and looping between CTCF sites7,8,10,12–17.
Many open questions remain to be addressed to fully understand the process of loop extrusion. It is currently not known how and where cohesin is recruited to chromatin, how the complex actively extrudes loops, if extrusion occurs uni-directionally or bi-directionally or whether additional types of cis-elements that function equivalently to CTCF-bound sites exist along chromosomes, and how they cooperate to regulate cohesin dynamics.
TADs are thought to regulate gene expression by allowing enhancer-promoter interactions within the domain, while disfavoring such interactions across their boundaries14,18–22. However, acute global depletion of CTCF or the cohesin subunit RAD21 leads to only a small number of gene expression changes, despite genome-wide loss of TADs and CTCF-CTCF loops (CTCF depletion8,23), or loss of all extrusion features (RAD21 depletion12). Therefore, the biological functions of loop extrusion, and cohesin blocking at specific sites, remain poorly understood.
Here, we analyzed Hi-C data from cells depleted of CTCF, RAD21, WAPL, or RNA polymerase II to describe the intricate local folding of chromosomes and the roles of different types of cis-elements in guiding cohesin-mediated loop extrusion. From this analysis, a complex picture of cohesin trafficking along chromosomes emerges. To uncover functional roles for this intricate chromosome organization, we performed genome-wide CRISPR screens in cells with altered cohesin traffic patterns. We identified genes involved in transcription initiation and RNA processing and find that these factors are mislocalized when the cohesin traffic pattern is disrupted.
RESULTS
Active TSSs are CTCF-independent chromatin domain boundaries
To further understand the functional roles of CTCF-CTCF chromatin loops and potentially reveal other elements that could influence or control the loop extrusion machinery we acutely depleted CTCF using an auxin-inducible degron system from HAP1-derived human cells. This cell line, HAP1-CTCFdegron-TIR1, expresses CTCF fused to AID at both the N- and C-termini and a C-terminal GFP tag, as well as TIR1 which mediates auxin-inducible protein degradation (Extended Data Fig. 1a). Addition of auxin to HAP1-CTCFdegron-TIR1 cells resulted in efficient depletion of CTCF (Extended Data Fig. 1b,c). We also generated the HAP1-CTCFdegron cell line without TIR1. We noted that even without addition of auxin the CTCF protein level was reduced compared to the level observed in HAP1-CTCFdegron cells lacking TIR1 (Extended Data Fig. 1b,c). The cell cycle profile of HAP1-CTCFdegron-TIR1 cultures was not altered after 48 hours of CTCF depletion (Extended Data Fig. 1d).
We performed Hi-C on HAP1-CTCFdegron and HAP1-CTCFdegron-TIR1 cells grown in the absence or presence of auxin for 48 hours. As a measure of average loop size, we analyzed the relationship between Hi-C interaction frequency as a function of genomic distance between loci24. Interestingly, we found that the average loop size increased progressively when CTCF levels were reduced or entirely depleted. When CTCF is removed, CTCF-mediated blocking of loop extrusion is reduced or abolished, and longer loops are extruded (Extended Data Fig. 1e). Compartmentalization was only modestly affected (Extended Data Fig. 1f,g). Reduced CTCF levels in HAP1-CTCFdegron-TIR1 cells compared to HAP1-CTCFdegron cells, in the absence of auxin, resulted in weaker domain boundaries at CTCF sites and weaker CTCF-CTCF loops (Extended Data Fig. 1h–j). Depletion of CTCF by auxin addition resulted in near complete loss of looping interactions between CTCF sites and loss of insulation at domain boundaries. This is consistent with previous observations in CTCF degron cell lines8,10,13.
To assess how the genomic positioning of cohesin is affected after CTCF depletion, we performed Chromatin ImmunoPrecipitation sequencing (ChIP-seq) for CTCF and the cohesin subunit RAD21 in HAP1-CTCFdegron-TIR1 cells in the presence or absence of CTCF. Only around 40% of the CTCF peaks overlapped with RAD21 peaks, showing that not all CTCF sites are associated with cohesin. Moreover, approximately 50% of the RAD21 peaks overlapped with CTCF peaks, suggesting that RAD21 can accumulate at locations devoid of CTCF (Fig. 1a).
Figure 1: Active promoters/TSSs form CTCF-independent chromatin domain boundaries.
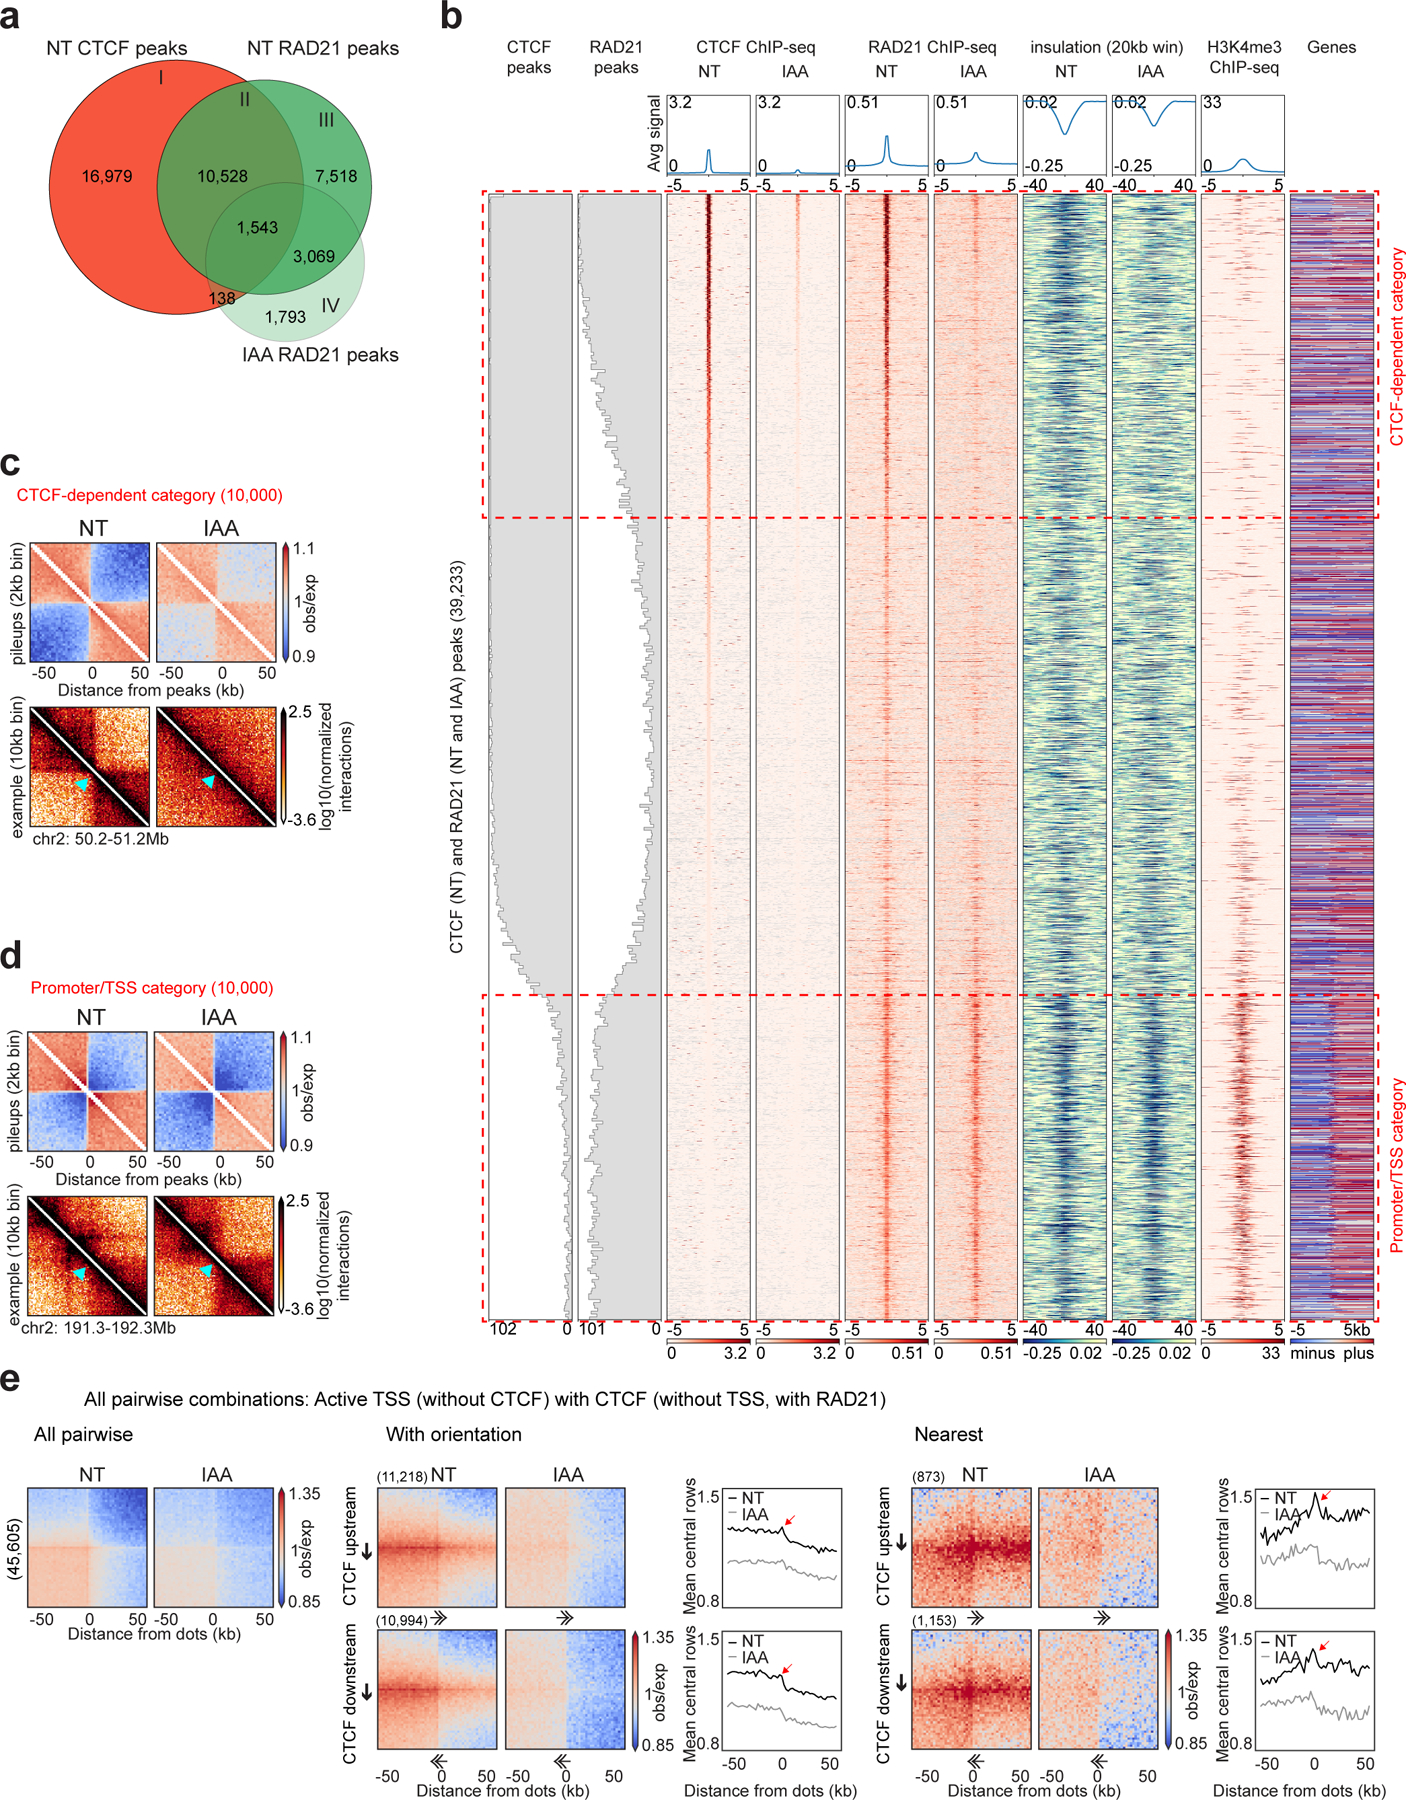
a, Venn diagram showing the overlap between CTCF peaks without auxin (NT), RAD21 peaks without/with auxin (NT and IAA).
b, Stackups of the union list of all CTCF peaks called without auxin and RAD21 peaks called without/with auxin, sorted on NT CTCF ChIP-seq signal. CTCF and RAD21 ChIP-seq and calculated insulation without/with auxin were plotted along with the published HAP1 H3K4me3 ChIP-seq and the genes (red, plus: forward strand, blue, minus: reverse strand, grey: no annotated transcripts)26. The distribution of CTCF and RAD21 peaks were plotted along the stackup. Red dashed rectangles highlight CTCF-dependent category and promoter/TSS category.
c, Interaction pileup for the CTCF-dependent category (10,000 sites), without/with auxin, aggregated in a 100kb window at 2kb resolution and plotted along with a representative example of a boundary. The light blue arrow shows the boundary location.
d, Interaction pileup for the promoter/TSS category (10,000 sites), as described in 1c.
e, Dot pileup aggregation plots for pairwise combinations of active TSSs (without CTCF) and CTCF peaks (without TSSs, with RAD21) separated by 50–500kb, without/with auxin, for a 100kb window at 2kb resolution. All pairwise interactions (left). With orientation (middle). CTCF (upstream or downstream)-TSS pairwise interactions are plotted with their quantification (mean of the 5 central bins at the CTCF site). Nearest analysis (right). CTCF (upstream or downstream)-TSS pairwise interactions are plotted without any CTCF peaks or TSSs in between them with their quantification (mean of the 5 central bins at the CTCF site). The red arrows represent the peak of interactions between CTCF site and TSS. The black arrows represent the CTCF motif and the direction of the arrow, the motif orientation. The double arrows represent the TSS and the direction of the arrow, the TSS orientation.
We were interested in determining whether the sites that accumulate cohesin but not CTCF were able to form chromatin domain boundaries. Domain boundary formation can be quantified by the insulation metric, which measures the extent to which long-range chromatin interactions across a boundary are reduced compared to a global average25. To characterize the elements at which cohesin accumulates, we created a union list of all RAD21 peaks detected in either the presence or absence of CTCF and all the CTCF peaks detected in CTCF-expressing cells. We then analyzed CTCF and RAD21 accumulation and insulation for these sites in CTCF-expressing and CTCF-depleted HAP1-CTCFdegron-TIR1 cells and ranked these sites by the level of CTCF binding in CTCF expressing cells. We also assessed the active promoter mark H3K4me3 and coding gene locations from published datasets (Fig. 1b)26. We identified three major groups of elements. The first group binds both CTCF and RAD21 at high levels with most sites included in the sets of significantly enriched CTCF and RAD21 peaks. These sites displayed strong insulation, indicating they form domain boundaries. Sites in this group lose RAD21 binding and insulation upon CTCF depletion. The second group also bound CTCF at high levels and were often included in the set of significant CTCF peaks. However, these sites did not bind RAD21 and did not display insulation, indicating they were not chromatin domain boundaries. The third group did not show enriched CTCF binding, but displayed relatively high levels of RAD21 binding and insulation in control cells. Most of these sites contained active promoters/Transcription Start Sites (TSSs). Upon CTCF depletion, these sites continued to accumulate RAD21 and to display insulation. This analysis shows that active promoters/TSSs can act as domain boundaries, as was shown previously in the mouse27,28, and these boundaries are CTCF-independent (Fig. 1b).
By aggregating Hi-C interactions at CTCF-dependent sites and at active promoters/TSSs lacking CTCF binding and inspecting representative examples, we confirmed insulation is lost at CTCF-dependent sites but persisted at the promoter/TSS sites after CTCF depletion (Fig. 1c–d). Importantly, most of these boundaries did not overlap with compartment boundaries and therefore were bona fide cohesin-bound chromatin domain boundaries (Extended Data Fig. 2a).
We further confirmed that these boundaries were active promoters/TSSs by analyzing CTCF and RAD21 binding and insulation in relation to H3K4me3 levels, and RNA-seq signal (Extended Data Fig. 2b). We conclude that RAD21 is enriched in at least at two different types of locations that form domain boundaries: 1) at CTCF sites, where RAD21 accumulation is dependent on CTCF; and 2) at active promoters/TSSs independent of CTCF binding27. Further, insulation at such TSSs is maintained when CTCF is depleted, indicating it does not depend on distal CTCF sites.
Next, we examined long-range looping interactions between boundaries by aggregating interactions for all pairwise combinations between different types of cohesin-bound sites separated by 50–500kb. We found that active promoters/TSSs that lack CTCF binding frequently interacted with nearby CTCF sites that lack TSSs and display RAD21 binding. The interactions between active promoters/TSSs and distal CTCF sites were not due to any intervening CTCF sites or active promoters/TSSs (Fig. 1e, Extended Data Fig. 2c). As expected, all these interactions were CTCF-dependent and were most frequent when the CTCF motif was upstream of the promoter pointing toward the TSS. The orientation of the TSS itself appeared less consequential (Fig. 1e, Extended Data Fig. 2c).
In Hi-C interaction maps, lines of enriched interactions were visible from the distal CTCF sites towards the active TSSs. No such lines were detected anchored on TSSs. When we quantified the strength of this enrichment along CTCF-anchored stripes, we observed a peak in interactions centered on the TSSs (Fig. 1e). All these features disappeared when CTCF was depleted. We interpreted these results as follows: cohesin actively extrudes chromatin until it is blocked on one side by CTCF while continuing to extrude on the other side towards an active promoter/TSS. When it reaches the active promoter/TSS, extrusion pauses and results in a local enrichment of CTCF-promoter/TSS interactions. Cohesin can subsequently occasionally extrude beyond the active promoter/TSS, leading to continuation of the CTCF-anchored stripe-pattern in Hi-C beyond the TSS.
TTSs of active genes are CTCF-independent domain boundaries
By analyzing insulation profiles along genes, we found that active gene Transcription Termination Sites (TTSs) also form domain boundaries. We calculated insulation at active TTSs that do not contain CTCF-bound sites. We detected local minima in the insulation scores, consistent with the presence of boundaries (Fig. 2a). The local insulation minima were less precisely positioned as compared to those located at active promoters/TSSs and CTCF-bound sites, and their detection required calculating insulation scores using a larger genomic window (100kb instead of 20kb). Insulation at TTSs was unaffected after depletion of CTCF. Strong insulating TTSs correlated with the presence of R-loop at those locations (Fig. 2a, Extended Data Fig. 3a). Active TTS domain boundaries did not overlap with compartment boundaries (Extended Data Fig. 3b).
Figure 2: Active TTSs form chromatin boundaries and a cohesin traffic pattern defines promoter-enhancer interactions.
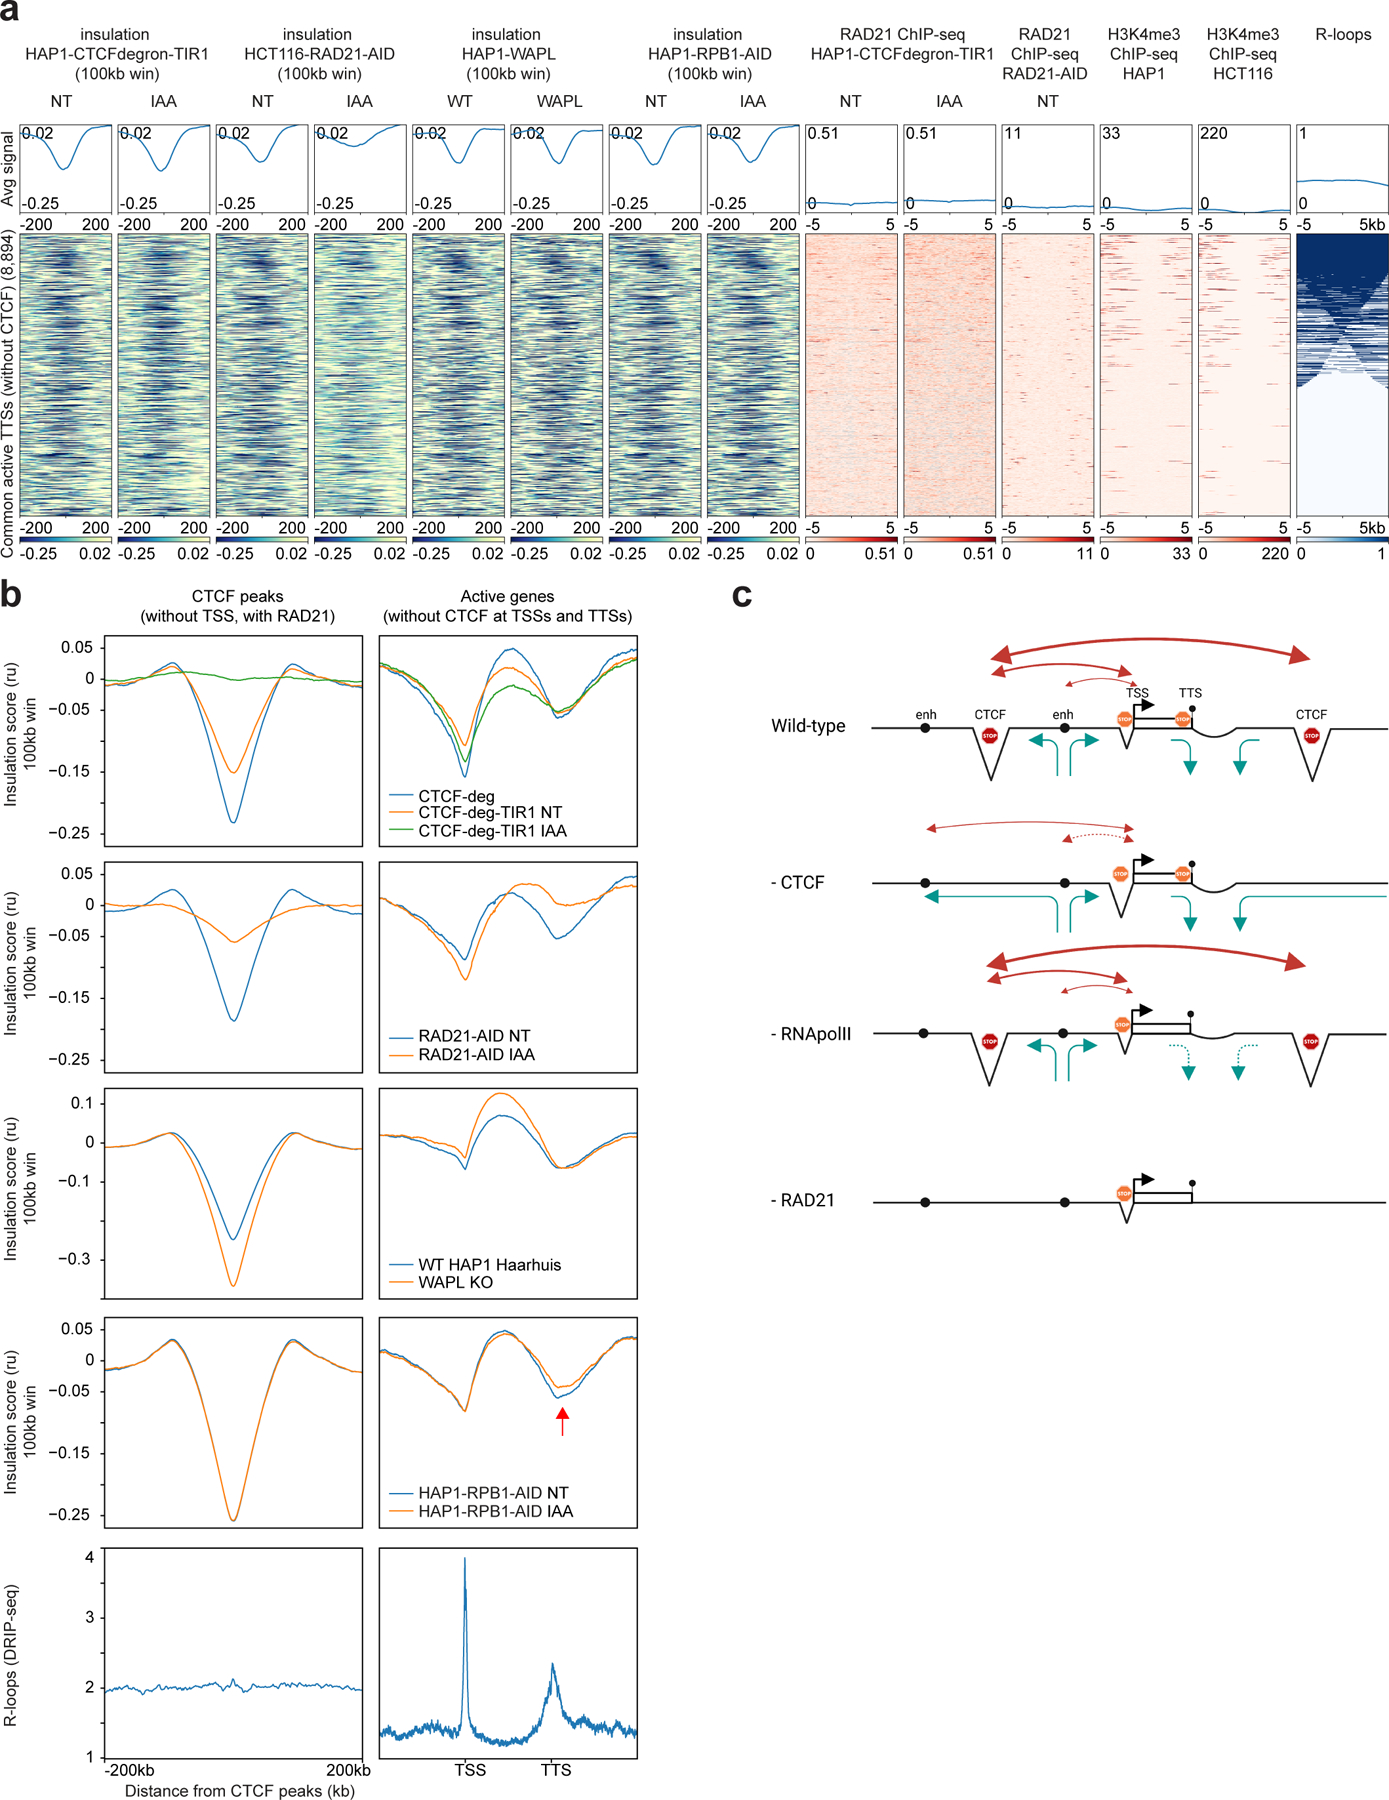
a, Stackups for active TTSs (without H3K4me3 active TSS histone mark and CTCF peaks, common between HAP1 and HCT116 cell lines) sorted on the consensus list of R-loops. Insulation in HAP1-CTCF-degron-TIR1, HCT116-RAD21-AID12 and HAP1-RPB1-AID cells without/with auxin (NT and IAA), insulation in WT HAP1 and WAPL knock-outs31 were plotted along with RAD21 ChIP-seq in the HAP1-CTCF-degron-TIR1 and HCT116-RAD21-AID12, H3K4me3 in HAP126 and HCT116 cells and the consensus list of R-loop signals. Stackups were flipped according to the orientation of the genes, to have the gene body on the left of the TTSs.
b, Average insulation profiles across CTCF peaks (without TSSs, with RAD21) (left plots) and across scaled active genes without CTCF at TSSs and TTSs (right plots) at 5kb resolution for the HAP1-CTCFdegron, HAP1-CTCFdegron-TIR1 without/with auxin (first row), for the published HCT116 RAD21-AID degron without/with auxin (second row)12, for the published WT HAP1 and WAPL knock-out (third row)31, for the HAP1-RPB1-AID without/with auxin (fourth row) and for the published R-loop DRIP-seq in K562 (fifth row)67. The red arrow represents the reduced insulation at TTSs after RNA polymerase II depletion.
c, Model for a cohesin traffic pattern. Cohesin traffic pattern (green arrows) in four cell lines (Wild-type, depleted for CTCF (- CTCF), depleted for RNA polII (- RNA polII) and depleted for RAD21 (- RAD21)) for a defined chromosomal locus. Triangles represent the three types of chromatin boundaries we identified across the locus: at CTCF sites, at active TSSs and TTSs. In this model, cohesin is loaded at enhancers (black circle), is blocked at CTCF sites, is blocked/paused at TSS (black arrow) and is blocked and unloaded at TTS (black circle on a stick). This pattern of cohesin dynamics results in promoter-enhancer interactions, CTCF sites-promoter interactions and CTCF-CTCF sites interactions (red arrows). CTCF depletion redefines the cohesin traffic resulting in re-wired promoter-enhancer interactions. RNA polII depletion mostly affects the insulation at TTSs. RAD21 depletion abolishes the cohesin trafficking and only keeps the insulation at TSSs which is mostly cohesin-independent.
We next plotted the average insulation profiles across distal CTCF sites and scaled active genes (Fig. 2b, Extended Data Fig. 3e). For this analysis, we only plotted data for active genes that lack CTCF binding at their promoters/TSSs and TTSs. For the HAP1-CTCF-degron cell lines, we noticed that the gene bodies display higher local interactions, with boundaries at their TSSs and TTSs, leading to formation of gene domains. Similar observations have been reported in Drosophila29. Interestingly, this analysis revealed that depletion of CTCF not only led to insulation loss at CTCF sites but also led to reduced interactions within the active gene bodies, as reflected in a decrease in the insulation score throughout the genes.
TSSs contrary to TTSs are cohesin-independent boundaries
We did not observe RAD21 binding at active TTSs, indicating that boundary formation at these sites might not depend on cohesin (Fig. 2a). To directly determine this, we used publicly available Hi-C data obtained from RAD21 depleted HCT116 cells (HCT116-RAD21-AID)12,30. We observed that local insulation at active TTSs in HCT116-RAD21-AID cells was nearly lost after RAD21 depletion (Fig. 2a, Extended Data Fig. 3c). Therefore, insulation at these sites does depend on cohesin. We next analyzed the insulation profiles for these cells as above. We find that boundary formation at active TTSs and at CTCF-bound sites both depend on cohesin (Fig. 2a,b, Extended Data Fig. 3c). However, insulation, and thus boundary formation, at TSSs was still observed even after depleting RAD21 (Fig. 2a,b, Extended Data Fig. 3c). One possible explanation is that boundary formation at TSSs is independent of cohesin. Alternatively, the small amount of RAD21 remaining at TSSs after auxin treatment may be sufficient for insulation (Extended Data Fig. 3d).
Cohesin stalling and unloading at TTS boundaries
Previous studies have shown that upon depletions of the cohesin unloader WAPL and CTCF, cohesin accumulates at 3’ ends of active genes, implying that in wild-type cells cohesin is stalled and unloaded at TTSs11. To determine if the insulation at these sites results from cohesin stalling, unloading, or a combination of both, we re-analyzed Hi-C data from WAPL depleted HAP1 cells31. As described previously, removing WAPL increases insulation at CTCF sites. However, we find that removing WAPL did not abolish insulation at active TTSs (Fig. 2a,b, Extended Data Fig. 3c). We conclude that insulation at active TTSs in normal cells is not simply the result of efficient cohesin unloading. Combined, our data support a model where TTSs act as sites where cohesin stalls leading to boundary formation. Cohesin is then rapidly removed by WAPL leading to no detectable RAD21 by ChIP-seq in normal cells.
RNA polymerase II depletion effect on chromatin boundaries
We explored whether active transcription is necessary for boundary formation at active promoters/TSSs and TTSs. We generated a HAP1 cell line that expresses an auxin inducible degron tagged RNA polymerase II (RNA polII) subunit, RPB1, from its endogenous promoter (HAP1-RPB1-AID). In the presence of auxin, RPB1 was efficiently depleted within 4 hours. The cell cycle profile was not altered, but cells stop growing within hours (Extended Data Fig. 4a,b). We performed Hi-C in HAP1-RPB1-AID cells without or with 4 hours of auxin treatment. Hi-C interaction frequency as a function of genomic distance between loci, compartmentalization, TAD boundaries and CTCF-CTCF looping interactions only slightly changed after removal of RNA polII (Extended Data Fig. 4c–e). The small subset of TAD boundaries that disappeared after RNA polII depletion was likely due to high levels of RPB1 accumulated at a few sites that may result in loop extrusion blocking (Extended Data Fig. 4e).
Relative to HAP1-WT cells, HAP1-RPB1-AID cells displayed weaker A and B compartments (Extended Data Fig. 4d). This may be due to lower levels of RNA polII in HAP1-RPB1-AID cells relative to the HAP1-WT cells (Extended Data Fig. 4b). Insulation profiles across CTCF sites were indistinguishable between RPB1 depleted cells and control cells. Interestingly, insulation at TSSs was unaffected by RBP1 depletion (Fig. 2b, Extended Data Fig. 3c). Insulation at active TTSs was reduced after RNA polII depletion, especially at TTSs containing R-loops (Fig. 2a–b, Extended Data Fig. 4f).
Cohesin traffic constrains promoter-enhancer interactions
Our data provide a comprehensive view of chromatin boundaries and their relationship to cohesin movement on the chromatin creating a cohesin traffic pattern modulated by CTCF and RNA polII (Fig. 2c).
We next investigated how the altered cohesin traffic pattern after CTCF depletion affected promoter-enhancer interactions. For this analysis, we defined enhancers as sites that are DNAseI hypersensitive, enriched in H3K27Ac, but not TSSs or CTCF-bound sites. We aggregated Hi-C data for all pairwise combinations between active TSSs and enhancers. We split the set of enhancer-promoter pairs in two groups: those that are separated by a CTCF-bound site and those without an intervening CTCF-bound site. We also analyzed enhancers located up- and downstream of the TSS separately. Finally, we examined the effects of the orientation of the CTCF sites located in between promoters and enhancers (Fig. 3a,b).
Figure 3: Rewiring of enhancer-promoter interactions after CTCF depletion.
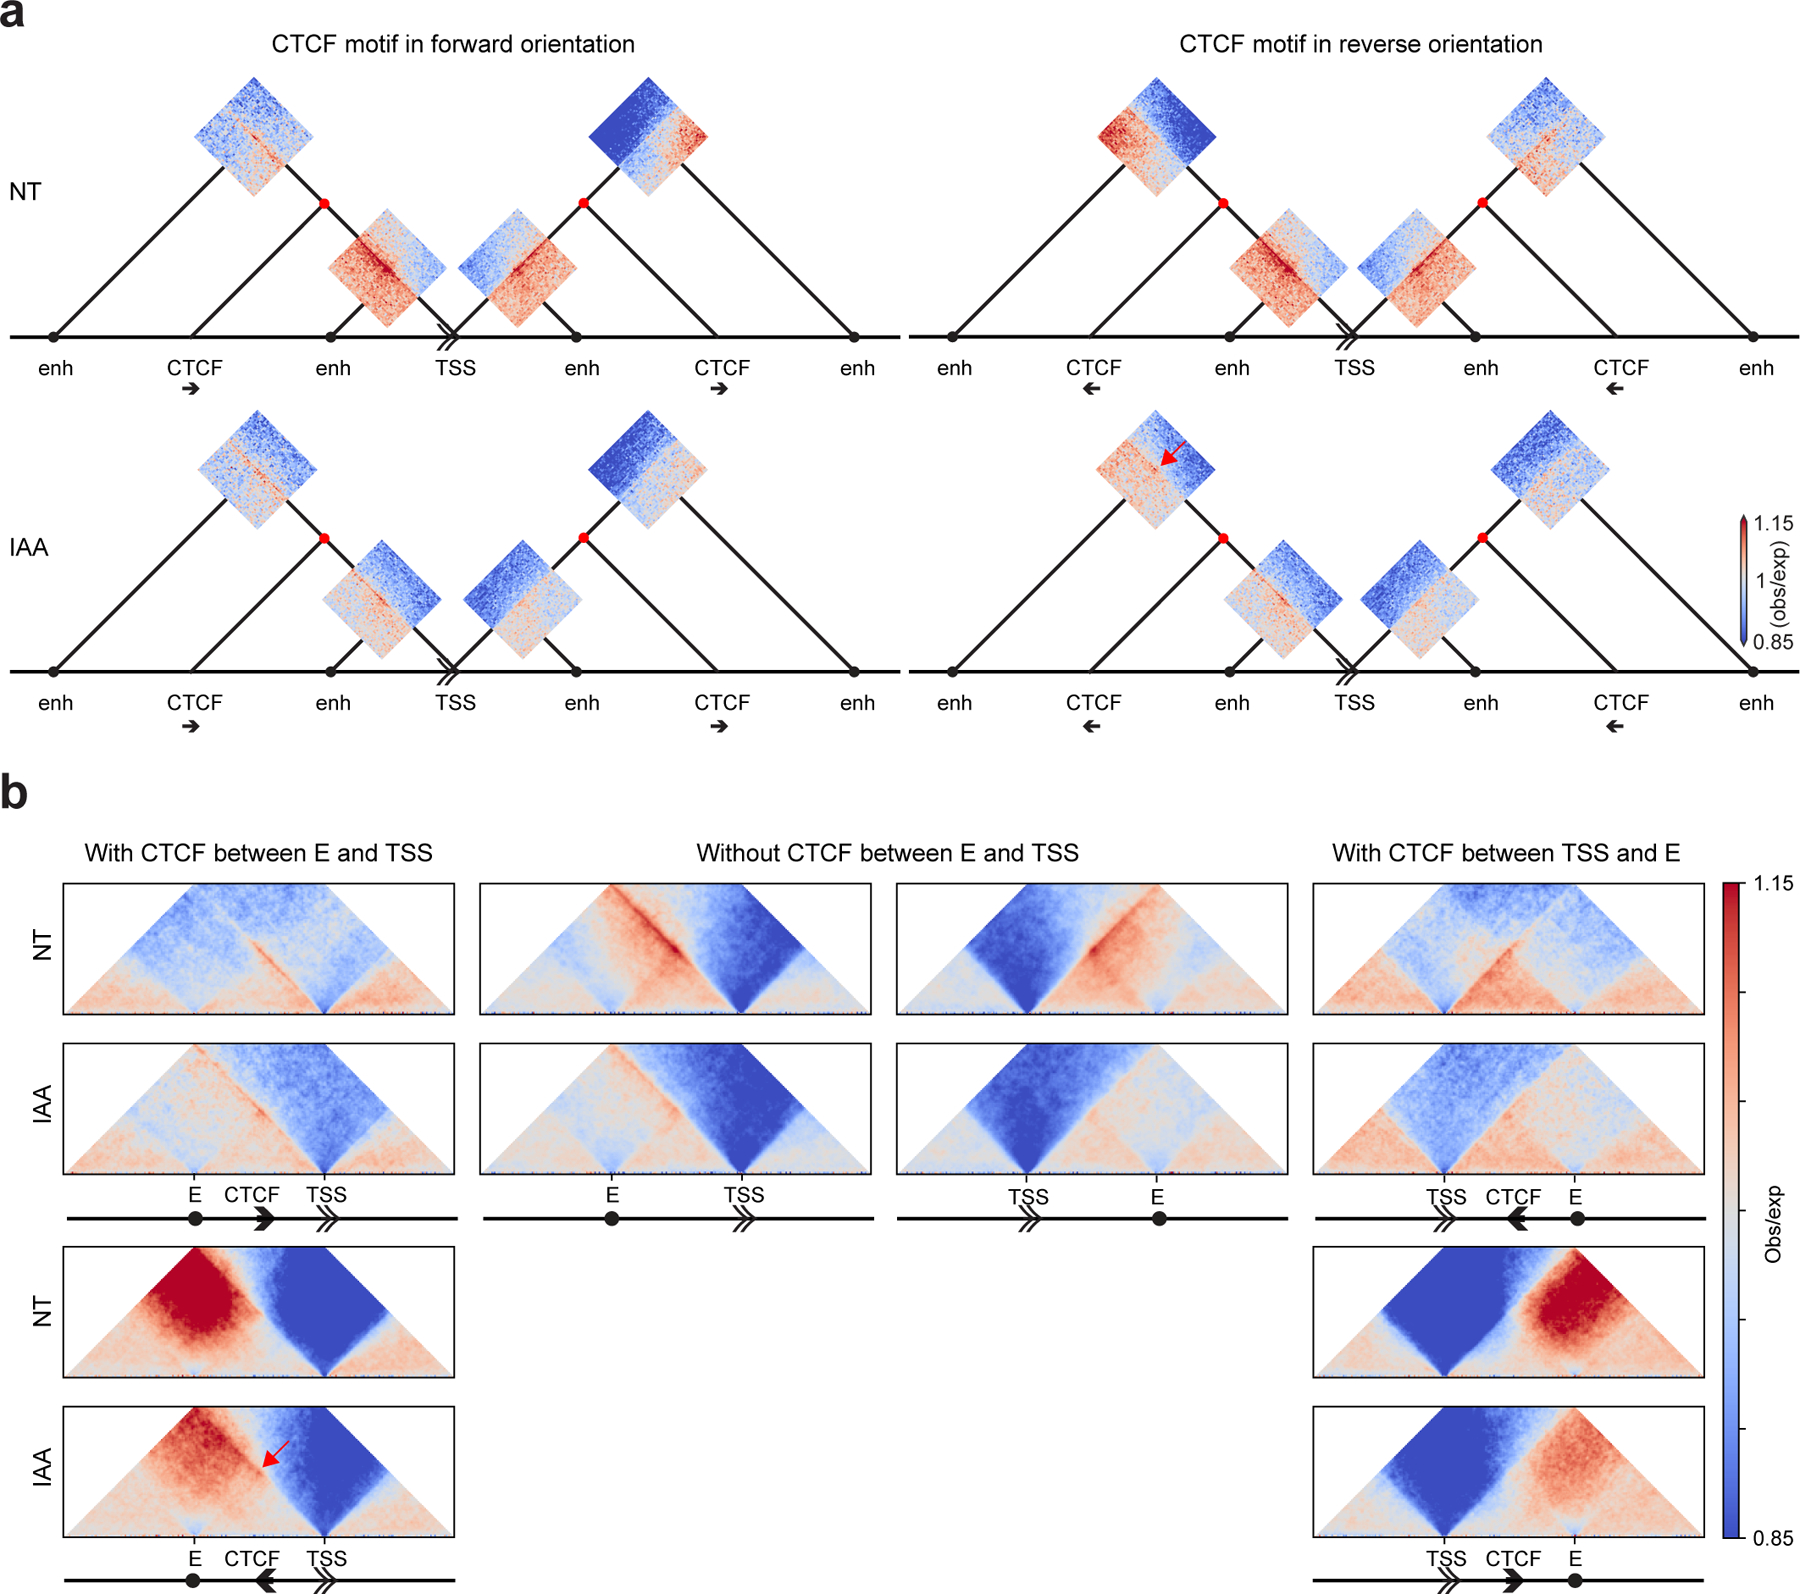
a, Dot pileups for all pairwise combinations between active TSSs (without CTCF) and enhancers (without CTCF or TSSs) separated by 50–500kb placed on the schematic representing the different interactions. Dot pileups were separated into: upstream or downstream of the TSS and having or not having a CTCF peak with RAD21 in between the TSS and the enhancer. The promoter-enhancer interactions that had a CTCF peak with RAD21 in between them were further classified based on the orientation of the CTCF motif (four different combinations). The dots were aggregated at the center of a 100kb window at 2kb resolution.
b, Aggregated and scaled Hi-C maps for enhancer (without CTCF or TSS)-TSS/promoter (without CTCF) pairs with or without intervening CTCF peaks with RAD21 for HAP1-CTCFdegron-TIR1 cells without/with auxin (NT and IAA) at 5kb resolution.
The double arrow represents the TSS and its orientation, the black arrow represents the CTCF peak, and the black circle represents the enhancer. The red dots represent interactions between CTCF and TSS. The red arrow highlights the interaction gain after CTCF removal between enhancers and TSSs separated by CTCF sites in the reverse orientation.
In cells expressing CTCF, we detected enriched interactions between promoters and enhancers only for those pairs that had no CTCF located in between them (Fig. 3a,b). After CTCF depletion, enhancer-promoter interactions were rewired: interactions of promoters with upstream distal enhancers located on the other side of CTCF sites pointing towards the enhancer increased, whereas interactions between promoters and enhancers separated by CTCF sites pointing toward the TSS or not separated by any CTCF sites decreased (Fig. 3a,b). This rewiring is expected when CTCF acts as an insulator, possibly by blocking cohesin-mediated loop extrusion. The CTCF-orientation dependence suggests that these interactions are 1) mediated through cohesin-dependent loop extrusion, and 2) that cohesin is extruding from distal upstream location, e.g., the enhancers, towards the TSS. Interestingly, we noted that interactions with downstream enhancers were not as prominent as interactions with enhancers located upstream of the TSS, as had been observed in analyses of targeted gene sets32.
CTCF and RNA processing proteins are genetically linked
The functions of the complex cohesin traffic pattern are not well characterized. We hypothesized that cells in which the cohesin traffic pattern is altered, e.g., through CTCF depletion, would be particularly sensitive to genetic perturbations of functions that depend on these phenomena. To test this, we used genome wide CRISPR screens based on cell proliferation. We performed these screens in HAP1-CTCFdegron-TIR1 cells expressing different levels of CTCF and compared the results to similar screens performed in HAP1-CTCF-degron cells expressing higher levels of CTCF (Fig. 4a, Extended Data Fig. 5a). Under these conditions, cell proliferation was only slightly reduced when CTCF was depleted (Extended Data Fig. 5b). Possibly, the remaining levels of CTCF were sufficient for growth, and/or auxin resistance emerged. We sequenced the pool of guide RNAs (sgRNAs) in HAP1-CTCFdegron-TIR1 and HAP1-CTCFdegron cell populations grown in the absence or presence of auxin and identified sgRNAs that became depleted or enriched in HAP1-CTCFdegron-TIR1 cells with or without auxin relative to HAP1-CTCFdegron cells. As expected, we found that sgRNAs targeting essential genes disappeared progressively over time, while most non-essential genes did not change. Our screens recovered gold standard essential gene sets (Extended Data Fig. 5c)33–36.
Figure 4: The cohesin traffic pattern is genetically linked to gene regulation factors.
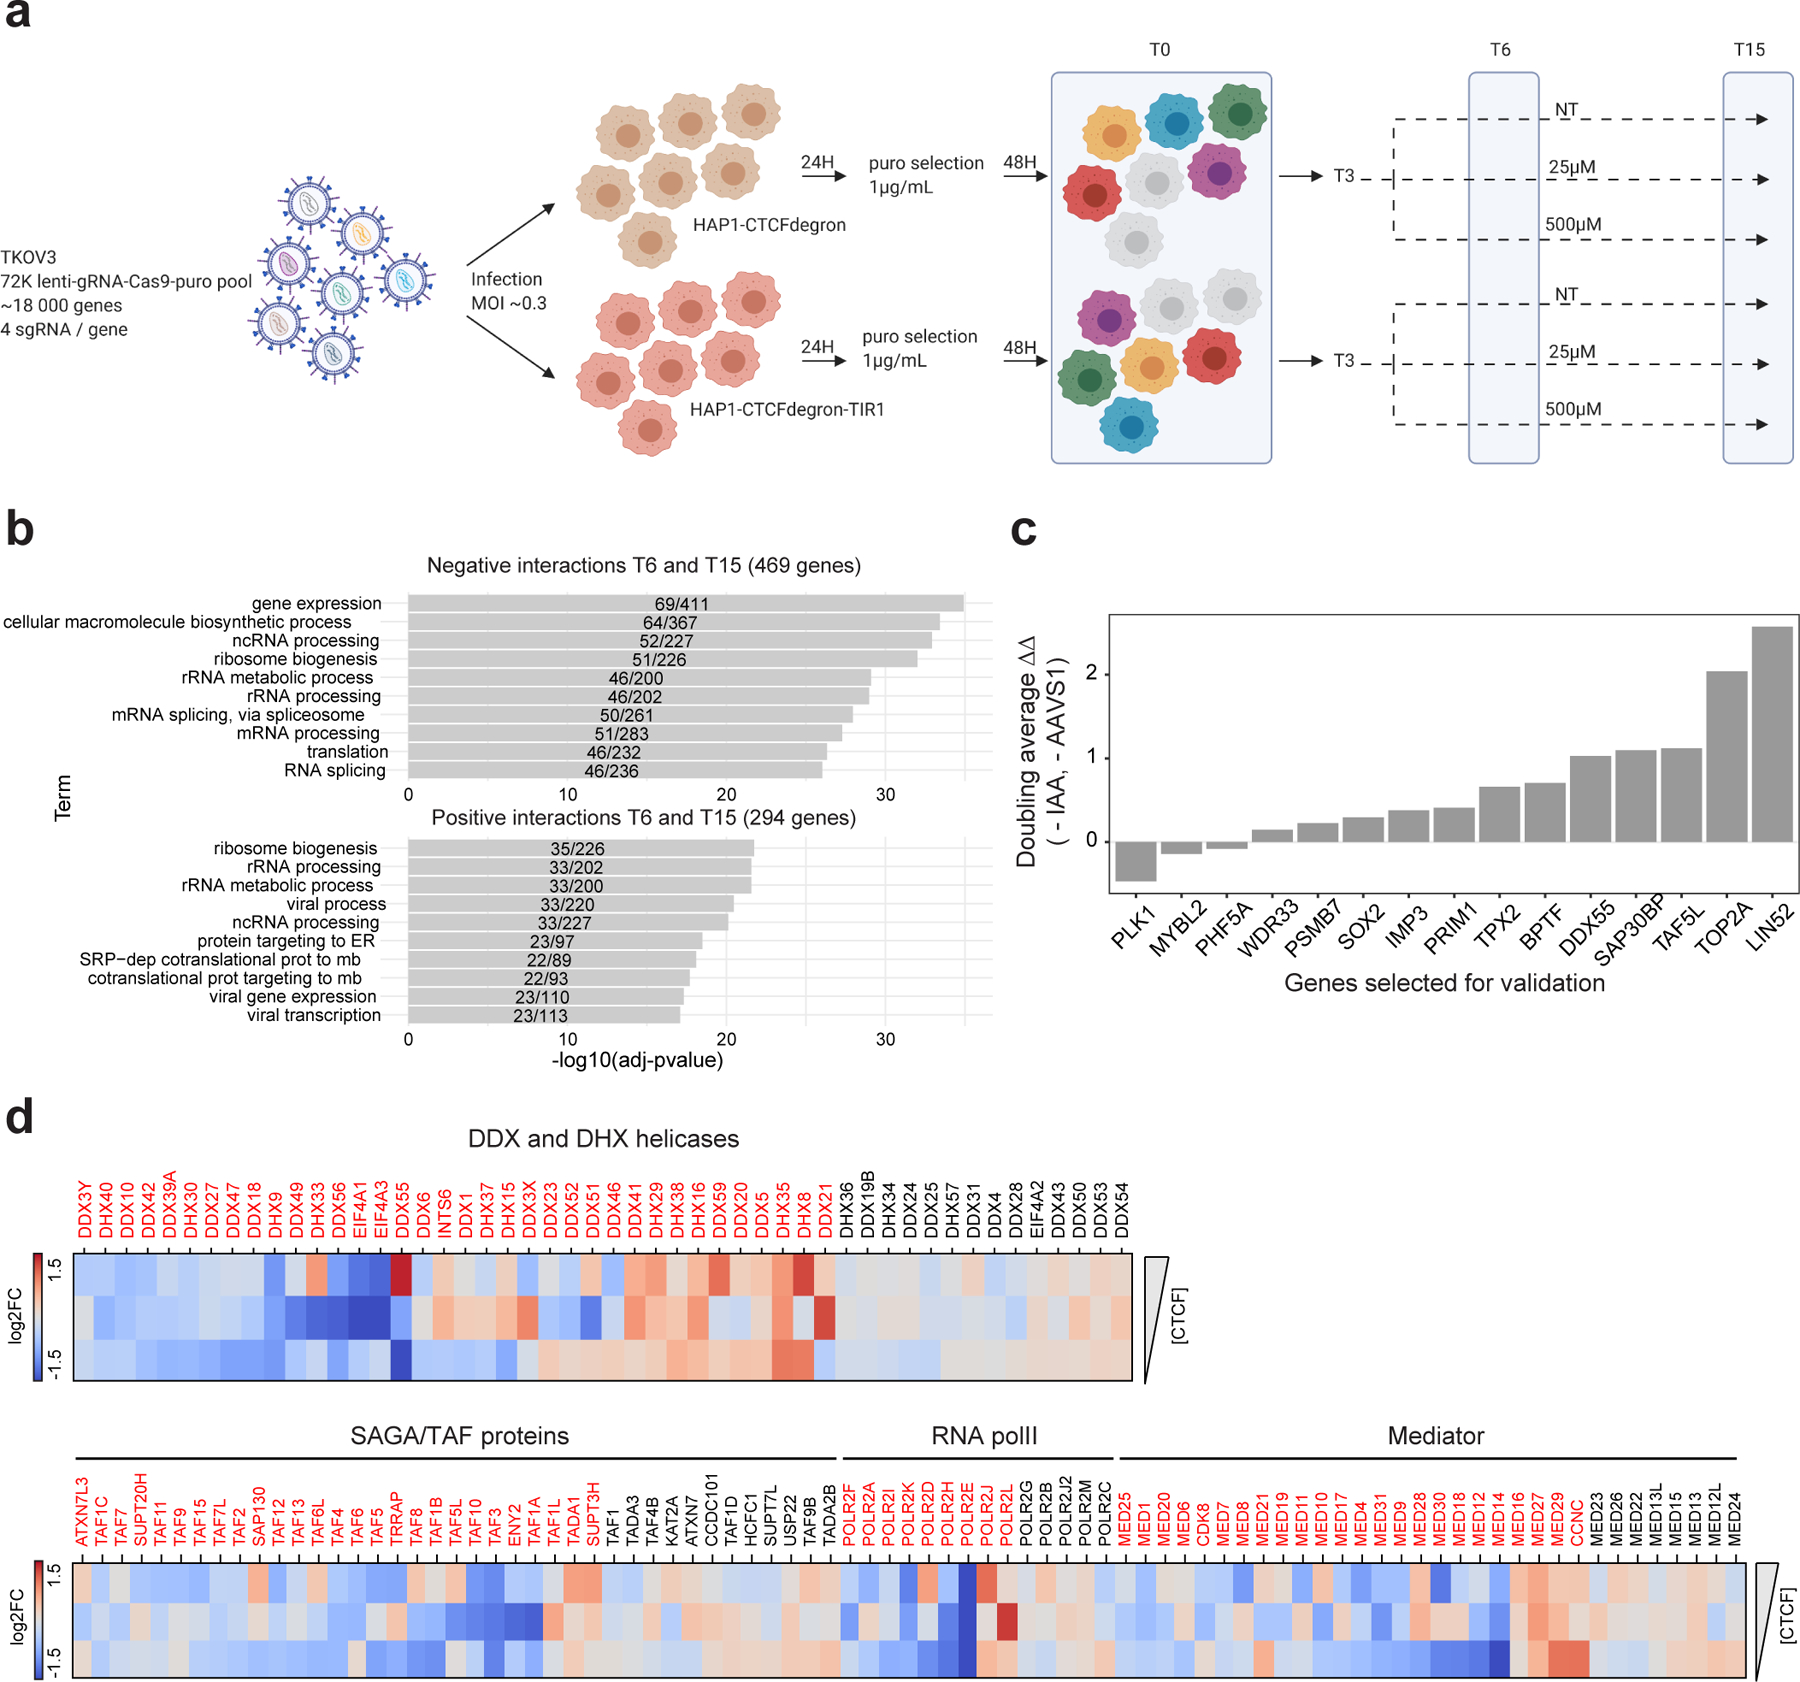
a, Schematic of the CRISPR screen workflow for the two cell lines HAP1-CTCFdegron (brown cells) and HAP1-CTCFdegron-TIR1 (red cells) with three auxin conditions (NT, 25µM and 500µM). Colored cells represent lentivirus infections and knock-outs with different sgRNAs. On the represented timepoints (T0, T6 and T15), cells were harvested for genomic DNA extraction, PCR amplification, library preparation and next-generation sequencing.
b, Functional enrichment analysis for negative and positive interactions identified in the screen.
c, Validation for a selection of genes from the gene hits. Cells with proliferation defects when CTCF and the gene hit are depleted have positive values (ΔΔ). Cells with better proliferation when CTCF and the gene hit are depleted have negative values (ΔΔ). The auxin concentration used was 25µM.
d, Heatmaps representing the log2 fold changes normalized by the HAP1-CTCFdegron (NT, 25µM or 500µM IAA) for DEAD/H-box family helicases, SAGA/TAF proteins, RNA polII subunits and mediator subunits with decreasing amount of CTCF (HAP1-CTCFdegron-TIR1 without auxin (NT) and with auxin (25µM and 500µM IAA)). Genes indicated in red have a log2 fold change of > |0.4|.
We identified a set of 469 genes whose loss reduced proliferation and a set of 294 genes whose loss increased proliferation upon CTCF depletion, including genes known to be involved in CTCF-related processes, like SMC1A, Topoisomerase II, BPTF and LIN52 (Extended Data Fig. 5d,e)37–43.
Gene Ontology (GO) analysis of our screen results showed enrichment for genes involved in gene expression and RNA processing (Fig. 4b). We selected 14 hits that decreased proliferation with a broad spectrum of functions for validation and included one hit that increased proliferation (PLK1). We knocked-out these genes using two sgRNAs from the screens and validated the reduced proliferation in CTCF-depleted cells for 10 of them, as well as faster proliferation for PLK1. Four hits did not validate in this assay (Fig. 4c).
Among the categories that were statistically significantly enriched, the family of DEAD/H-box helicase genes were of particular interest given that one of them (DDX5) had already been implicated in CTCF function44,45. Depletion of more than two thirds of the studied DEAD/H-box helicases in our screens displayed proliferation effects in cells expressing lower levels of CTCF (36/50) (Fig. 4d).
The screens also identified several genes involved in transcriptional regulation including subunits of the SAGA complex and TBP-associated factors (TAFs), RNA polymerase II and Mediator complexes (Fig. 4d)46. Mediator complexes have already been shown to be involved in cohesin-mediated interactions47–49.
DDX55 and TAF5L physically interact with CTCF and cohesin
The results of our genome-wide screens suggest that cells with altered cohesin traffic pattern are vulnerable to defects in machineries associated with RNA processing and transcription initiation. We selected two hits for further analysis: DDX55, a DEAD/H-box protein and TAF5L, a subunit of the SAGA complex.
To determine whether these proteins physically associate with CTCF and/or cohesin, we performed co-immunoprecipitations (co-IP). We found that DDX55 and TAF5L both interacted with CTCF and cohesin. This interaction was not DNA- or RNA-dependent (Fig. 5a, Extended Data Fig. 6a,d,e,f). Given that CTCF and cohesin interact with each other, we next wanted to determine whether DDX55 and TAF5L require CTCF to bind to cohesin. After CTCF depletion, we performed co-IP as above and found that DDX55 and TAF5L still interacted with the cohesin complex (Fig. 5a, Extended Data Fig. 6a,d,e,f). Additionally, we performed co-IP against TAF6L, another SAGA subunit and obtained similar results (Extended Data Fig. 6c–f). We also used the HCT116-RAD21-AID cell line to determine whether the interaction of DDX55 or TAF5L with CTCF was dependent on cohesin. We found that the interaction between DDX55, TAF5L and CTCF was not affected by degradation of RAD21. We conclude that DDX55 and TAF5L interact with cohesin and with CTCF independently (Fig. 5b, Extended Data Fig. 6b,d,e,f).
Figure 5: Altered cohesin traffic pattern following CTCF depletion reduces chromatin binding of DDX55 and TAF5L at active promoters/TSSs.
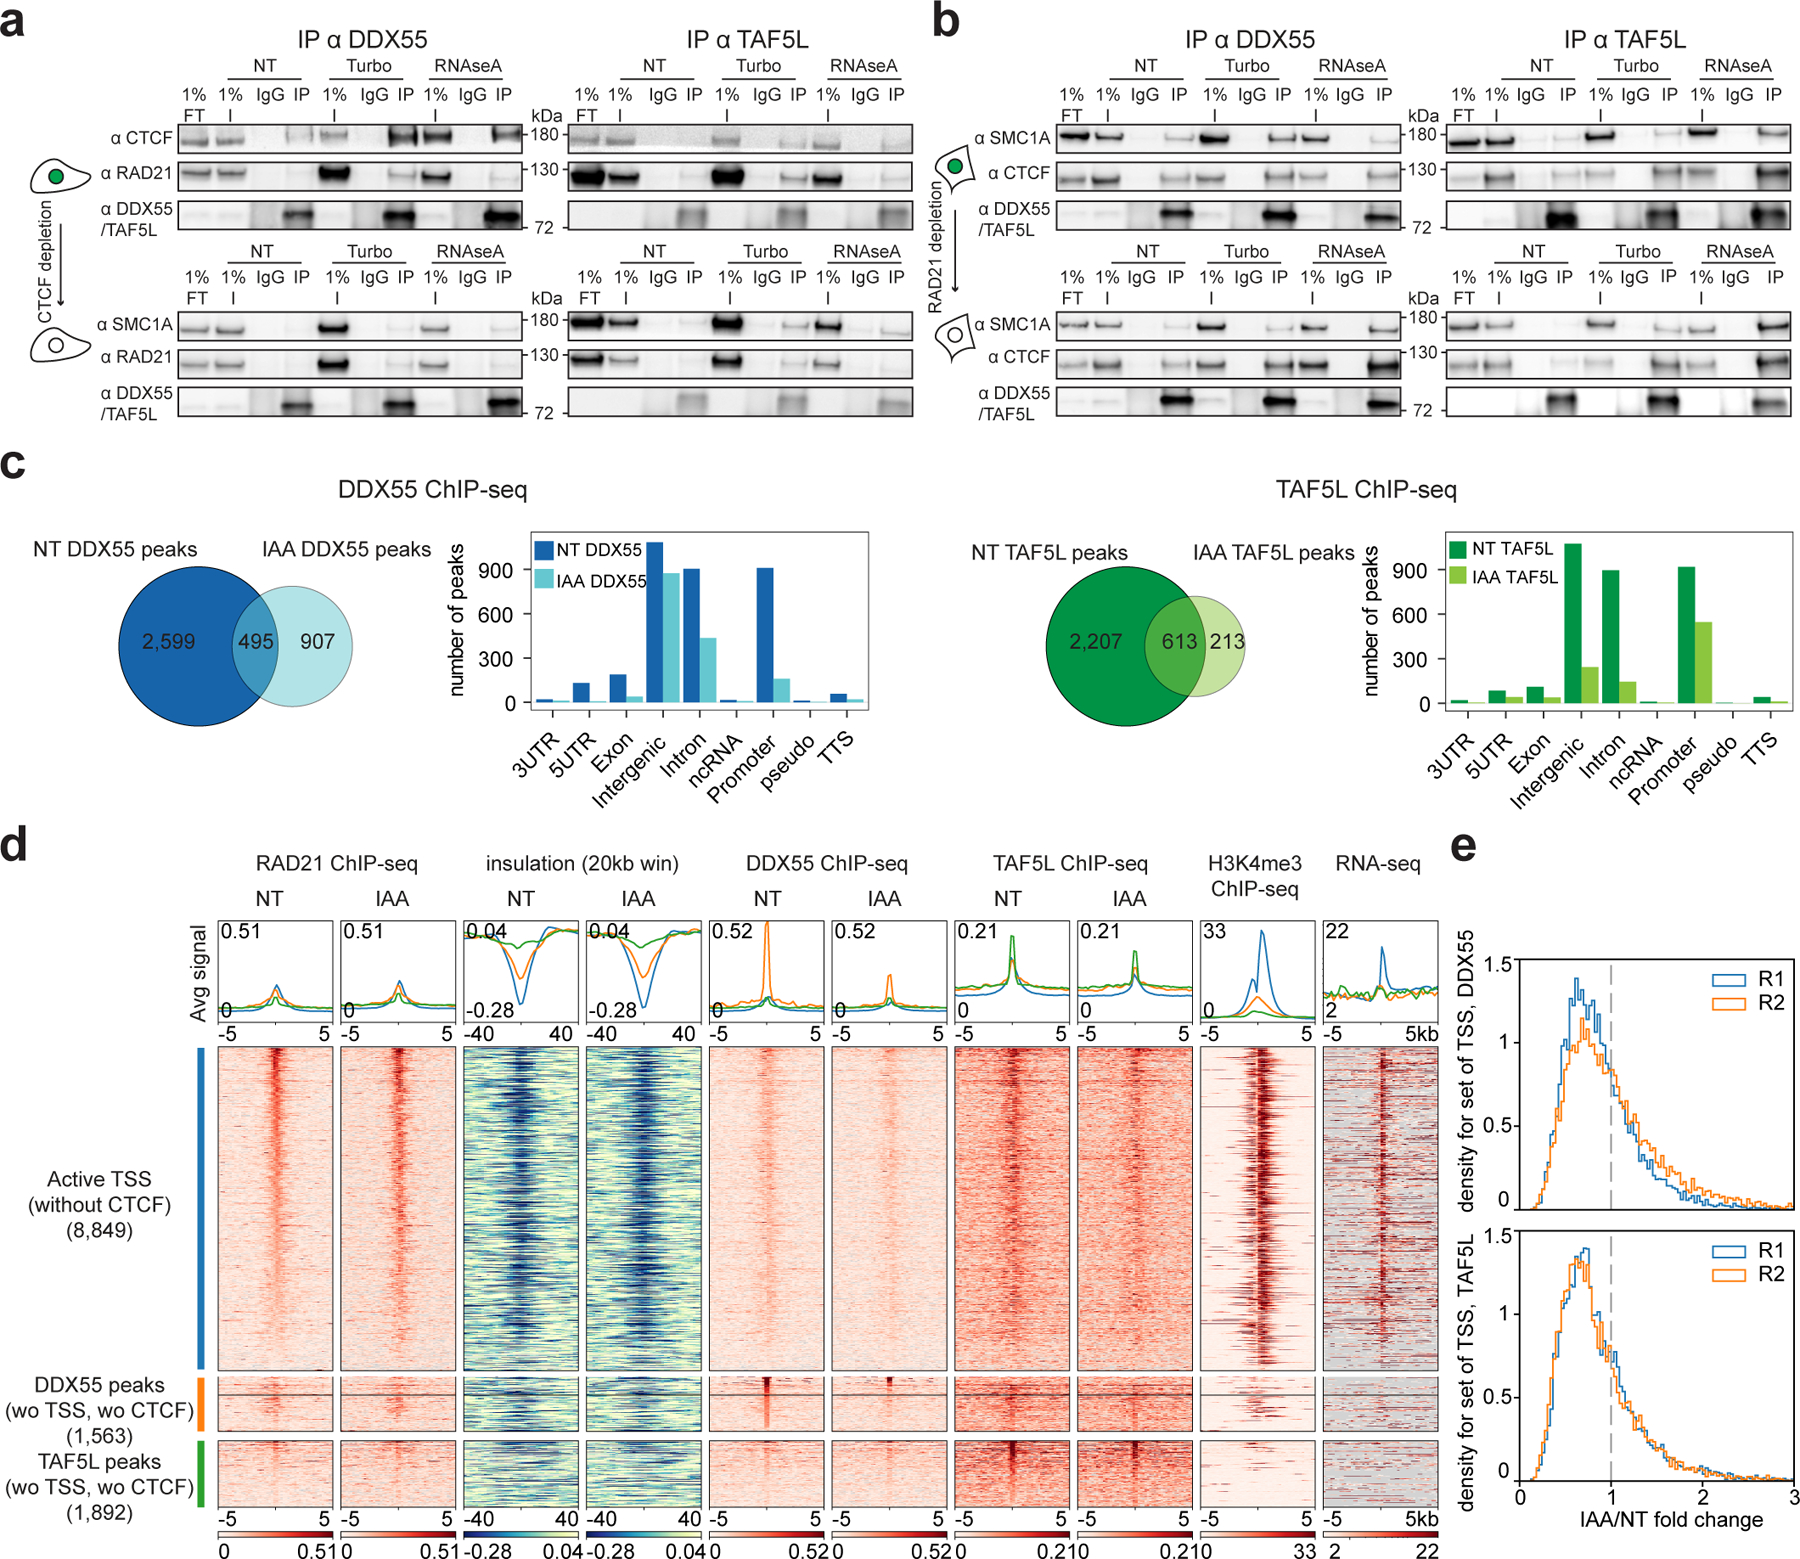
a, Western blot co-IPs against DDX55 and TAF5L in HAP1-CTCFdegron-TIR1 without/with auxin (NT and IAA), treated with either turbonuclease (DNA - and RNA -) or RNAseA (RNA -).
b, Western blot co-IPs against DDX55 and TAF5L in RAD21-AID degron without/with auxin (NT and IAA), treated with either turbonuclease (DNA - and RNA -) or RNAseA (RNA -).
c, Venn diagram for DDX55 (left) and TAF5L (right) ChIP-seq peaks called in HAP1-CTCFdegron-TIR1 cells without/with auxin (NT and IAA). Gene annotation bar plots of the ChIP-seq peaks called in HAP1-CTCFdegron-TIR1 without/with auxin (NT and IAA).
d, Stackups for active TSSs without CTCF (blue) sorted on Non-Treated (NT) RAD21 ChIP-seq signal, for DDX55 peaks (without TSSs, without CTCF) (orange) sorted on Non-Treated (NT) DDX55 ChIP-seq, and for TAF5L peaks (without TSSs, without CTCF) (green) sorted on Non-Treated (NT) TAF5L ChIP-seq. RAD21 ChIP-seq, calculated insulation, DDX55 ChIP-seq, TAF5L ChIP-seq and RNA seq signals in HAP1-CTCFdegron-TIR1 cells without/with auxin (NT and IAA) were plotted along with published HAP1 H3K4me3 ChIP-seq26 and oriented genes. For TSSs, genes were flipped according to their orientations to have the gene body on the right of the TSSs. Genes were not flipped for DDX55 and TAF5L peaks.
e, Stackup quantification for the active TSSs (without CTCF) for DDX55 and TAF5L ChIP-seq for two replicates. The distribution of the ratios (fold change) of a given signal between auxin-treated and non-treated conditions is shown. A fold change < 1 represents less binding of DDX55 or TAF5L at active TSSs after CTCF depletion.
Altered cohesin traffic affects protein chromatin binding
We next wanted to assess whether chromatin binding and localization of DDX55 and TAF5L were affected by CTCF depletion. We performed DDX55 and TAF5L ChIP-seq in HAP1-CTCFdegron-TIR1 cells (Extended Data Fig. 7a–c, 8a–c). We identified 3,094 DDX55 and 2,820 TAF5L peaks, mostly at TSSs, intron and intergenic regions, many of which decreased after CTCF depletion (Fig. 5c).
Next, we determined DDX55 and TAF5L levels at active TSSs and TTSs and at CTCF sites. We detected DDX55 and TAF5L at TSSs, but very little of either protein was observed at CTCF sites and none at TTSs. Visual inspection of the ChIP-seq data suggested that after CTCF depletion, the levels of DDX55 and TAF5L binding to TSSs and CTCF sites were reduced (Fig. 5d, Extended Data Fig. 6g, 7a–c, 8a–c). We quantified this observation by calculating the ratio of DDX55 or TAF5L levels at CTCF sites and TSSs between control cells and CTCF depleted cells (Fig. 5e, Extended Data Fig. 6h). We observed that this ratio was mostly below 1, for two independent ChIP-seq replicates, suggesting that DDX55 and TAF5L accumulation at CTCF sites and TSSs is CTCF-dependent. We noticed that the accumulation of DDX55 and TAF5L at sites that displayed DDX55 or TAF5L peaks but did not overlap with CTCF peaks or TSSs was also reduced after CTCF depletion (Fig. 5d).
DDX55 or TAF5L depletion modestly affects chromosome folding
We next asked whether DDX55 and TAF5L function in chromosome folding. We depleted the DDX55 and TAF5L proteins in HAP1-CTCFdegron-TIR1 cells in two ways by using a pool of siRNAs and generating knock-out clones with sgRNAs from the CRISPR screens (Extended Data Fig. 9a,b). We could only generate heterozygous knock-out clones for DDX55 because DDX55 is essential50 but succeeded in generating homozygous TAF5L knock-out clones (clones). DDX55 and TAF5L depletions with siRNA or in clones did not affect the cell cycle (Extended Data Fig. 9c). We noticed that depleting DDX55 and TAF5L did not affect gene expression for most of the components of the loop extrusion machinery, however the DDX55 and TAF5L clones showed CTCF misregulation (Extended Data Fig. 9b). We then performed Hi-C on the DDX55 and TAF5L depleted cell lines in the presence or absence of CTCF. Depletion of DDX55 or TAF5L had only minor global effects on Hi-C data (Fig. 6a, Extended Data Fig. 10a,b). To examine effects on local chromatin conformation, we plotted aggregated interactions and average insulation profiles across distal CTCF sites and active and inactive genes (Fig. 6b). Insulation at CTCF sites, active TSSs or TTSs did not require DDX55 or TAF5L. When CTCF was co-depleted with DDX55 or TAF5L, insulation at CTCF sites was lost as expected, while insulation at TSSs and TTSs was largely unaffected. Similar to what we observed in cells expressing normal levels of DDX55 and TAF5L, CTCF depletion decreased intragenic interactions (Fig. 2b). Therefore, the effects of CTCF depletion on intragenic interaction frequencies were independent of DDX55 and TAF5L levels. Interestingly, depletion of DDX55 and TAF5L changed the conformation of active genes. Intragenic interactions increased similar to what we observed in WAPL depleted cells (Fig. 2b). DDX55 or TAF5L depletions in the absence of CTCF resulted in increased intragenic interactions, alike what is observed in the presence of CTCF, suggesting that the effect of DDX55 or TAF5L depletion on intragenic interactions were independent of CTCF levels. We conclude that DDX55 and TAF5L are not required for chromatin domain boundary formation but that CTCF, DDX55 and TAF5L independently influence the conformation of active genes.
Figure 6: DDX55 and TAF5L depletions alter conformation of active genes independently of CTCF.
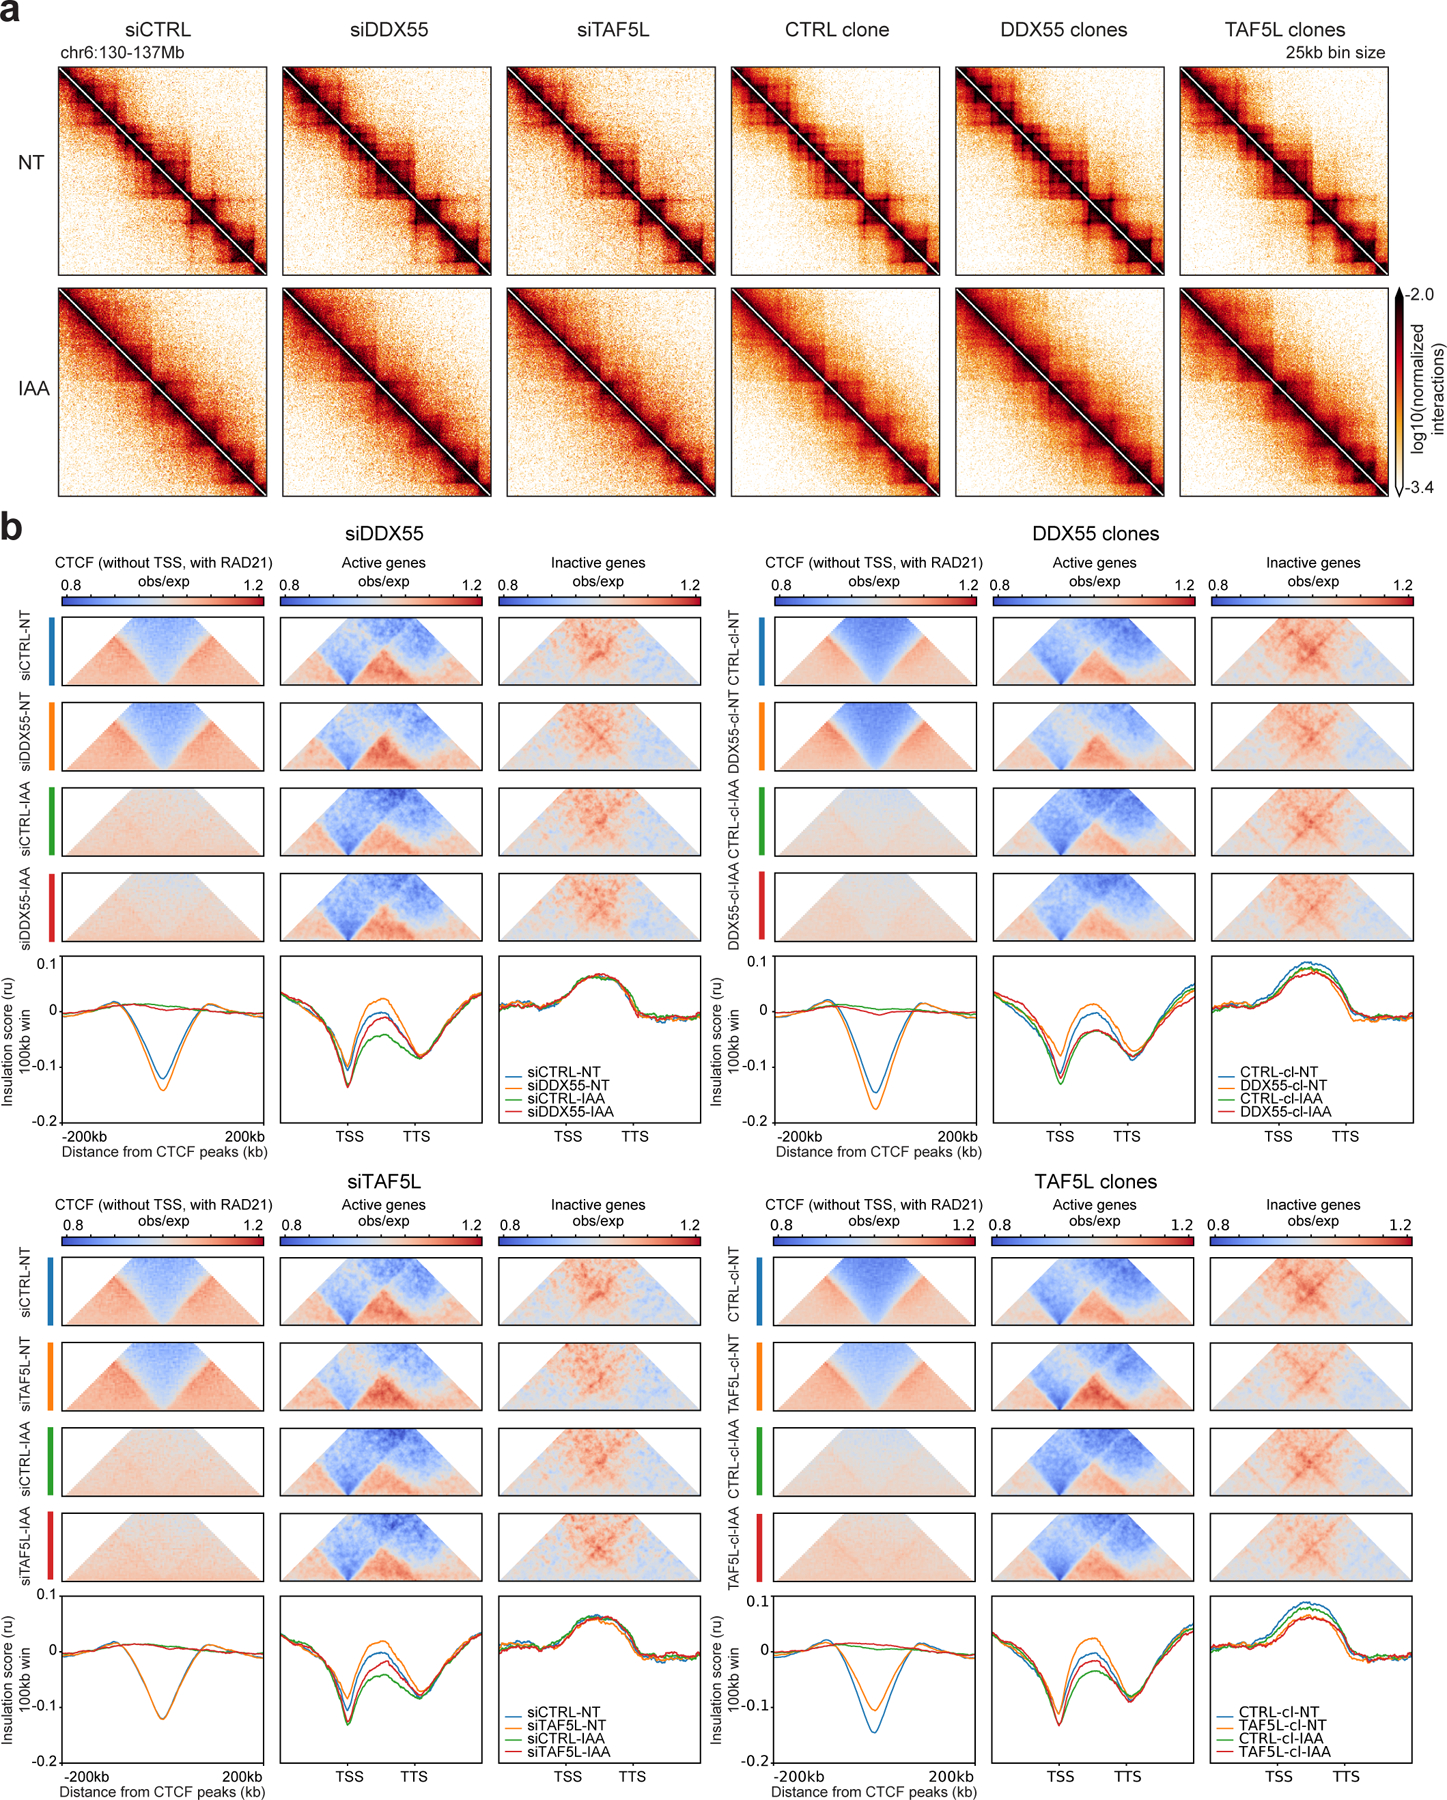
a, Hi-C contact heatmaps at 25kb resolution for a 7Mb region on chromosome 6 for HAP1-CTCFdegron-TIR1 cells depleted for DDX55 or TAF5L (siRNA and knock-out clones) without/with CTCF (NT and IAA).
b, Average insulation profiles across distal CTCF (without TSSs, with RAD21) (left plots), across scaled active genes (without CTCF at TSSs and TTSs) (middle plots) and across scaled inactive genes (without CTCF at TSSs and TTSs) (right plots) for the HAP1-CTCFdegron-TIR1 without/with auxin (NT and IAA) and with DDX55 or TAF5L depleted (siRNA and knock-out clones) at 5kb resolution. The representative scaled interaction pileups are plotted on top of the average insulation profiles.
CTCF, DDX55 and TAF5L depletion and gene expression
Finally, we assessed global gene expression after CTCF, DDX55 and TAF5L depletions by RNA-seq. Confirming previous results, CTCF depletion did not result in massive changes in gene expression (~1,300 differentially expressed genes; Extended Data Fig. 10c)8,23. However, the number of differentially expressed genes increased with the extent of CTCF depletion. DDX55 and TAF5L depletions modestly affected the number of differentially expressed genes. However, the double depletions of CTCF and DDX55 or TAF5L resulted in synergistic effects with more changes in gene expression (~600 genes; Extended Data Fig. 10c). Depleting CTCF, DDX55 or TAF5L also resulted in differential splicing of a gene set that was different from the gene set that were differentially expressed. The number of differentially spliced genes slightly increased with the double depletions (Extended Data Fig. 10d).
DISCUSSION
Through analysis of Hi-C data obtained with cells where CTCF, RAD21, WAPL or RNA polII were rapidly depleted, we describe a complex pattern of cohesin traffic defined by different types of cis-elements where cohesin is loaded, paused, blocked or unloaded. Cohesin may be loaded at sites distal from promoters (possibly enhancers51), weakly paused or blocked at active TSSs, efficiently blocked and stalled at CTCF sites and stalled and rapidly unloaded at active TTSs (Fig. 2c). Our genome-wide genetic interaction screens in cells, with altered extrusion patterns as a result of CTCF depletion, identified genes involved in transcription initiation and RNA processing. Based on these findings, we hypothesize that the cohesin traffic pattern is functionally linked to gene control.
Three types of boundaries define a cohesin traffic pattern
We describe and characterize three distinct types of domain boundaries: CTCF sites and active TSSs (previously described by Bonev and co-workers27) and TTSs. Each of the three elements differ in the mechanism by which they drive boundary formation.
Active TSSs display relatively strong, but highly localized insulation that is quantitatively comparable to the observed insulation at CTCF-bound sites. However, while rapid depletion of RAD21 leads to near complete loss of insulation at CTCF-bound sites, insulation at TSSs is hardly affected. Insulation at active TSSs might result from a very small amount of RAD21 binding. Alternatively, insulation at active TSSs may be truly cohesin independent: it may be driven by other loop extrusion factors or result from entirely different mechanisms, e.g., specific local chromatin features that can induce chromatin domain boundary formation via yet to be established processes.
At active TTSs, insulation is not affected by CTCF depletion and is quantitatively distinct from that observed at CTCF sites and TSSs: it is weaker and forms a broad zone of insulation. Intriguingly, we did not detect RAD21 at active TTSs by ChIP-seq, but insulation at TTSs is lost when RAD21 is depleted. Previous studies had shown that upon CTCF and WAPL depletions, cohesin accumulates at 3’ ends of active genes, especially at sites of convergent transcription11. Moreover, insulation at active TTSs is not affected by WAPL depletion. We conclude from these observations that active TTSs are sites where, in normal cells, cohesin is first blocked, leading to boundary formation and insulation, and then is unloaded by WAPL. The lack of RAD21 can be explained if unloading is fast and efficient. Insulation at active TTSs is partly dependent on RNA polII: depleting RNA polII results in weaker insulation at active TTSs. One hypothesis is that depletion of RNA polII may destabilize R-loops which could induce local chromatin changes around TTSs resulting in less stalling of cohesin at active TTSs, thus reducing insulation. Indeed, Busslinger and co-workers found that blocking transcription elongation using DRB in CTCF WAPL double knock-out cells results in less accumulation of cohesin at TTSs11. An alternative hypothesis is that cohesin is pushed through the gene by RNA polII towards the TTS where it is first blocked and then rapidly unloaded. In support of this model, previous studies have shown that condensin and RNA polII can interplay and that in yeast cohesin could be pushed by the transcription machinery52–54. A role for RNA polII in cohesin positioning along active genes has also been proposed by Banigan and co-workers55.
Enhancer-promoter interactions are directed by CTCF site orientation in a way that suggests that cohesin could be loaded at enhancers and extrude towards the promoter. This complex and dynamic cohesin traffic pattern may be important for appropriate gene regulation, e.g., through recruiting and then delivering transcription related complexes to target genes. A similar model for cohesin dynamics has been proposed by Liu and co-workers based on analysis of cells where either WAPL or RAD21 are depleted56.
Possible functions for the cohesin traffic pattern
Through a genetic interaction screen, we identified factors that, upon deletion, changed the growth rate of cells only when CTCF levels were low and cohesin positioning along chromosomes was altered. We identified several classes of genes involved in RNA metabolism. Among these were many DEAD/H-box containing RNA helicases57. In previous studies, the DEAD/H-box helicase DDX5 and its associated RNA activator RSA were found to interact with CTCF and cohesin and to be required for insulator function, possibly by reducing cohesin localization at CTCF sites45. In Drosophila, the DDX5 orthologue Rm62 plays a role in modulating the activity of the insulator binding factor CP19044. We also identified a set of proteins that function in transcription initiation, including TAFs, that are part of the SAGA, TFIID, and RNA polII complexes. A previous study had shown that TAF3, which is part of the core promoter recognition complex TFIID, is recruited by CTCF to promoters and mediates looping interaction between promoter and TSS58.
We focused on DDX55 and TAF5L for further analysis but found that they do not appear to play a major role in chromatin folding. Therefore, their function may depend on correctly folded chromatin without playing a direct role in chromosome organization themselves. Interestingly, we found that CTCF depletion leads to reduced accumulation of DDX55 and TAF5L at both CTCF-bound and active TSSs. This observation points to an indirect role for CTCF in recruiting and positioning these factors and possibly other transcription related complexes to distal active genes most likely through cohesin-mediated mechanisms. DDX55 and TAF5L may be recruited to distal CTCF sites and then transported to TSSs through cohesin action. Consistent with this model, we found that DDX55 and TAF5L physically interact with both CTCF and cohesin.
Depletion of DDX55 or TAF5L, in the presence or absence of CTCF, did not result in major changes in gene expression and splicing, consistent with previous findings8,12,23,59–64. This may be due to redundancy with other related complexes. Alternatively, acute depletion of factors that mediate enhancer-driven activation may not have a noticeable effect on transcription until many hours, or even cell cycles later as recent analyses suggests that the transcriptional state of a TSS can be relatively long-lived65,66.
In summary, our work delineates roles for CTCF, cohesin, WAPL and RNA polII in defining a cohesin traffic pattern constrained by different types of domain boundaries at key cis-elements. Defects in setting up this cohesin traffic pattern correctly make cells sensitive to loss of factors involved in RNA metabolism. We propose that the complex pattern of cohesin movement along chromatin, and the roles of CTCF, WAPL and RNA polII in defining this pattern, contributes to appropriate localization of transcription and RNA processing factors to active genes. How these phenomena control gene expression remains an open question.
METHODS
Cell culture and cell lines
Human HAP1 cell line was purchased from Horizon Discovery (C859). The wild-type and mutated HAP1 cell lines (HAP1-CTCFdegron, HAP1-CTCFdegron-TIR1, HAP1-RPB1-AID, DDX55 and TAF5L knock-out clones) were cultured at 37°C with 5% CO2 in IMDM GlutaMAX™ Supplement (Gibco, 31980097) with 10% FBS (Gibco, 16000069), 1% Penicillin-Streptomycin (Gibco, 15140122).
HCT116-RAD21-AID cells were a gift from Masato Kanemaki30. They were cultured at 37°C with 5% CO2 in McCoy’s 5A medium GlutaMAX™ Supplement (Gibco, 36600021) with 10% FBS (Gibco, 16000069), 1% Penicillin-Streptomycin (Gibco, 15140122).
HEK293T cell line was obtained from ATCC (CRL-3216) and maintained in DMEM (Gibco, 11995065) with 10% FBS (Gibco, 16000069), 1% penicillin–streptomycin (Gibco, 15140122).
Cell lines were routinely tested for mycoplasma infection and tested negative (MycoAlertTM Mycoplasma Detection Kit, Lonza).
Antibiotic selection treatment
Blasticidin S HCl (10mg/mL) was ordered from ThermoFisher (A1113903). Selection was done with 10µg/mL blasticidin.
Puromycin Dihydrochloride (10mg/mL) was ordered from ThermoFisher (A1113803). Selection was done with 1.5µg/mL puromycin.
Hygromycin B Gold (100mg/mL) was ordered from Invivogen (ant-hg-1). Selection was done with 450µg/mL hygromycin.
Auxin (IAA) treatment
Auxin (IAA, 3-Indoleacetic acid) was purchased from Millipore Sigma (45533-250MG) and dissolved in ethanol. Auxin was directly added to the cell culture plates at the indicated concentrations (25µM for partial CTCF depletion or 500µM for total CTCF, RPB1 and RAD21 depletions) and times (HAP1-CTCFdegron and HAP1-CTCFdegron-TIR1: 48H for the asynchronous cells, HAP1-RPB1-AID: 4H, HCT116-RAD21-AID: 2H).
siRNA transfections
Pools of siRNAs were ordered from Dharmacon (siGENOME Non-Targeting siRNA Pool #2, SMARTpool: siGENOME DDX55 siRNAl and siGENOME TAF5L siRNA). siRNAs were resuspended in sterile ultra-pure water. Transfections were done with lipofectamine (Lipofectamine™ RNAiMAX Transfection Reagent, Thermofisher Scientific, 13778075) and Opti-MEM (Thermofisher Scientific, 31985062) following the manufacturer’s recommendations. Final concentration of siRNA used was 40nM and incubation time with siRNAs was 72 hours. If auxin was added, media was removed after 24 hours and replaced by auxin containing media for the remaining 48 hours.
Plasmid construction
Each plasmid was analyzed by Sanger sequencing to confirm successful cloning.
guide RNA cloning (sgRNA)
sgRNAs were cloned in pSpCas9(BB)-2A-Puro (PX459) V2.0 (Feng Zhang laboratory, Addgene 62988). Briefly, the pX459 plasmid was digested with BbsI, the sgRNA primers were phosphorylated, annealed and ligated into the BbsI linearized backbone following the Feng Zhang laboratory protocol69.
Endogenous CTCF knock-out targeting constructs
To knock-out the endogenous CTCF, sgRNAs targeting the promoter and the 3’ UTR of the endogenous CTCF gene were cloned (~79kb deletion).
CTCF cDNA construct: HA-AID-CTCFcDNA-AID-eGFP-blasticidin
The HA-AID-CTCFcDNA-AID-eGFP-blasticidin vector was assembled by Gibson Assembly (NEBuilder HiFi DNA Assembly Master Mix, NEB, E2621L) in the pENTR221 kanamycin vector using the following templates: the CAGGS promoter (which contains the cytomegalovirus (CMV) early enhancer element, the promoter region, the first exon, and the first intron of chicken β-ACTIN gene, and the splice acceptor of the rabbit β-GLOBIN gene) was amplified from pEN396-pCAGGS-TIR1-V5-2A-PuroR (gift of Elphege Nora, Benoit Bruneau, addgene 92142), the minimal functional AID tag (aa 71-114) was amplified with forward primer containing HA tag from pEN244-CTCF-AID[71-114]-eGFP-FRT-Blast-FRT (gift of Elphege Nora, Benoit Bruneau, addgene 92140), the CTCF cDNA was amplified from a pCMV6-Entry vector containing CTCF cDNA (Origene, RC202416), the AID-eGFP-2A-bls was amplified from pEN244-CTCF-AID[71-114]-eGFP-FRT-Blast-FRT (gift of Elphege Nora, Benoit Bruneau, addgene 92140), the polyA signal was amplified from pEN396-pCAGGS-TIR1-V5-2A-PuroR (gift of Elphege Nora, Benoit Bruneau, addgene 92142). Amplifications were performed with the Q5 High-Fidelity DNA Polymerase (NEB, M0491L).
TIR1-hygro construct
The TIR1-hygro vector was assembled by Gibson Assembly (NEBuilder HiFi DNA Assembly Master Mix, NEB, E2621L) replacing puromycin gene by hygromycin gene in the pEN396-pCAGGS-TIR1-V5-2A-PuroR (gift of Elphege Nora, Benoit Bruneau, addgene 92142).
Endogenous RPB1 targeting constructs
C-terminal
To target the C-terminal part of RPB1, sgRNA targeting the last exon of RPB1 gene was cloned.
N-terminal
To target the N-terminal part of RPB1, sgRNA targeting the first exon, around the start codon of RPB1 gene was cloned.
AID C-terminal RPB1-AID-eGFP-blasticidin construct
The AID C-terminal RPB1-AID-eGFP-blasticidin vector was assembled by Gibson Assembly (NEBuilder HiFi DNA Assembly Master Mix, NEB, E2621L) in the pENTR221 kanamycin vector using the following templates: the 5’ homology arm (1,680bp) and 3’ homology arm (1,558bp) were amplified from HAP1 genomic DNA, the minimal functional AID tag (aa 71-114)-eGFP was amplified from pEN244-CTCF-AID[71-114]-eGFP-FRT-Blast-FRT (gift of Elphege Nora, Benoit Bruneau, addgene 92140), the T2A was amplified from pEN396-pCAGGS-TIR1-V5-2A-PuroR (gift of Elphege Nora, Benoit Bruneau, addgene 92142), the blasticidin resistance gene was amplified from PSF-CMV-BLAST (Sigma-Aldrich, OGS588-5UG). Amplifications were performed with the Q5 High-Fidelity DNA Polymerase (NEB, M0491L).
AID N-terminal AID-RPB1 construct
The AID N-terminal AID-RPB1 vector was assembled by Gibson Assembly (NEBuilder HiFi DNA Assembly Master Mix, NEB, E2621L) in the pENTR221 kanamycin vector using the following templates: the 5’ homology arm (1,079bp) and 3’ homology arm (1,077bp) were amplified from HAP1 genomic DNA and the minimal functional AID tag (aa 71-114)-eGFP was amplified from pEN244-CTCF-AID[71-114]-eGFP-FRT-Blast-FRT (gift of Elphege Nora, Benoit Bruneau, addgene 92140).
AAVS1 (control locus), DDX55 and TAF5L knock-out constructs
To create deletions in the AAVS1 locus, primers were designed in the AAVS1 locus. To create DDX55 knock-out, the sgRNAs used in the genome wide CRISPR screens and targeting the second exon of DDX55 gene were cloned. To create TAF5L knock-out, the sgRNAs used in the genome wide CRISPR screens and targeting the third exon of TAF5L gene were cloned.
Genome modifications
Plasmids used for transfections were purified using ZymoPURE II Plasmid Midiprep Kit (Zymo Research, D4201). Plasmids were linearized using PvuI-HF (NEB, R3150L). Linearized plasmids were further purified with phenol chloroform extraction and ethanol precipitation. HAP1 cells were transfected using turbofectin (Origene, TF81001) following the manufacturer’s recommendations.
The differences between the different construct transfections are described below:
HAP1-CTCFdegron-TIR1
1.5µg of linearized HA-AID-CTCFcDNA-AID-eGFP-blasticidin vector was transfected. 24 hours after the transfection, blasticidin (10µg/mL) containing media was added and resistant cells were selected for 48 hours. A second transfection was then performed using 2µg of four sgRNA-CRISPR-vectors (4*0.5µg) on the pool of blasticidin resistant cells to knock-out the endogenous CTCF. After 24 hours, puromycin (1.5µg/mL) containing media was added and resistant cells were selected for 48 hours. Serial dilutions were then done on 96-well plates without antibiotic selection to generate single cell clones. To test for integration of HA-AID-CTCFcDNA-AID-eGFP-blasticidin and effective CTCF knock-out, cells from individual clones were trypsinized, half was left in the 96-well plate and the other half was used for genomic DNA extraction. Clones that harbored the endogenous CTCF knock-out and the integration of the HA-AID-CTCFcDNA-AID-eGFP-blasticidin construct were sequenced. Clone (referred to as HAP1-CTCFdegron in our study) with the correct sequence was used for TIR1 integration. This clone is diploid. 2µg of linearized TIR1-hygro vectors were then transfected into the HAP1-CTCFdegron clone. After 24 hours, hygromycin (450µg/mL) containing media was added and resistant cells were selected for 48 hours. Serial dilutions were then done on 96-well plates without antibiotic selection to generate single cell clones. Clones were then PCR tested and sequenced for correct TIR1 integration on single clones. The diploid clone used in this study is referred to as HAP1-CTCFdegron-TIR1.
HAP1-RPB1-AID
1.5µg of linearized RPB1-AID-eGFP-blasticidin vector and 1.5µg of C-terminal RPB1 sgRNA were transfected into HAP1 cells. 24 hours after the transfection, puromycin (1.5µg/mL) containing media was added and resistant cells were selected for 48 hours. Puromycin media was then washed, and cells were grown for 48 hours without antibiotics. Blasticidin resistant cells were selected by adding blasticidin (10µg/mL) containing media for 7 days. The pool of blasticidin resistant cells was then transfected with 2µg of linearized TIR1-hygro vector. After 24 hours, serial dilution of cells to select single cell clones were performed in hygromycin (450µg/mL) containing media. Clones were tested by PCR and sequenced for correct AID-eGFP and TIR1 integrations on single clones. HAP1-RPB1-AID cells are diploid.
AAVS1, DDX55 and TAF5L knock-outs
2µg of sgRNAs targeting the AAVS1, DDX55 and TAF5L loci were transfected into HAP1 cells. 24 hours after the transfection, puromycin (1µg/mL) containing media was added and resistant cells were selected for 48 hours. Serial dilutions of cells in media without selection were then done to select single cell clones. Clones were tested by PCR and sequenced for indels on both alleles. AAVS1 clone (control) harbors a 23bp deletion on both alleles. DDX55 clone 1 harbors one allele with a 3bp deletion, deleting two amino acids (I and P) and replacing it by another one (T). The second allele has a 4bp deletion creating a frameshift and premature stop codon in exon 3. DDX55 clone 2 harbors one allele with a 6bp deletion, deleting three amino acids (PLF) and replacing it by another one (L). The second allele has a 12bp deletion deleting 4 amino acids (ATIP). The amount of mutated DDX55 protein is reduced in both clones. TAF5L clone 1 is homozygous with a 7bp deletion in the third exon of the TAF5L gene, creating a premature stop codon. TAF5L clone 2 is homozygous with a 13bp deletion creating a premature stop codon. These TAF5L knock-out clones do not express the TAF5L protein.
Genomic DNA extraction for PCR to test clones
Cells were spun, resuspended in 30µL of SB buffer (10mM Tris pH 8.0, 25mM NaCl, 1mM EDTA, 200µg/ml Proteinase K), incubated 1 hour at 65°C and 10 minutes at 95°C, spun and 1µL of the supernatant was used for PCR.
CRISPR screen validation
Validation was performed on 16 genes, with 2 different sgRNAs targeting the gene of interest on HAP1-CTCFdegron-TIR1 cells.
2µg of targeting sgRNA plasmids were transfected (separately for the sgRNA targeting the same gene) using turbofectin (Origene, TF81001) following the manufacturer’s recommendations. After 24 hours, puromycin (1.5µg/mL) containing media was added to select cells that integrated the plasmids. After 48 hours, cells were counted and timepoint considered as T0. Passaging was then performed following the scheme used in the genome-wide CRISPR screen. Three days later (T3), cells were counted, and re-seeded into three conditions (NT and 25µM auxin) in duplicates in 24-well plates. Cells were counted and re-seeded for the three conditions every three days until reaching T15. Cumulative growth curves were plotted with the number of counted cells. We calculated the doubling average ΔΔ, by first calculating the cumulative doubling averages per gene (two sgRNAs per gene) for each time point. Then, we subtracted the cumulative doubling of the auxin treated from the non-treated (NT - IAA) per gene for each time point. Subsequently, we subtracted the control value (AAVS1) per gene for each time point. Finally, we calculated the mean of all time points for each experiment replicate. A positive ΔΔ value indicates a growth defect when the gene is knocked out and CTCF is depleted. A negative ΔΔ value indicates a better proliferation when the gene is knocked out and CTCF is depleted. To confirm that indels occurred, cells were harvested at T15 and genomic DNA extraction was performed. PCR was then done on the extracted gDNA from cells that went through the transfections (mutated amplicon) and for cells that were not transfected (Wild-type amplicon). PCR products were purified using GFX PCR DNA and Gel Band Purification Kit (Cytiva, 28903470) and sent for Sanger sequencing. Synthego (https://www.synthego.com/products/bioinformatics/crispr-analysis, was then used to assess the percentage of the different modified alleles in the targeted genes using the wild-type amplicons as controls70.
Flow cytometry
Cells were dissociated with accutase (ThermoFisher Scientific, A11105-01), resuspended in PBS, spun, and resuspended in 250µL of cold PBS. To assess the cell cycle profile (DNA content), 750µL of 100% ethanol was slowly added to fix cells in 75% ethanol. Cells were stored in −20°C for at least 24 hours. Fixed cells were spun, re-suspended in 1X PBS with propidium iodide (PI) (final concentration 50µg/mL) and RNAseA (0.5mg/mL) and incubated for 30 minutes at room temperature protected from light. To assess GFP content, cells were washed once with PBS and fixed with 4% PFA for 10 minutes. Cells were spun and cell pellets were resuspended in 1mL of PBS. Cells were sorted on a FACSCALIBUR or LSRII or MACSQUANT. Analysis was performed using the Flowjo software v10. The gating strategy is outlined in Supplementary Fig. 1.
Western blots
Cells were dissociated with accutase (ThermoFisher Scientific, A11105-01), resuspended in PBS, spun, washed with PBS, spun again and kept at −20°C. At least 1M cells were resuspended in 100µL of RIPA buffer (ThermoFisher Scientific, 89900) for 30 minutes on ice to lyse the cells. Lysates were spun for 30 minutes at 4°C and the supernatants containing the soluble proteins were harvested. Protein concentration was calculated using a Pierce™ BCA Protein Assay Kit (ThermoFisher Scientific, 23227). 20µg of protein was loaded per lane. Samples were mixed with Pierce™ Lane Marker Reducing Sample Buffer (ThermoFisher Scientific, 39000) and run on a NuPAGE™ 3–8% Tris-Acetate Protein Gel with NuPAGE™ Tris-Acetate SDS Running Buffer (ThermoFisher Scientific, LA0041) in a XCell SureLock™ Mini-Cell (ThermoFisher Scientific, EI0001). Transfer onto a Nitrocellulose Membrane, 0.2µm (BioRad, 1620112) was performed using the XCell SureLock™ Mini-Cell (ThermoFisher Scientific, EI0001) in Pierce™ 10X Western Blot Transfer Buffer, Methanol-free (ThermoFisher Scientific, 35045) for 2 hours at 30V. Membranes were blocked for 2 hours at room temperature with 5% milk in TBST prior to antibody incubation overnight at 4°C (see Supplementary Table 6 for antibodies used). Antibodies were added in 5% milk with TBST. Membranes were washed 6 times 10 minutes in TBST at room temperature, incubated with HRP secondary antibodies (Cell signaling, 7074) 1:1000 in 5% milk with TBST for 2 hours at room temperature, washed 6 times 10 minutes with TBST at room temperature, revealed with SuperSignal™ West Dura Extended Duration Substrate (ThermoFisher Scientific, 34076) and analyzed on Biorad ChemiDoc system with Image Lab 6.0.1 builder 34.
Co-Immunoprecipitation (co-IP)
Co-IP protocol was adapted from71. Cells were grown on 15cm plates, washed with dPBS and harvested with accutase. For each co-IP about 30M cells were used. Each pellet was resuspended in 1mL of low salt lysis buffer (5mM PIPES pH 8.0, 85mM KCl, 0.5% NP-40 and 1X HALT protease inhibitor) and incubated on ice for 10 minutes. Nuclei were pelleted for 10 minutes, 1,500g at 4°C and resuspended in 1mL of low salt lysis buffer. Each set of co-IP had 3 samples (non-treated, turbonuclease and RNAseA). The turbonuclease samples were treated with 1,200 units of turbonuclease and the RNAseA samples were treated with 0.1mg/mL of RNAseA. Samples were incubated for 4 hours at 4°C on a rotator. After the incubation a 50µL sample was taken from each tube to check the efficiency of the DNA and RNA degradation. The NaCl concentration of the rest of the samples was adjusted to 200mM and samples were incubated on ice for 30 minutes. Samples were centrifuged for 10 minutes, maximum speed at 4°C to extract the protein. Proteins were quantified with BCA and 1mg of protein was used for the co-IP. 1mg of the lysate was precleared for 4 hours at 4°C with 80µL of protein G dynabeads magnetic beads (10004D) washed once in coIP buffer (0.2M NaCl, 25mM HEPES, 1mM MgCl2, 0.2mM EDTA, 0.5% NP-40 and 1X HALT protease inhibitor). After pre-clearing, 1% of input was kept to check CTCF and RAD21 depletion and also to load on the Western blot gels. The 1mL lysate was divided into two tubes of 500µL and incubated overnight either with 5µL of rabbit IgG (Normal Rabbit IgG, Cell signaling Technology, #2729, 1mg/mL) or 5µL DDX55 (Bethyl 1mg/mL, A303-027A) or 15µL TAF5L (Proteintech, 19274-1-AP, 0.333mg/mL) or 5µL TAF6L (ABclonal, A14369, 3.38mg/mL). The next day, 40µL of protein G dynabeads magnetic beads washed once in coIP buffer (10004D) were added to each tube and incubated 2 hours at 4°C. Then, the beads were washed 5 times, 5 minutes with 500µL of coIP buffer using a magnetic rack at room temperature. Flow Through (FT) and last wash were kept for the Western blot gels. To elute the proteins, the beads were resuspended in 20µL of 2X SDS buffer, heated for 5 minutes at 100°C and the supernatants were taken after placing the tubes on the magnetic rack. The totality of the 20µL sample was loaded on a NuPAGE™ Novex™ 3–8% Tris-Acetate Protein Gels, 1.0mm, 12-well and analyzed by Western blot. Each co-IP was performed in two replicates (see Supplementary Table 6 for antibodies used).
DNA and RNA extraction to check DNA and RNA degradation efficiency for co-IP
DNA was extracted with the DNA extraction kit from Qiagen (DNeasy Blood & Tissue Kit, 69504, Qiagen) and resuspended in 25µL of water. DNA concentration was assessed with Qubit broad range kit (Qubit™ dsDNA BR Assay Kit, Q32850, Thermo Fisher Scientific) or nanodrop. 100ng of the non-treated samples were taken and an equal volume from the nuclease-treated samples were taken and used to quantify by qPCR.
RNA was extracted with TRIzol following manufacturer recommendations. After precipitation, RNA was resuspended in 25µL of water. RNA concentration was assessed with nanodrop. For each reverse transcription reaction, 1µg of the non-treated samples were taken and an equal volume for the nucleases-treated samples were taken. Reverse transcription was performed with VILO IV (SuperScript™ IV VILO™ Master Mix, 11756050, Thermo Fisher Scientific) and incubated 20 minutes at 25°C, 10 minutes at 50°C and 5 minutes at 85°C. cDNA was diluted by 20 and 2µL was used for the qPCR.
qPCR
qPCR was directly done on the cDNAs using Fast SYBR™ Green Master Mix (ThermoFisher Scientific, 4385612) and analyzed on a StepOnePlus™ Real-Time PCR System (ThermoFisher Scientific) using StepOne™ Plus v2.3 software. See Supplementary Table 1 for qPCR primer sequences.
Statistics and Reproducibility
The Co-Immunoprecipitations and Western blots were performed at least twice for each condition. All Hi-C, RNA-seq, ChIP-seq were performed for two biological replicates. CRISPR screens were performed in three technical replicates for each condition.
Extended Data
Extended Data Fig. 1. Characterization of the HAP1-CTCFdegron.
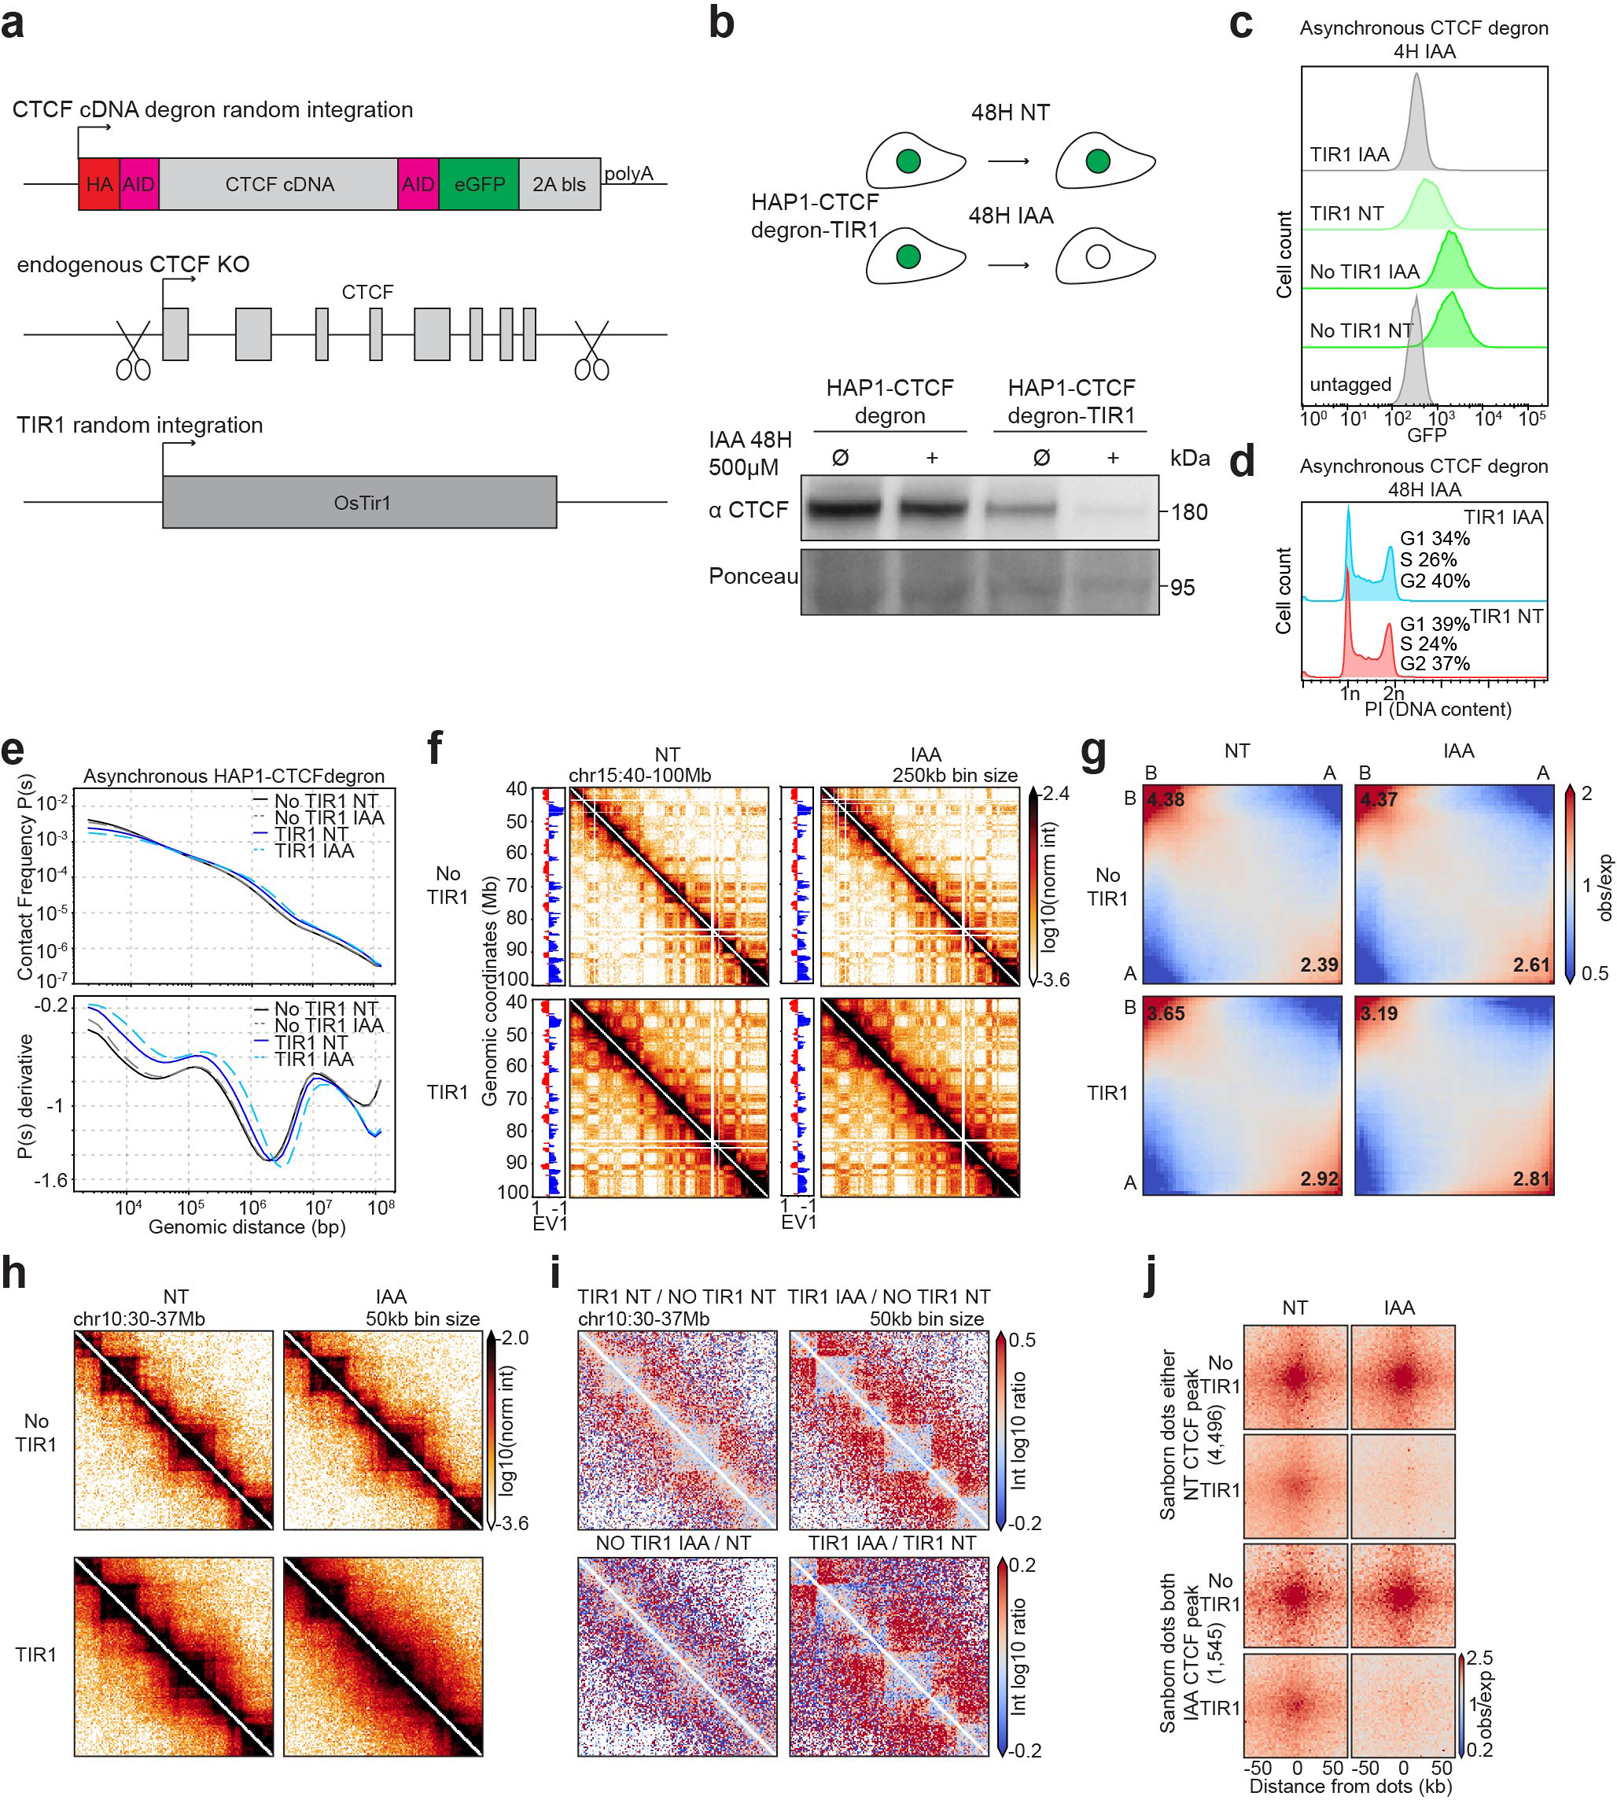
a, Schematic representing the strategy used to construct the HAP1-CTCFdegron-TIR1 cells.
b, Schematic representing CTCF depletion in HAP1-CTCFdegron-TIR1 cells (top). Western blot against CTCF in HAP1-CTCFdegron cells and in HAP1-CTCFdegron-TIR1 cells without/with auxin (NT and IAA). Ponceau is shown for loading control (bottom).
c, Flow cytometry for GFP in HAP1-CTCFdegron and HAP1-CTCFdegron-TIR1 cells without/with auxin.
d, Flow cytometry for HAP1-CTCFdegron-TIR1 cells without/with auxin stained with Propidium Iodide (PI) to assess the DNA content for cell cycle analysis.
e, Hi-C contact frequency as a function of genomic distance, P(s) (top) and its derivative dP/ds (bottom) for HAP1-CTCFdegron and HAP1-CTCFdegron-TIR1 cells without/with auxin.
f, Hi-C contact heatmaps at 250kb resolution with the corresponding track of the first Eigenvector (EV1) across chromosome 15 for HAP1-CTCFdegron and HAP1-CTCFdegron-TIR1 cells without/with auxin.
g, Genome-wide saddle plots of Hi-C data binned at 100kb resolution for HAP1-CTCFdegron and HAP1-CTCFdegron-TIR1 cells without/with auxin. The compartment strengths are indicated in the corners.
h, Hi-C contact heatmaps at 50kb resolution for a 7Mb region on chromosome 10 for HAP1-CTCFdegron and HAP1-CTCFdegron-TIR1 cells without/with auxin.
i, Differential interaction heatmaps for HAP1-CTCFdegron and HAP1-CTCFdegron-TIR1 cells.
j, Dot pileups for dots characterized in HAP1 cells that have a CTCF peak in either anchor in the Non-Treated sample (4,496 dots) and that have a CTCF peak in both anchors in the auxin sample (1,545 dots) for HAP1-CTCFdegron and HAP1-CTCFdegron-TIR1 cells without/with auxin. The dots were aggregated at the center of a 100kb window at 2kb resolution.
Extended Data Fig. 2. CTCF sites and active TSSs are chromatin boundaries.
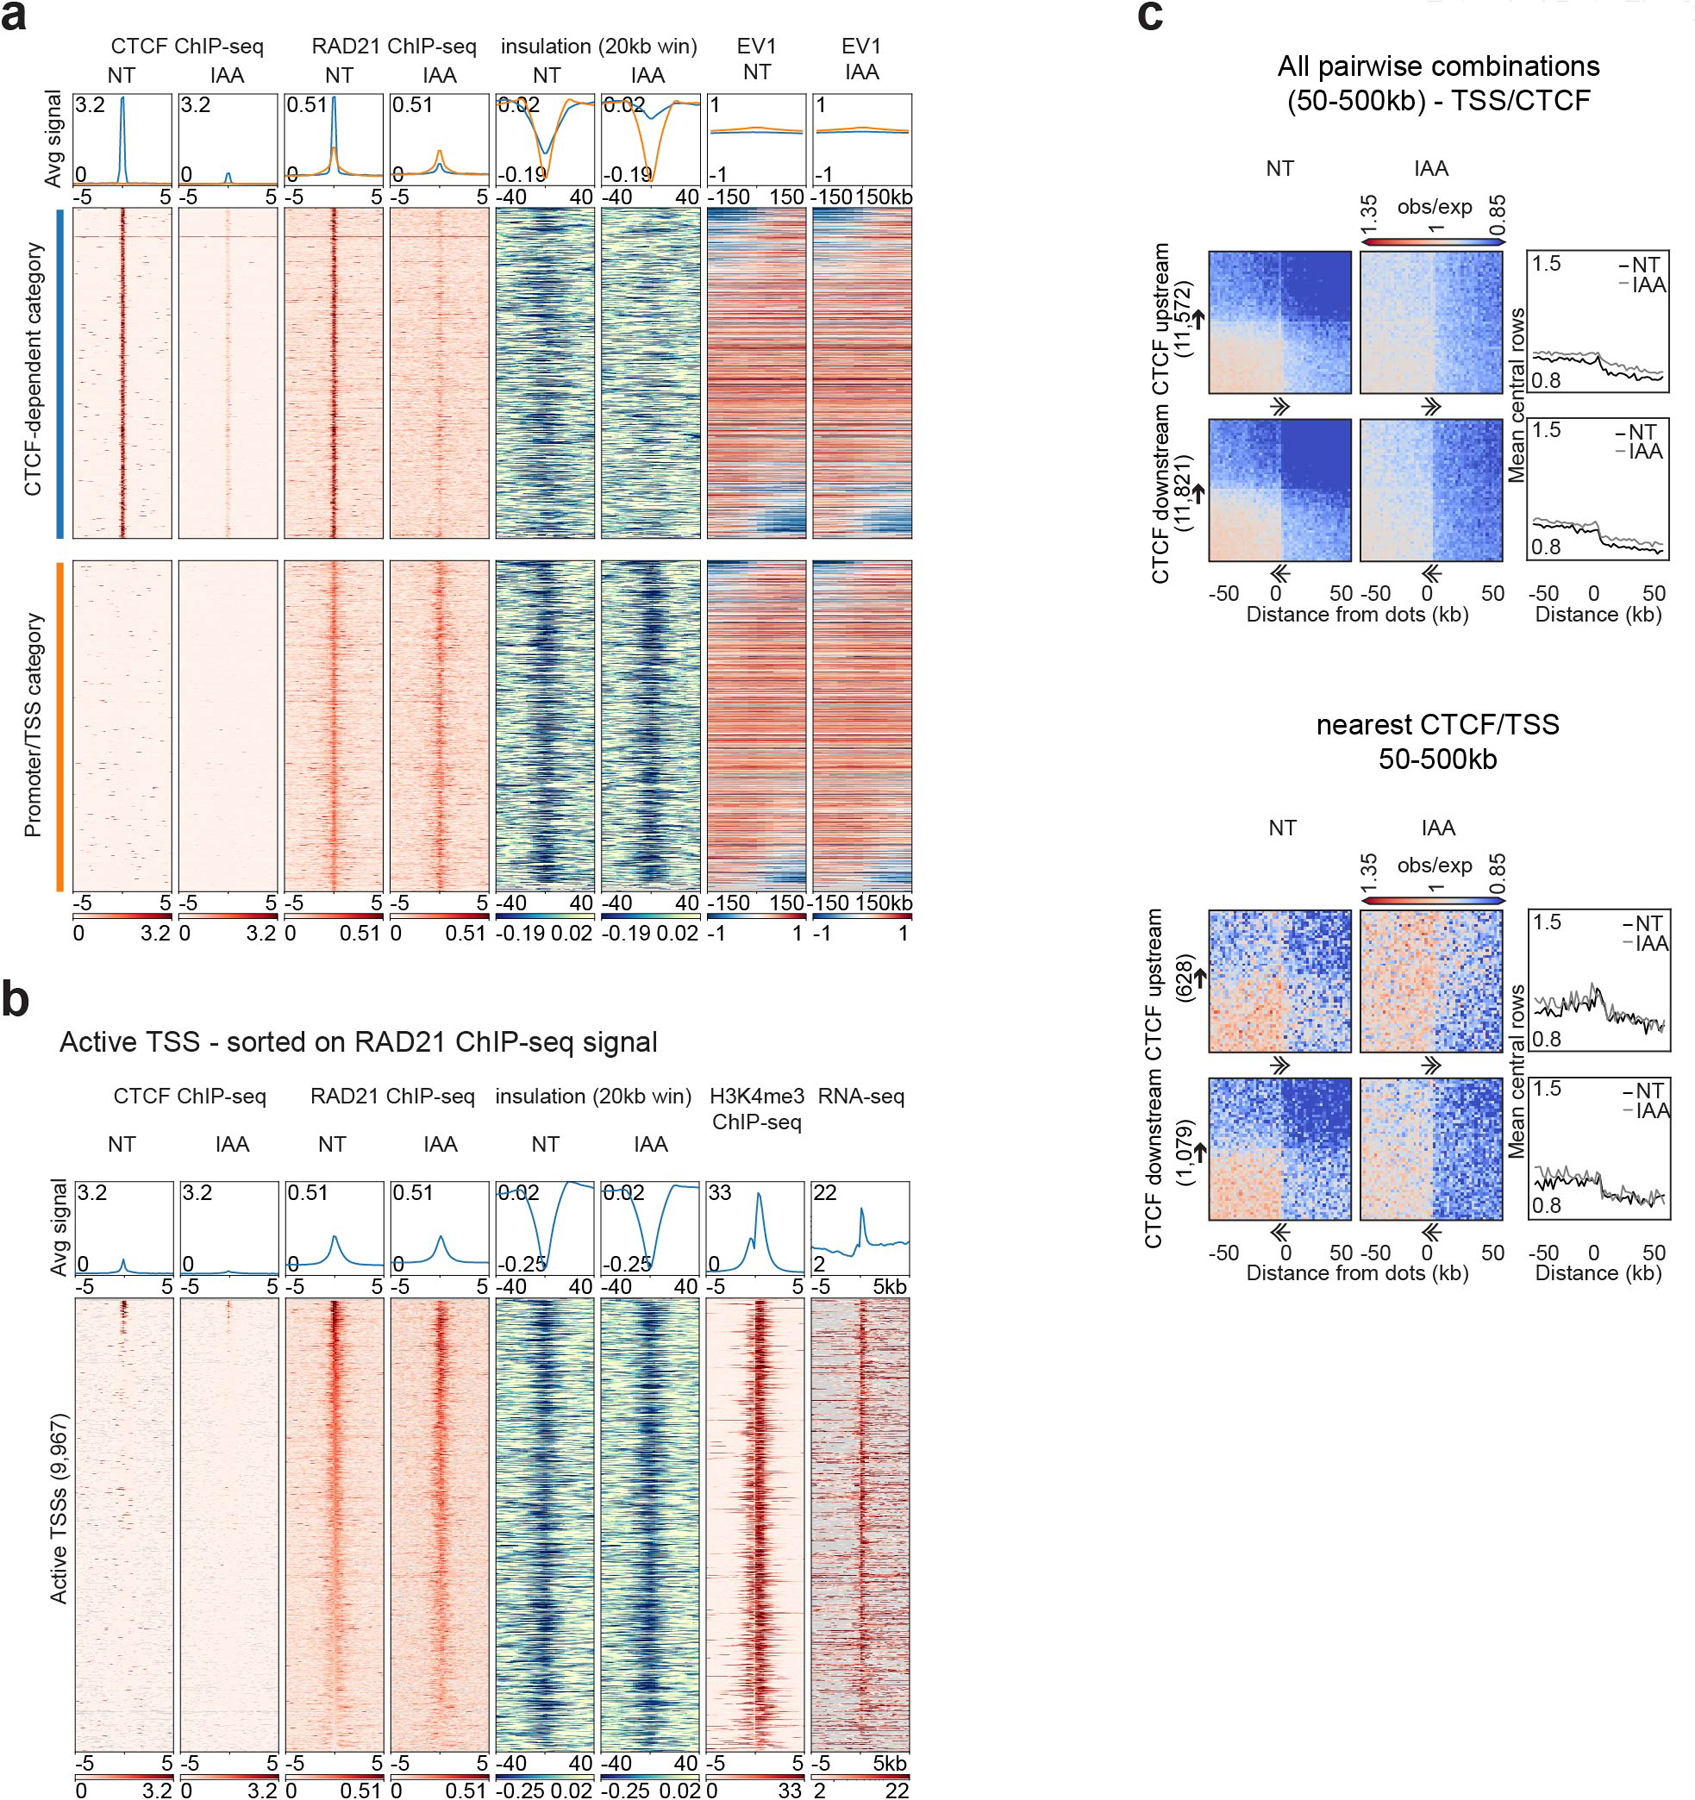
a, Stackups for CTCF-dependent (blue) and promoter/TSS (orange) categories sorted on the change of the first Eigenvector (EV1, 25kb) from left to right flank. CTCF and RAD21 ChIP-seq, calculated insulation and EV1 in HAP1-CTCFdegron-TIR1 cells without/with auxin (NT and IAA) were plotted.
b, Stackups for active TSSs, sorted on RAD21 ChIP-seq signal. CTCF and RAD21 ChIP-seq, calculated insulation and RNAseq in the HAP1-CTCFdegron-TIR1 cells without/with auxin were plotted along with the published HAP1 H3K4me3 ChIP-seq26. Stackups were flipped according to the orientation of the genes, to have the gene body at the right of the TSSs.
c, Dot pileup aggregation plots for remaining CTCF motif orientations represented in Fig. 1e for a 100kb window at 2kb resolution. With orientation (top). CTCF (upstream or downstream)-TSS pairwise interactions are plotted with their quantifications (mean of the 5 central bins at the CTCF site). Nearest analysis (bottom). CTCF (upstream or dowstream)-TSS pairwise interactions are plotted without any CTCF peaks or TSSs in between them with their quantifications (mean of the 5 central bins at the CTCF site). The black arrows represent the CTCF motif and the direction of the arrow, the motif orientation. The double arrows represent the TSSs and the direction of the arrow, the TSSs orientation.
Extended Data Fig. 3. CTCF, RAD21, WAPL and RNA polII depletion effects on the three types of chromatin boundaries.
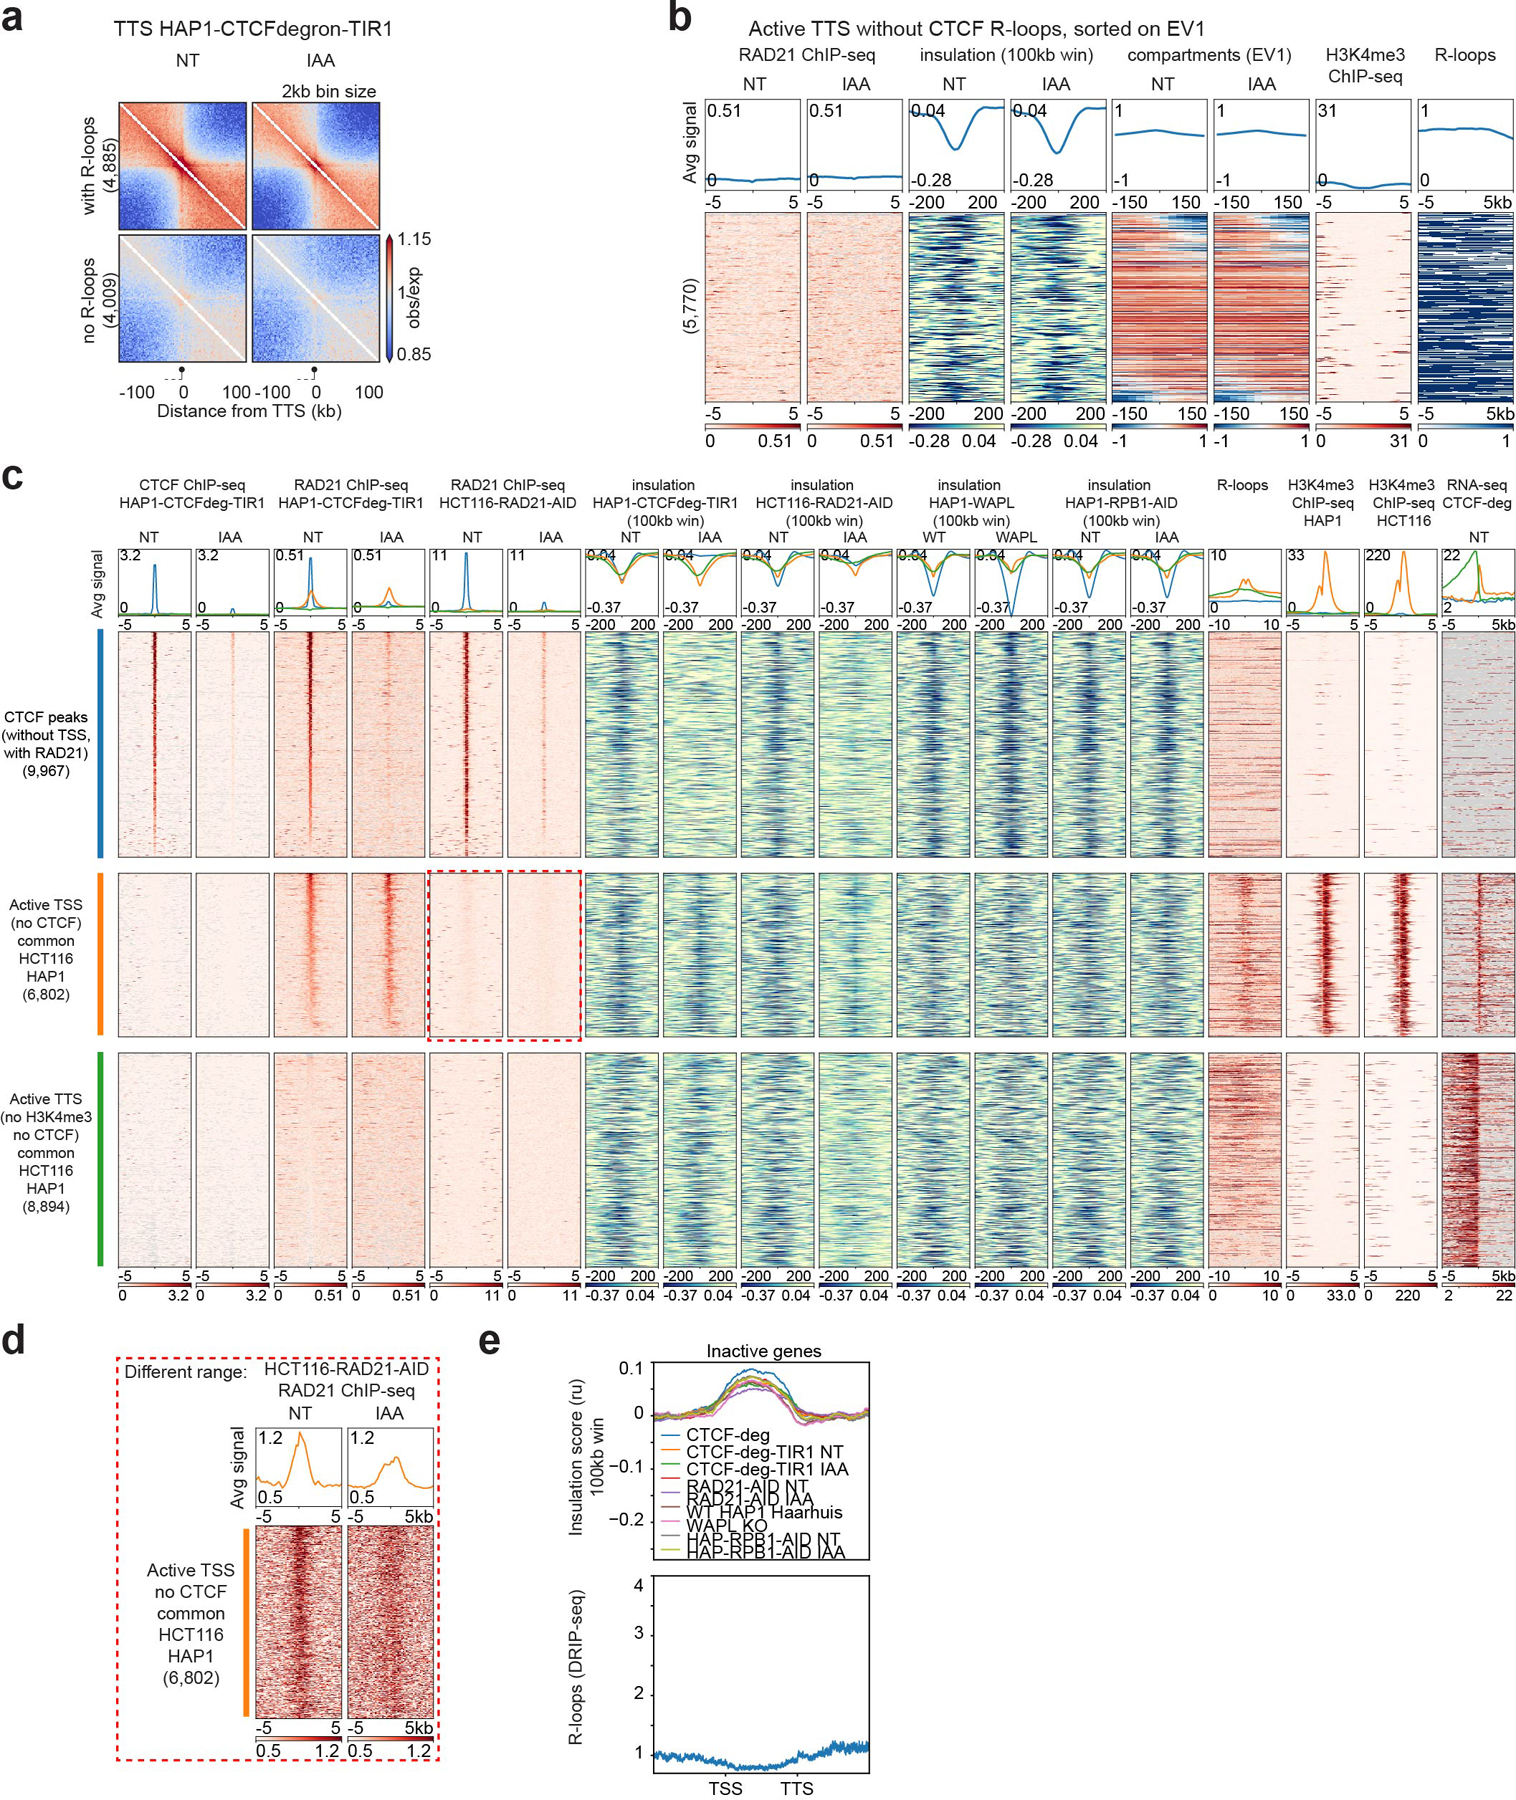
a, Oriented interaction pileups for HAP1-CTCFdegron-TIR1, without/with auxin (NT and IAA), aggregated in a 200kb window at 2kb resolution were plotted for the active TTS (without CTCF) with or without R-loops. The black circle on a stick represents the TTS and the gene body is represented by a dash line.
b, Stackups for active TTS (without CTCF, with R-loops), sorted on the change of first Eigenvector (EV1, 25kb) signal from left to right flank. RAD21 ChIP-seq, calculated insulation and EV1 in HAP1-CTCFdegron-TIR1 cells without/with auxin were plotted along with the published HAP1 H3K4me3 ChIP-seq26 and the consensus list of R-loops.
c, Stackups for the three categories of insulation: the CTCF peaks (without TSSs, with RAD21) (blue), the active TSSs (orange) and TTSs (green) common between HAP1 and HCT116 cell lines, sorted on the NT RAD21 ChIP-seq signal. The CTCF and RAD21 ChIP-seq signals, the RNA-seq and the insulation for the described cell line and condition were plotted along with the published K562 R-loops67 and the HAP126 and HCT116 H3K4me3 ChIP-seq signals. Stackups were flipped according to the orientation of the genes, to have the gene body on the right for the TSSs and on the left of the TTSs. The red dashed rectangle indicates the zoom in Extended Data Fig. 3d.
d, Active TSSs common between HAP1 and HCT116 cell lines (without CTCF) were plotted with a different scale to show the remaining RAD21 after RAD21 depletion (red dashed rectangle).
e, Average insulation profiles across scaled inactive genes without CTCF at TSSs and TTSs at 5kb resolution for all the Hi-C libraries plotted in Fig. 2b.
Extended Data Fig. 4. Characterization of the HAP1-RPB1-AID cell line.
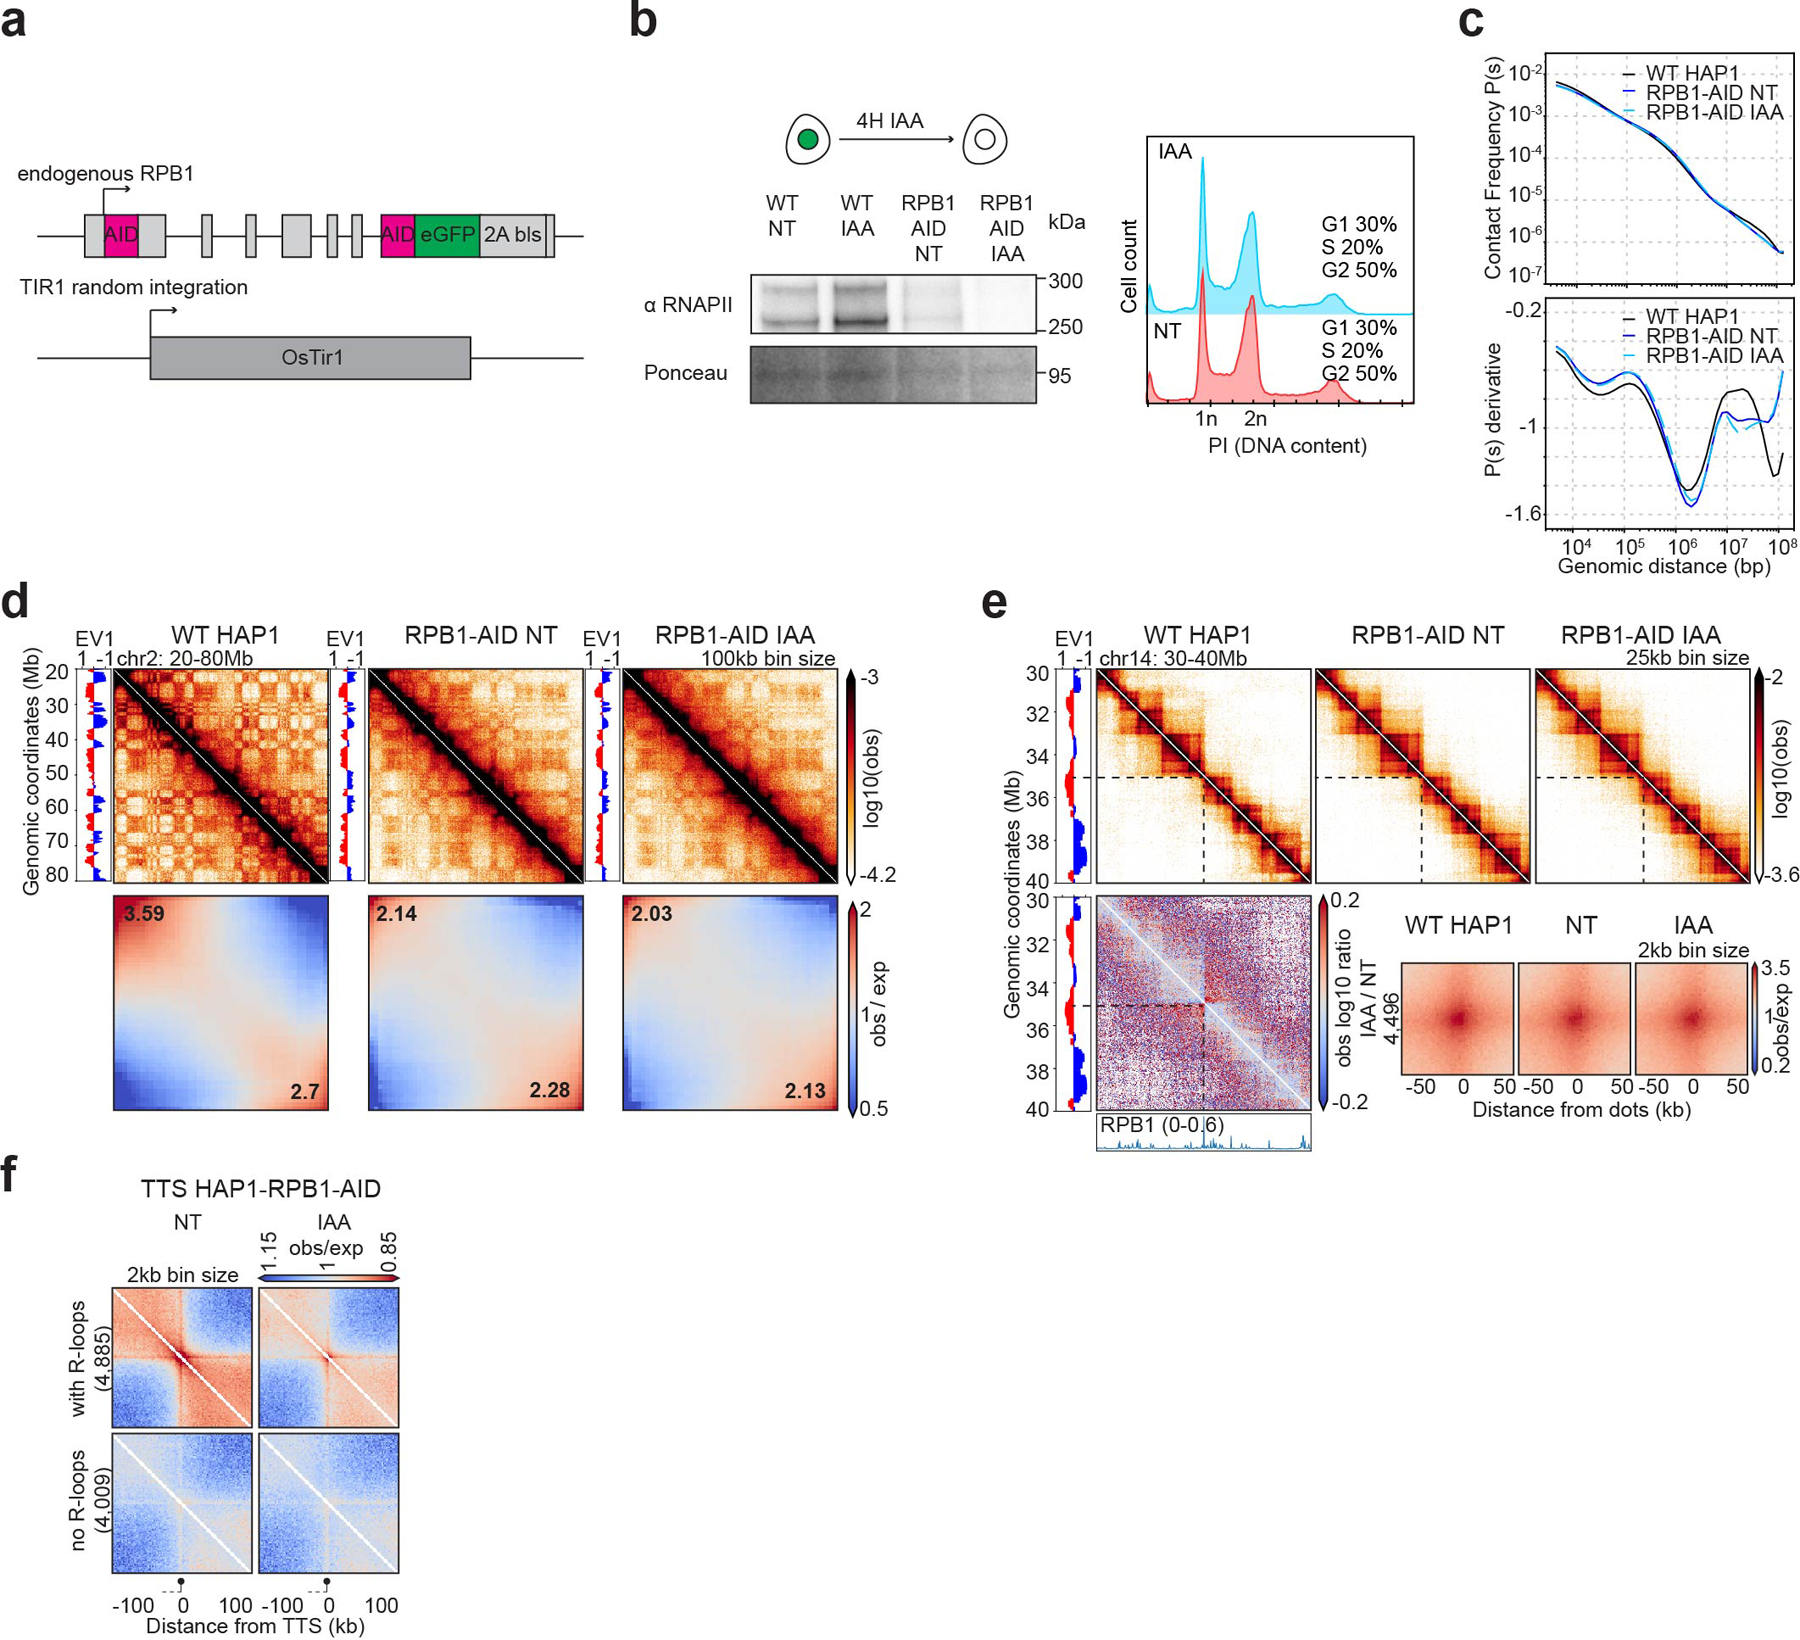
a, Schematic of the HAP1-RPB1-AID construct
b, Western blot against RPB1 in WT HAP1 cells and HAP1-RPB1-AID cells showing RPB1 depletion after 4 hours of auxin treatment (IAA). Ponceau is shown for loading control. Flow cytometry for HAP1-RPB1-AID cells without/with auxin (NT and IAA) stained with Propidium Iodide (PI) to assess the DNA content for cell cycle analysis.
c, Hi-C contact frequency as a function of genomic distance, P(s) (top) and its derivative dP/ds (bottom) for HAP1 wild-type cells and HAP1-RPB1-AID cells in absence and presence of auxin.
d, Hi-C contact heatmaps at 100kb resolution with the corresponding track of the first Eigenvector (EV1) across a 60Mb region on chromosome 2 for HAP1 and HAP1-RPB1-AID cells without/with auxin. Genome-wide saddle plots of Hi-C data binned at 100kb resolution for HAP1 and HAP1-RPB1-AID cells without/with auxin. The compartment strengths are indicated in the corners.
e, Hi-C contact heatmaps at 25kb resolution with the corresponding distribution of EV1 and published RPB1 ChIP-seq signal68 for a 10Mb region on chromosome 14 for HAP1 and HAP1-RPB1-AID cells without/with auxin. The differential interaction heatmap (presence/absence of auxin) is shown on the bottom. Dot pileups for dots found in HAP1 cells that have a CTCF peak in either anchor in the CTCF degron NT sample (4,496 dots) for HAP1-RPB1-AID cells without/with auxin. The dots were aggregated at the center of a 100kb window at 2kb resolution.
f, Oriented interaction pileups for HAP1-RPB1-AID, without/with auxin, aggregated in a 200kb window at 2kb resolution were plotted for the active TTS with or without R-loops. The black circle on a stick represents the TTS and the gene body is represented by a dash line on the left of the TTS.
Extended Data Fig. 5. Genome wide CRISPR screen in context of altered cohesin traffic pattern following CTCF depletion.
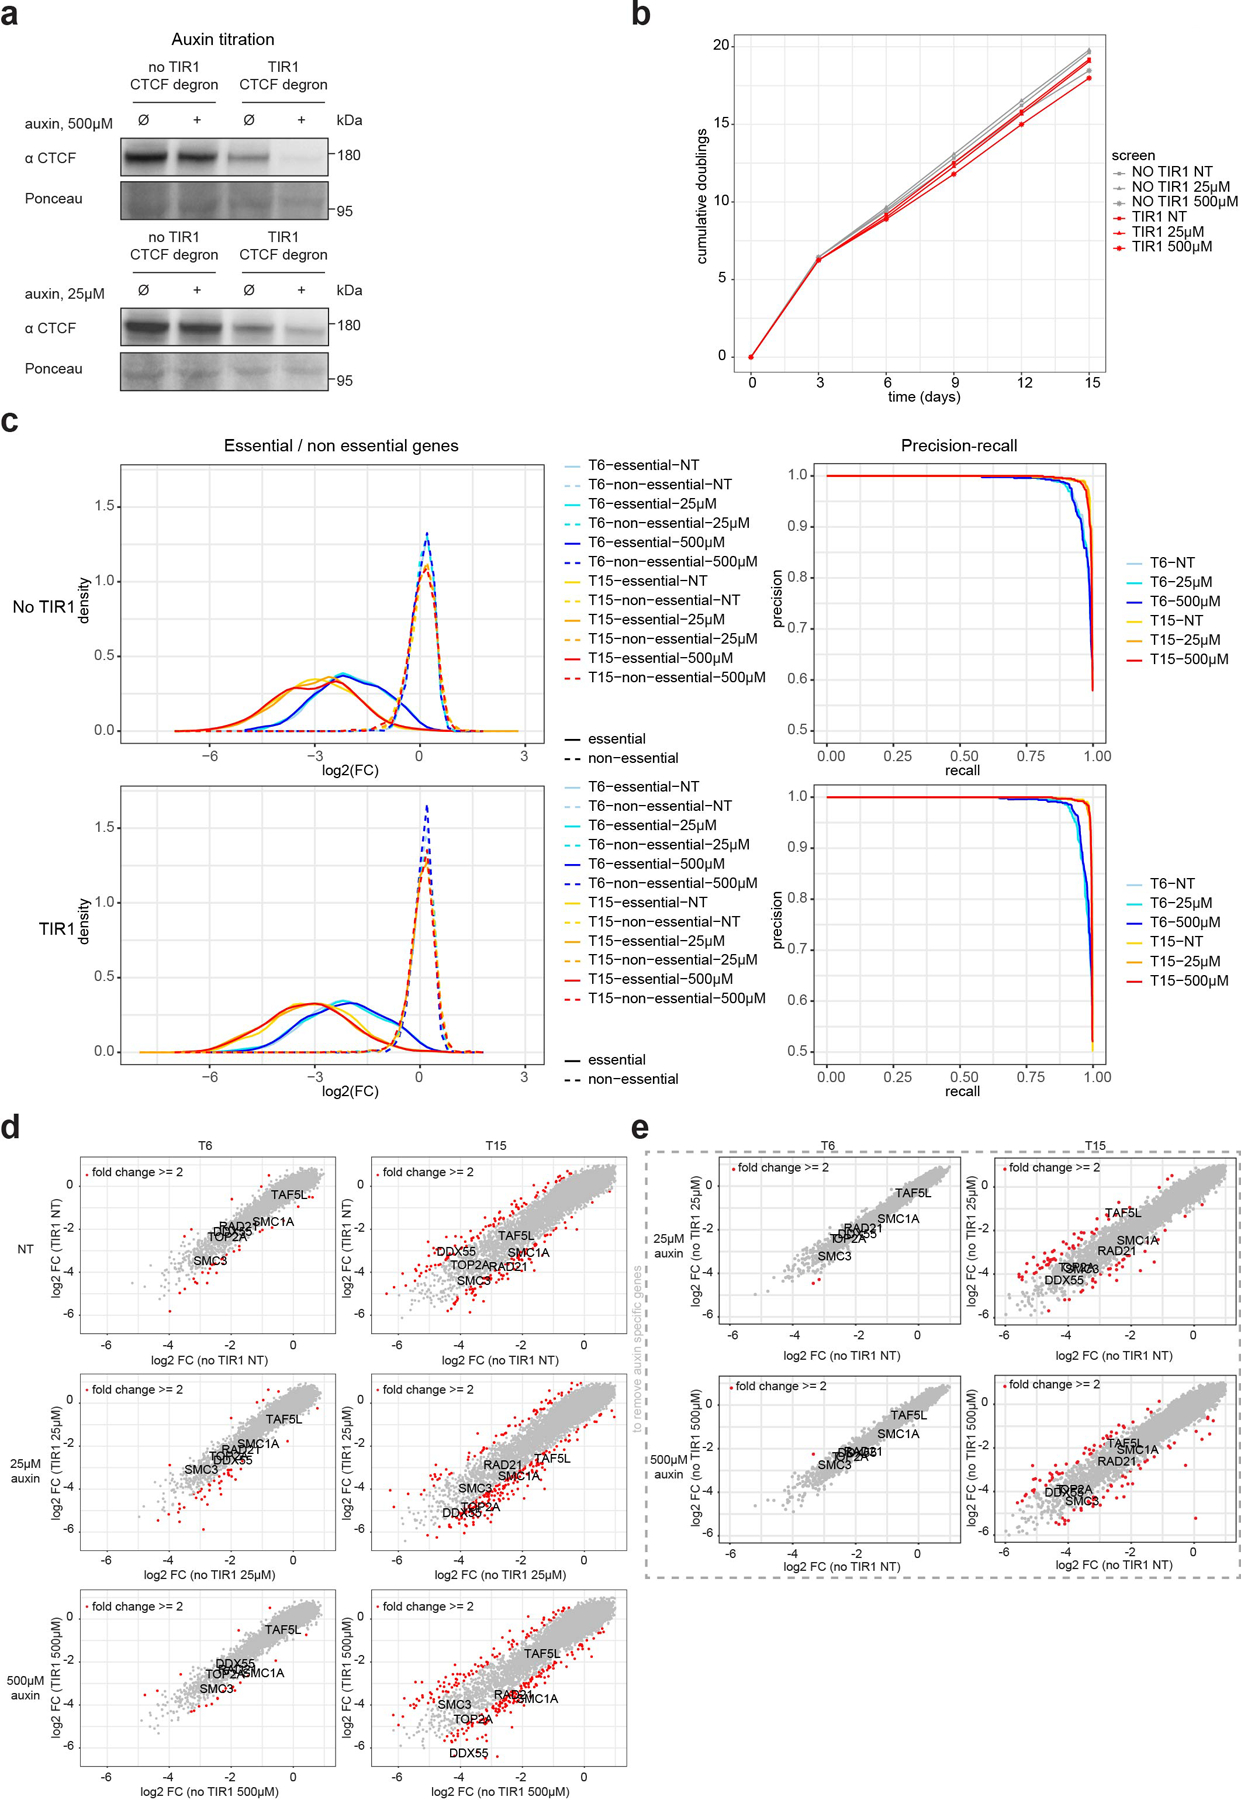
a, Western blot against CTCF in HAP1-CTCFdegron and HAP1-CTCFdegron-TIR1 cells without/with auxin (NT and IAA) with the two different auxin concentrations (25μM and 500μM) used in the screen showing the partial CTCF depletion with 25μM IAA and the nearly total CTCF depletion with 500μM IAA. Ponceau is shown for loading control.
b, Plot showing the cumulative number of doublings relative to the days cells were passaged during the screen for HAP1-CTCFdegron and HAP1-CTCFdegron-TIR1 for the three auxin concentrations (NT, 25μM and 500μM).
c, Fold change distribution of essential and nonessential gene sets at indicated time points for the screens in HAP1-CTCFdegron and HAP1-CTCFdegron-TIR1 cells for the three auxin concentrations (left). Precision-recall curves based on Bayes Factors (BFs) of predefined essential and non-essential gene sets for the screens for HAP1-CTCFdegron and HAP1-CTCFdegron-TIR1 cells for the three auxin concentrations at the indicated time points (right).
d, Scatter plots of the log2FC for HAP1-CTCFdegron-TIR1 screens against HAP1-CTCFdegron screens for T6 and T15 time points. Genes with a fold change of ≥ 2 between HAP1-CTCFdegron and HAP1-CTCFdegron-TIR1 screens are highlighted in red. Genes linked to CTCF are indicated (cohesin, TOP2A) along with the two studied gene hits (DDX55 and TAF5L).
e, Scatter plots of the log2FC for HAP1-CTCFdegron cells without/with auxin at T6 and T15 time points. Genes with a fold change of ≥ 2 between absence and presence of auxin are highlighted in red and considered as auxin specific genes. Genes linked to CTCF are indicated (cohesin genes, TOP2A) along with the two studied gene hits (DDX55 and TAF5L).
Extended Data Fig. 6. DDX55 and TAF5L chromatin binding.
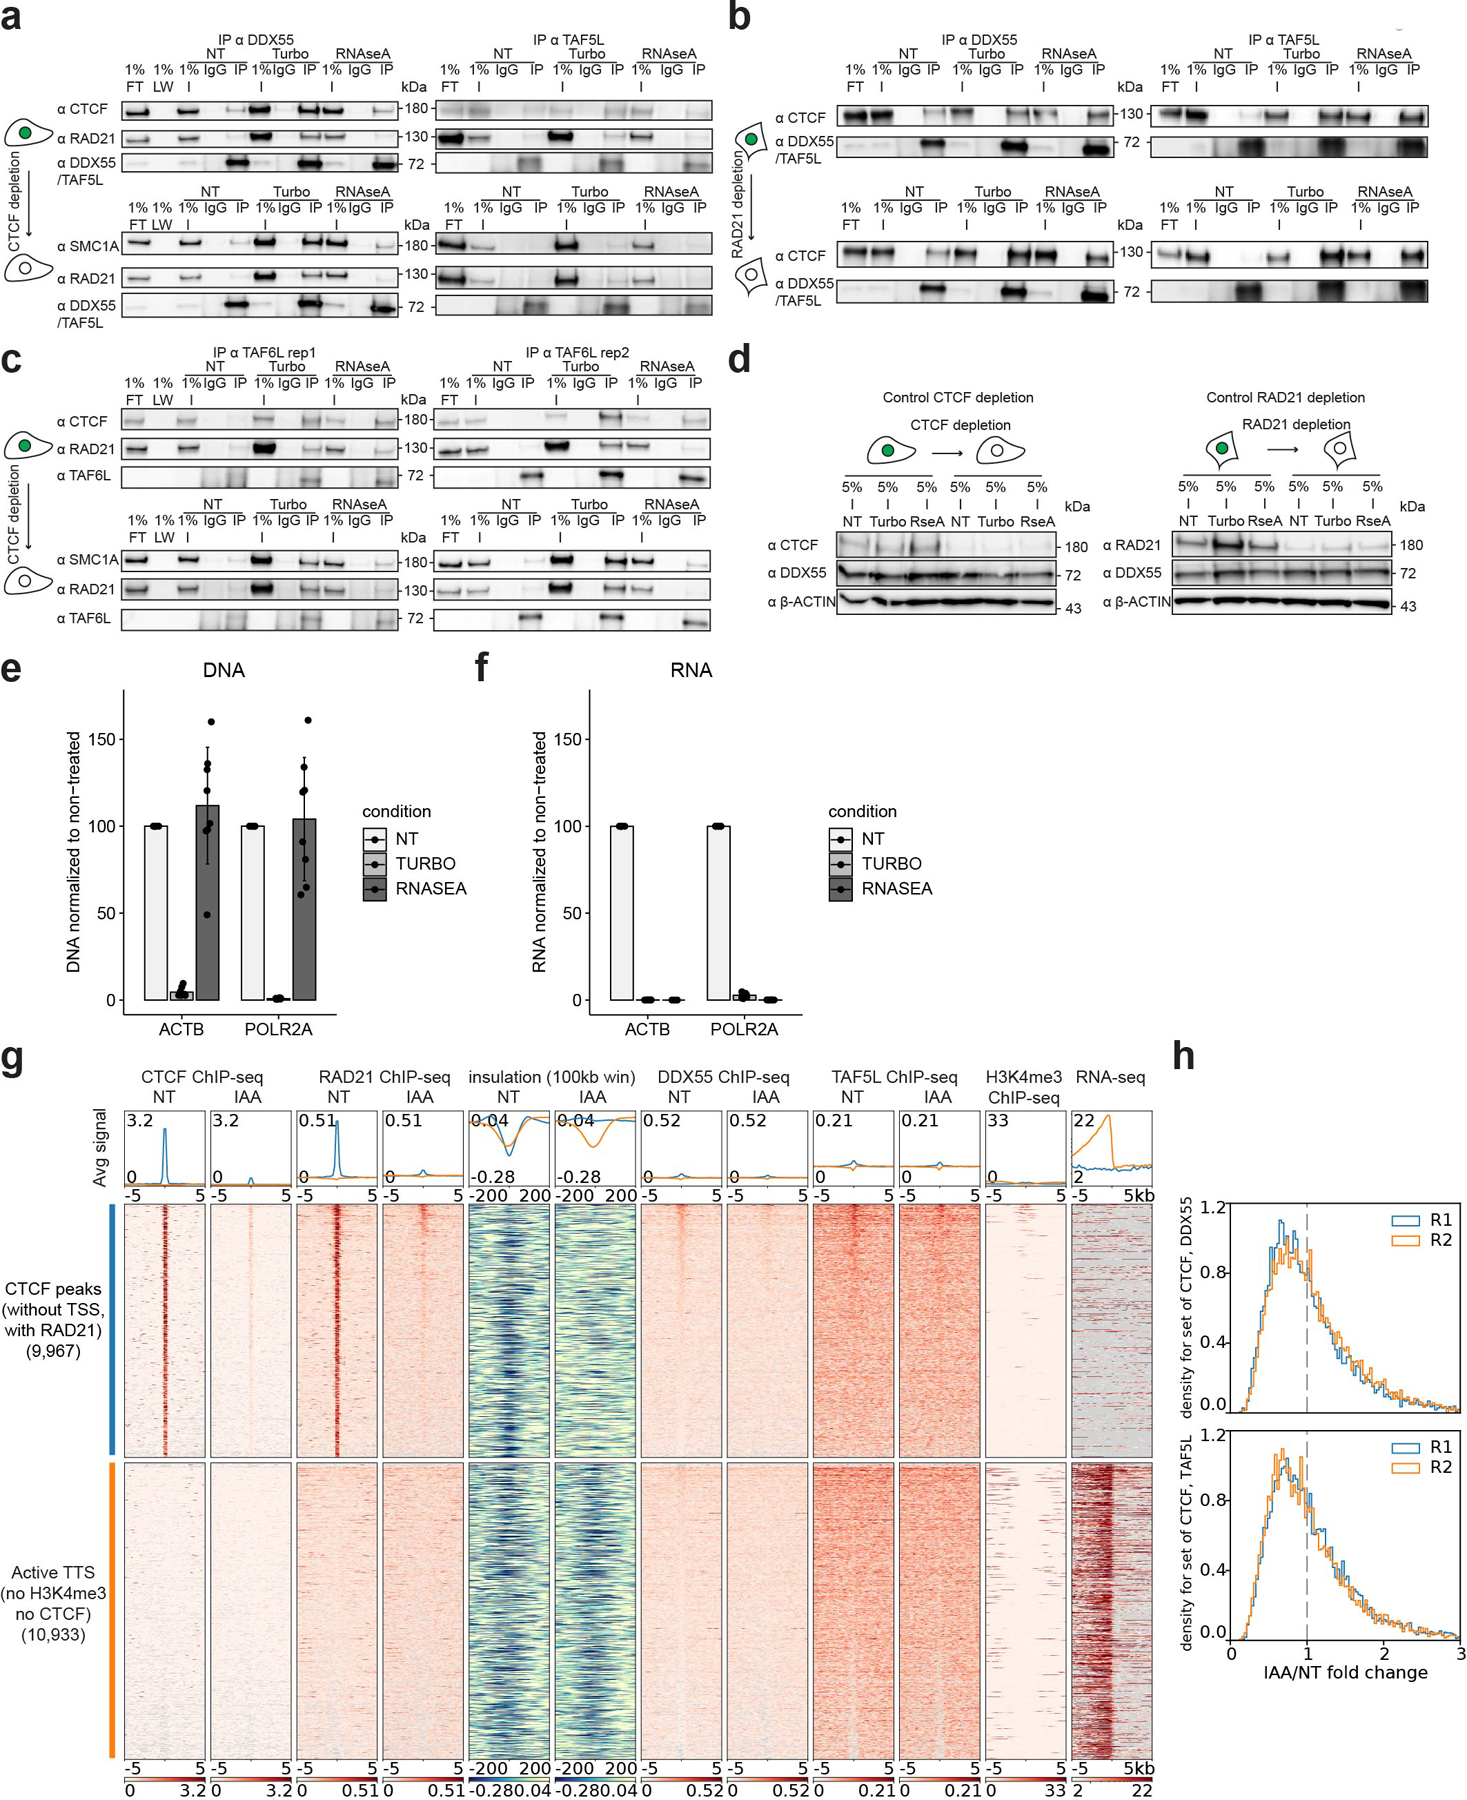
a, Western blot co-IP replicates against DDX55 and TAF5L in HAP1-CTCFdegron-TIR1 without/with auxin (NT and IAA), treated with either turbonuclease (DNA - and RNA -) or RNAseA (RNA -) for CTCF, cohesin (RAD21 and SMC1A), DDX55 and TAF5L.
b, Western blot co-IP replicates against DDX55 and TAF5L in HCT116-RAD21-AID cells without/with auxin, treated with either turbonuclease or RNAseA for CTCF, DDX55 and TAF5L.
c, Western blot co-IP (two replicates) against TAF6L in HAP1-CTCFdegron-TIR1 cells without/with auxin, treated with either turbonuclease or RNAseA for CTCF, cohesin (RAD21 and SMC1A) and TAF6L.
d, Representative western blots against CTCF, RAD21, DDX55 and β-ACTIN (loading control) showing the CTCF depletion efficiency in the HAP1-CTCFdegron-TIR1 co-IP (left) and the RAD21 depletion efficiency in the HCT116-RAD21-AID cells co-IP (right).
e, Efficient DNA digestion by turbonuclease (TURBO) during DDX55, TAF5L and TAF6L co-IPs. DNA digestion was assessed by qPCR using primers specific to ACTB and POLR2A gene locations. Data are presented as mean values +/− SD, n = 8 biologically independent co-IP experiments.
f, Efficient RNA digestion by turbonuclease (TURBO) and RNaseA (RNASEA) during DDX55, TAF5L and TAF6L co-IPs. RNA digestion was assessed by qPCR using primers specific to ACTB and POLR2A genes. Data are presented as mean values +/− SD, n = 8 biologically independent co-IP experiments.
g, Stackups for CTCF (without TSSs, with RAD21), sorted on the Non-Treated (NT) DDX55 ChIP-seq signal. CTCF ChIP-seq, RAD21 ChIP-seq, calculated insulation, DDX55 ChIP-seq, TAF5L ChIP-seq and RNA seq signals in HAP1-CTCFdegron-TIR1 cells without/with auxin were plotted along with published HAP1 H3K4me3 ChIP-seq26. For TTSs, stackups were flipped according to the orientation of the genes, to have the gene body on the left of the TTS.
h, Stackup quantification for CTCF (without TSSs, with RAD21) for DDX55 and TAF5L ChIP-seq for two replicates. The distribution of ratios between auxin-treated and non-treated signals is shown. A fold change < 1 represents less binding of DDX55 or TAF5L at CTCF (without TSSs, with RAD21) after CTCF depletion.
Extended Data Fig. 7. Overview of the different genome-wide data generated in this study, ChIP-seq replicate 1.
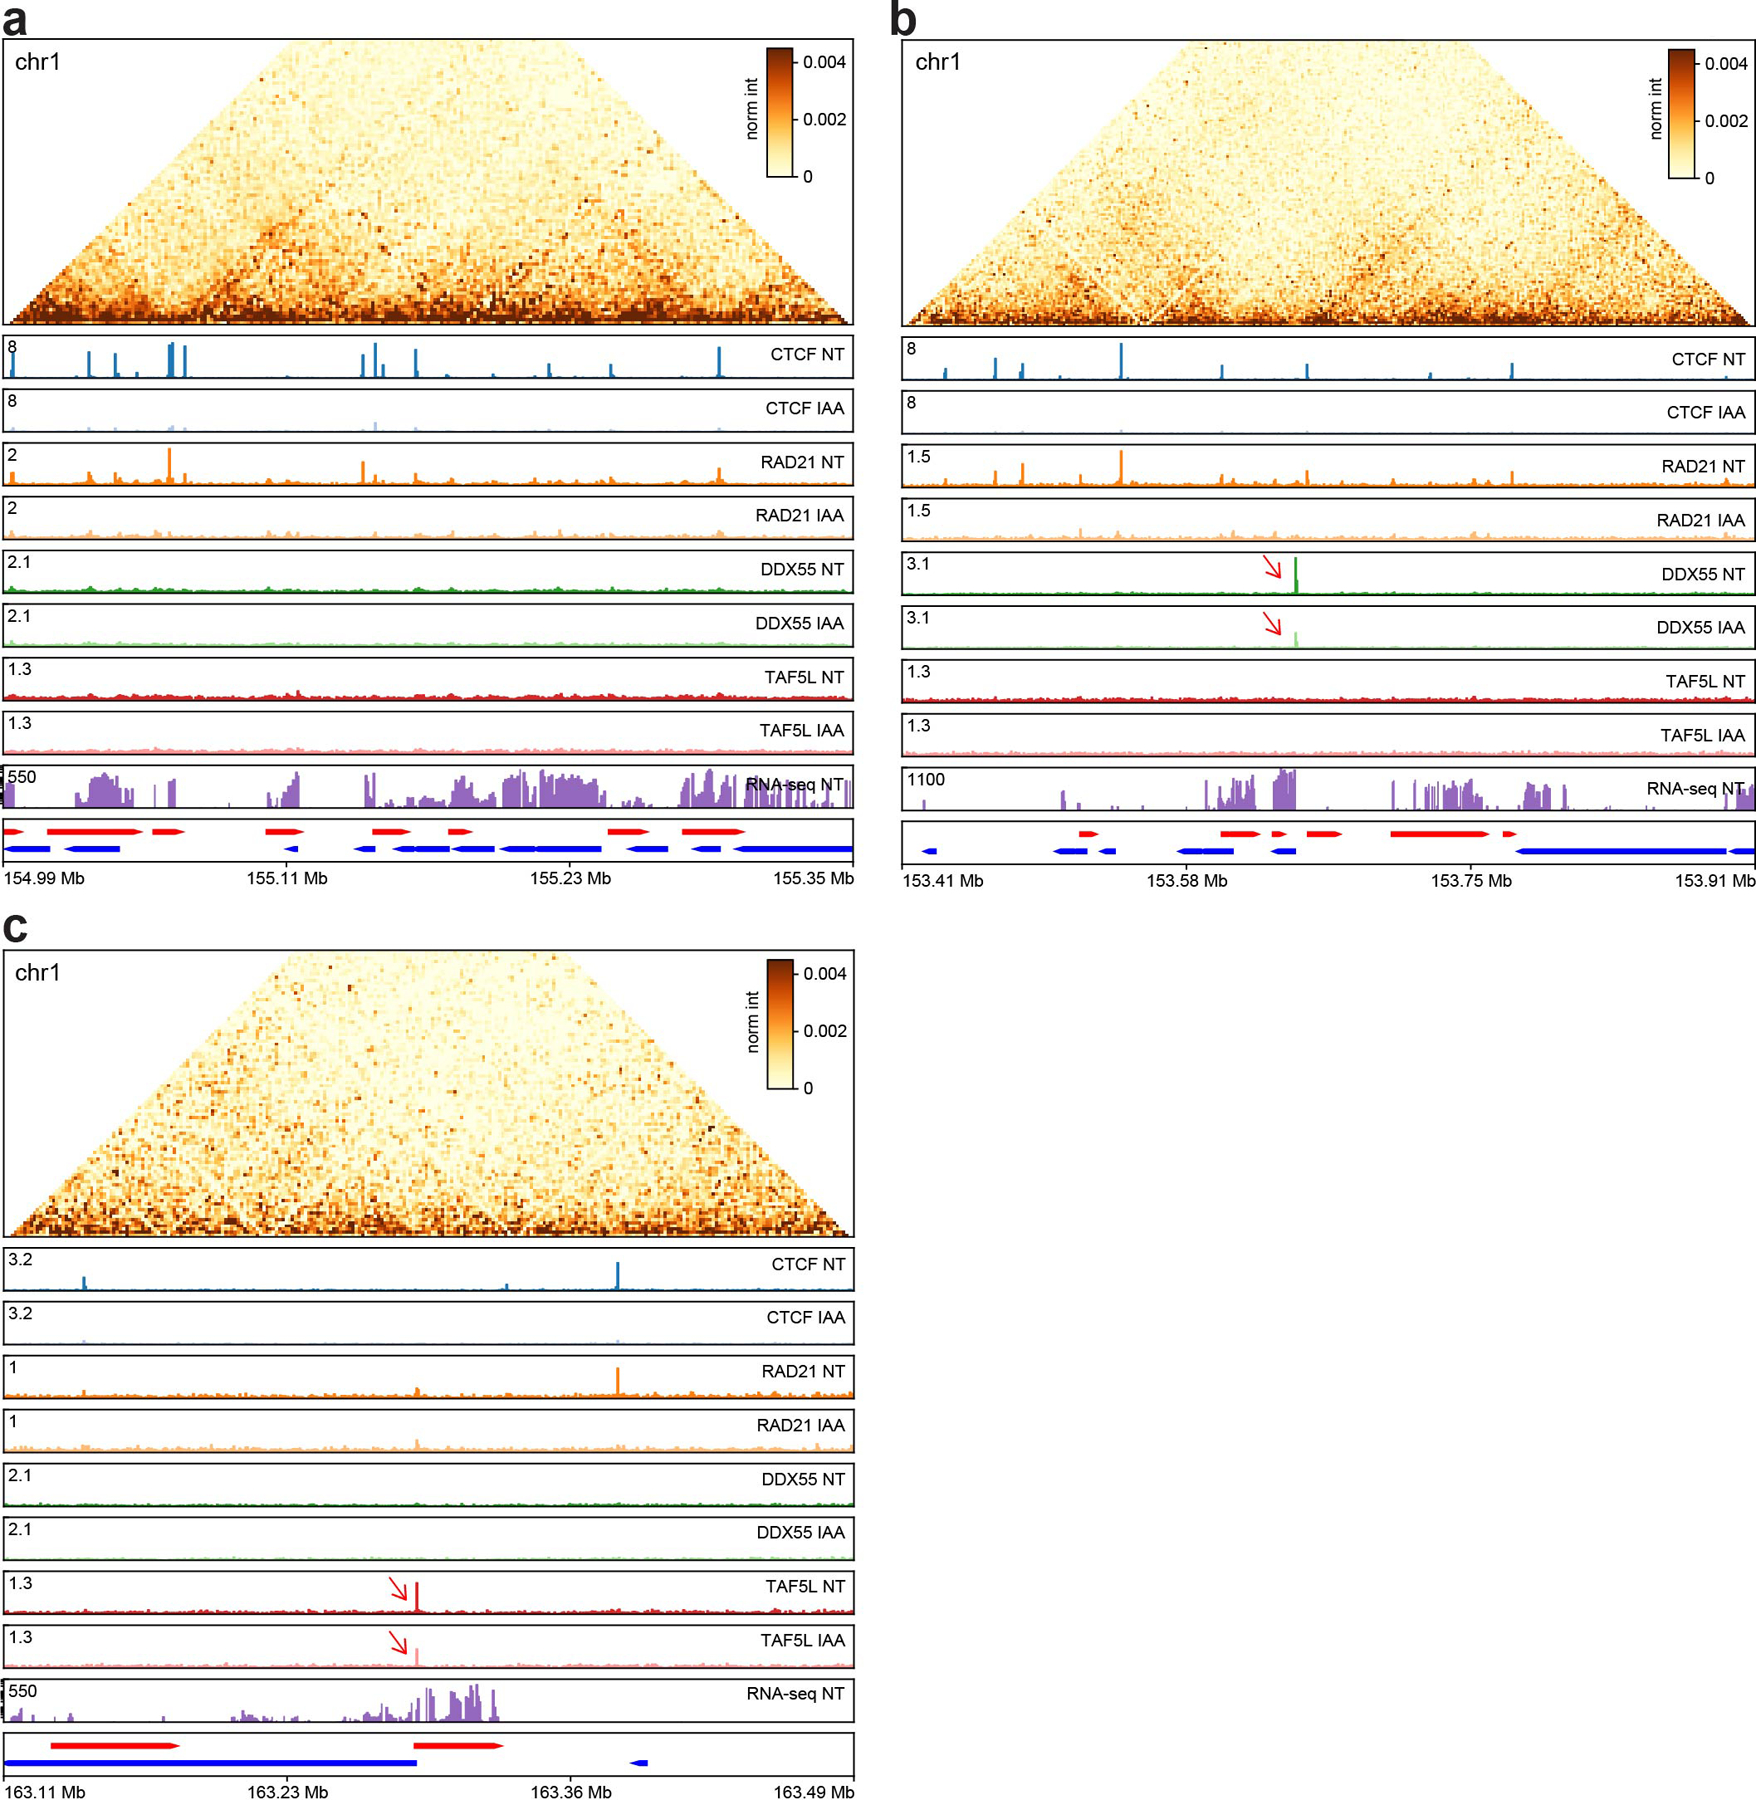
a, A genomic region on chr1 with many CTCF and RAD21 peaks.
b, A genomic region on chr1 with a DDX55 peak at an active promoter which is reduced after CTCF depletion (red arrow).
c, A genomic region in chr1 with a TAF5L peak at an active promoter which is reduced after CTCF depletion (red arrow).
Genes on the forward strand are represented in red (plus) and genes on the reverse strand are represented in blue (minus). Hi-C contact heatmaps are binned at 2kb resolution.
Extended Data Fig. 8. Overview of the different genome-wide data generated in this study, ChIP-seq replicate 2.
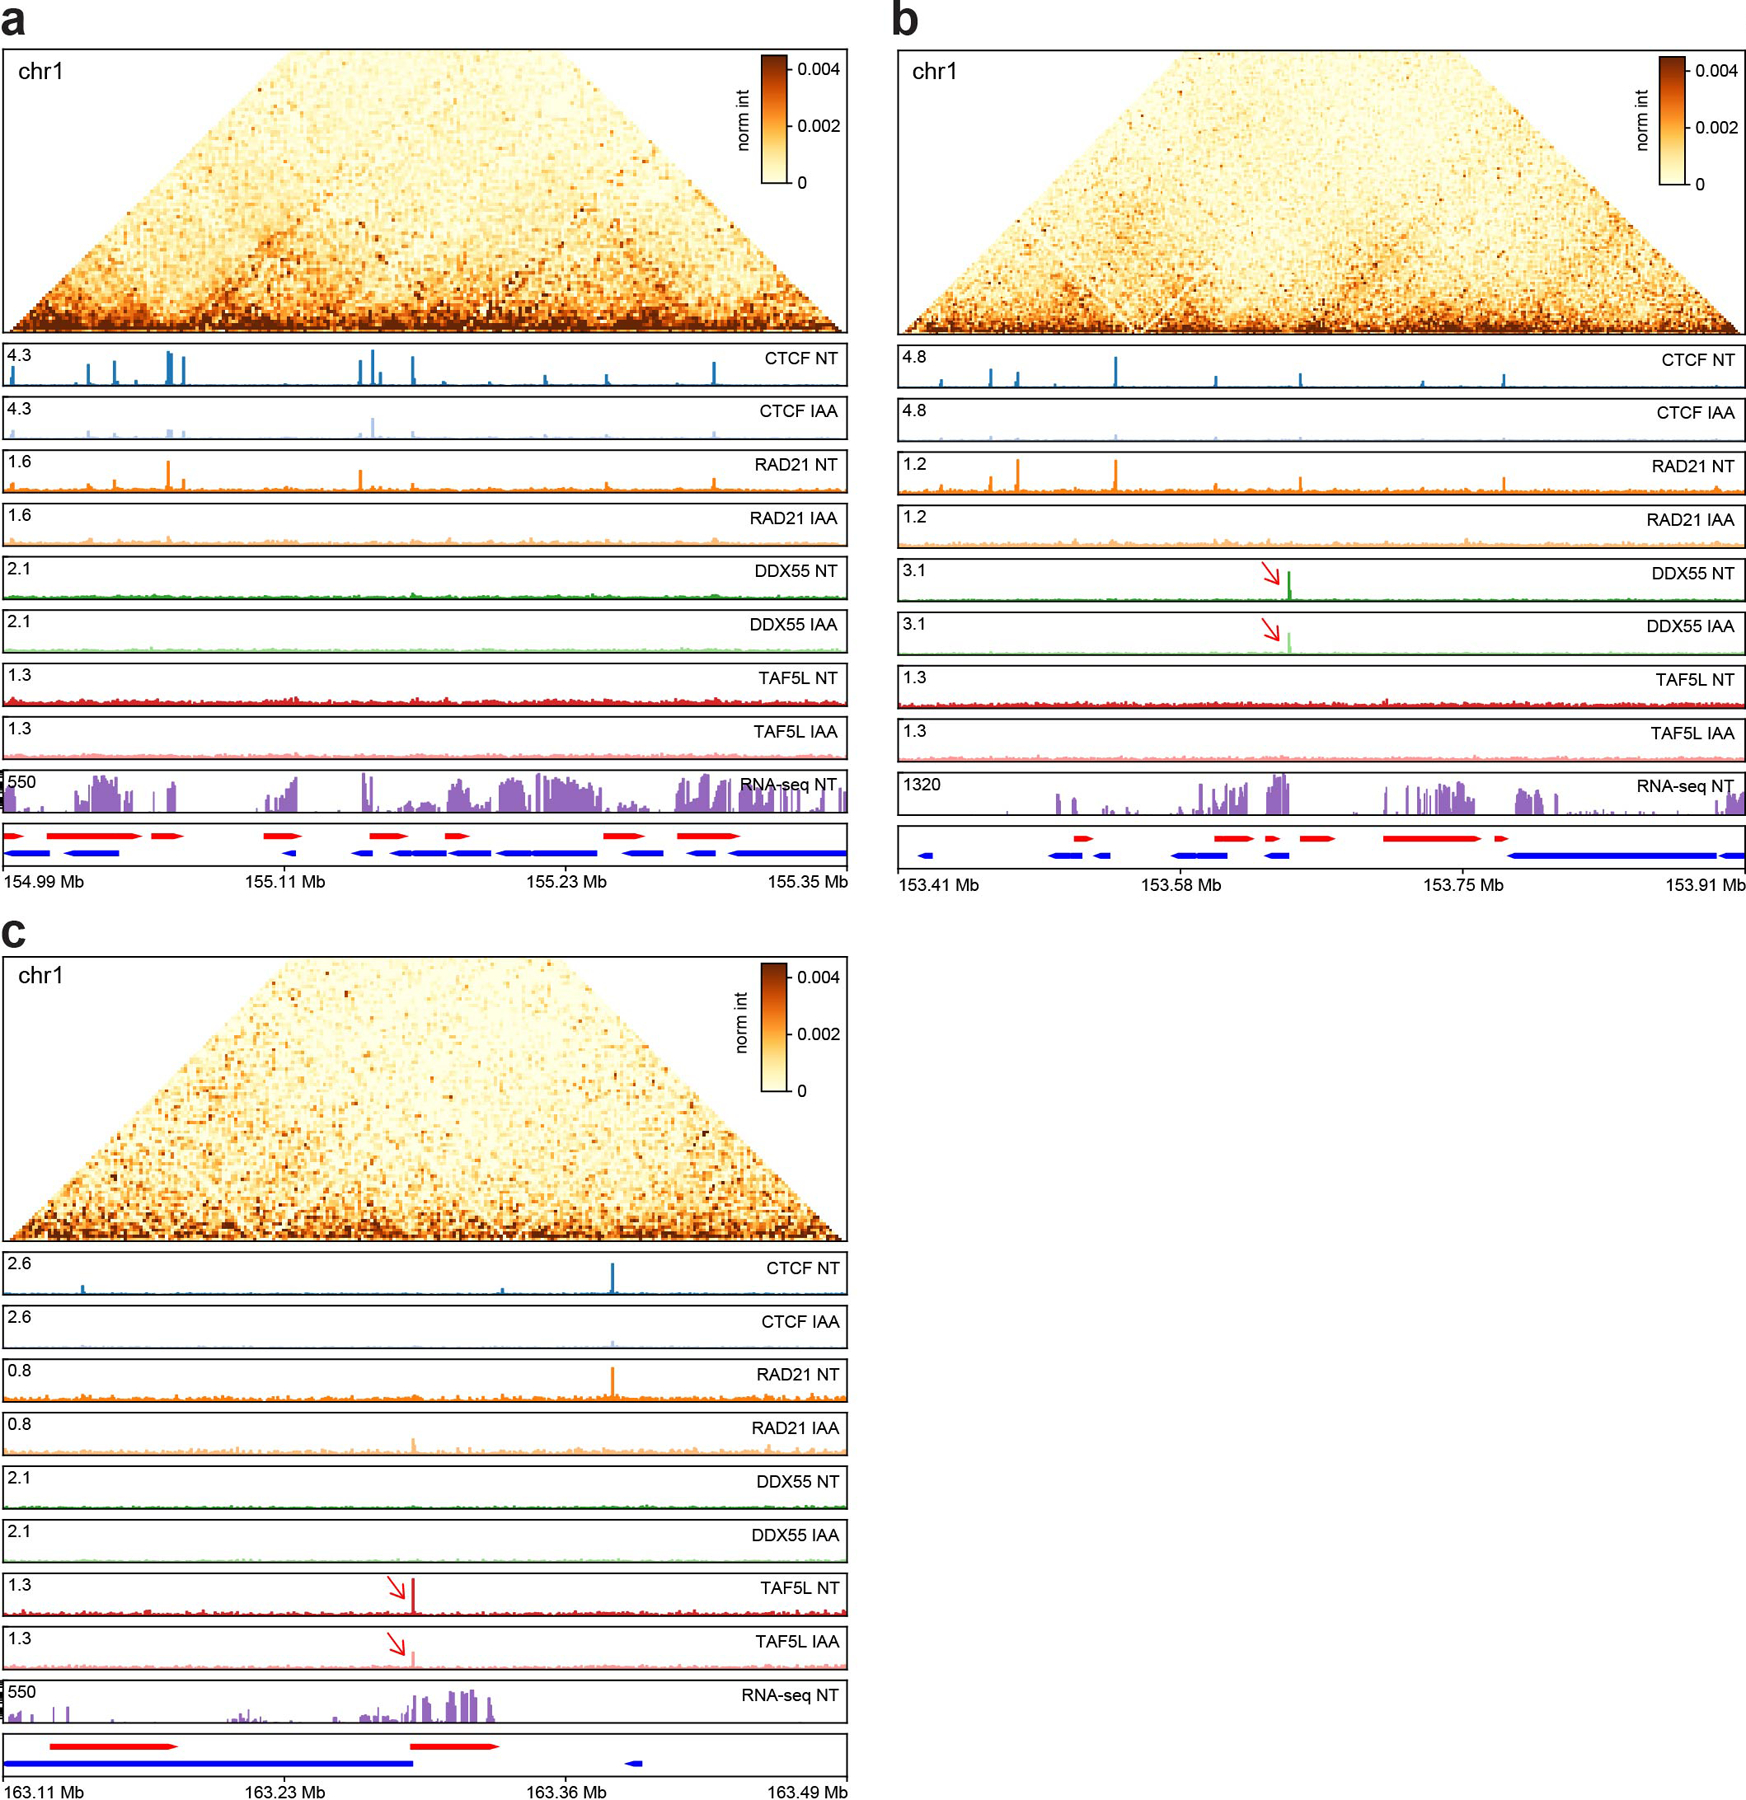
a, A genomic region on chr1 with many CTCF and RAD21 peaks.
b, A genomic region on chr1 with a DDX55 peak at an active promoter which is reduced after CTCF depletion (red arrow).
c, A genomic region in chr1 with a TAF5L peak at an active promoter which is reduced after CTCF depletion (red arrow).
Genes on the forward strand are represented in red (plus) and genes on the reverse strand are represented in blue (minus). Hi-C contact heatmaps are binned at 2kb resolution.
Extended Data Fig. 9. Characterization of DDX55 and TAF5L depletions in HAP1-CTCFdegron-TIR1 cells.
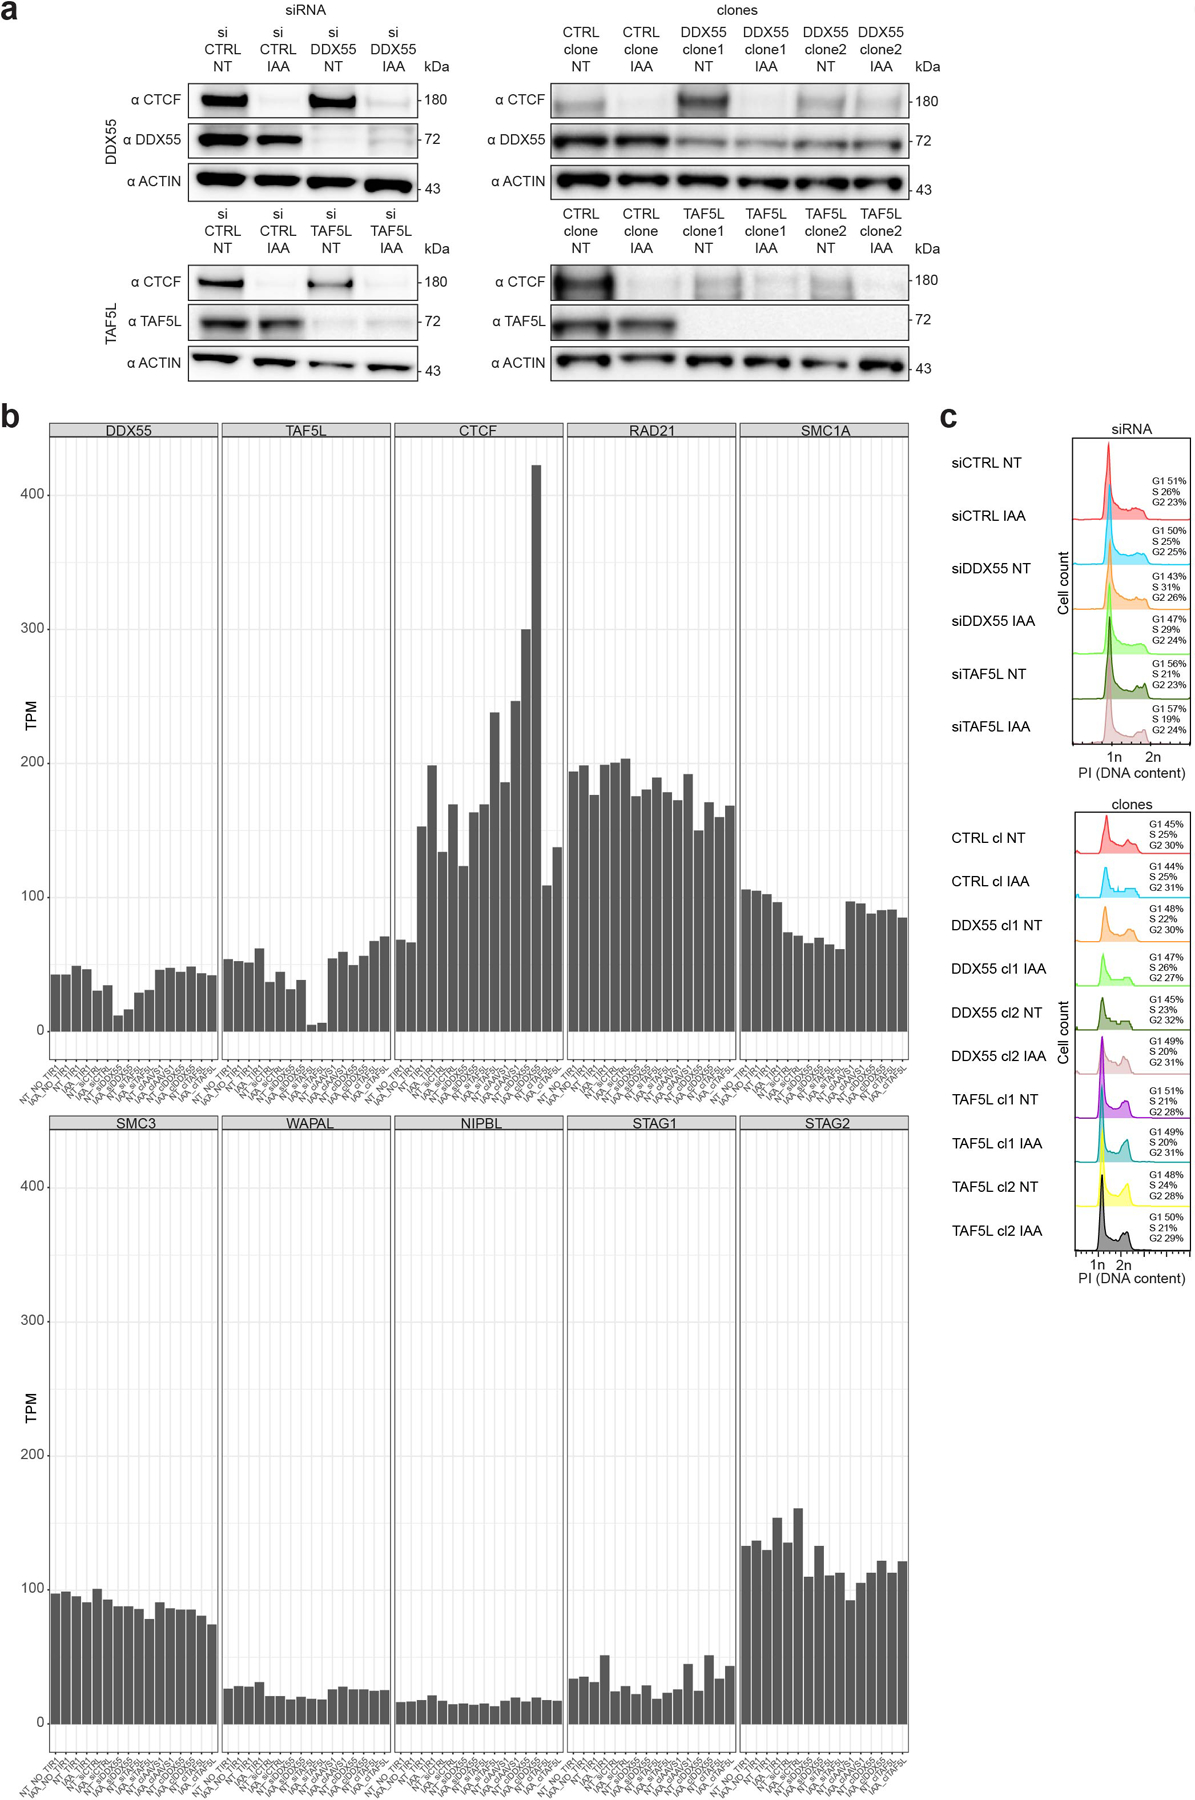
a, Western blots against CTCF, DDX55, TAF5L and β-ACTIN (loading control) showing DDX55 and TAF5L depletions, by siRNA and mutations in DDX55 and TAF5L genes, compared to siRNA controls and mutations at the AAVS1 non-coding sequence (CTRL clone).
b, RNA-seq expression (TPM) for HAP1-CTCFdegron-TIR1 cells without/with auxin (NT and IAA) treated with siRNA (siCTRL, siDDX55 and siTAF5L) and CTRL, DDX55 and TAF5L clones for key genes (DDX55, TAF5L, CTCF, RAD21, SMC1A, SMC3, WAPAL, NIPBL, STAG1 and STAG2).
c, Flow cytometry for HAP1-CTCFdegron-TIR1 cells without/with auxin (NT and IAA) with siRNA (siCTRL (control), siDDX55 and siTAF5L) (top) and CTRL (control), DDX55 and TAF5L clones (bottom) stained with Propidium Iodide (PI) to assess the DNA content for cell cycle analysis.
Extended Data Fig. 10. Effect of DDX55 and TAF5L depletions on Hi-C and RNA-seq.
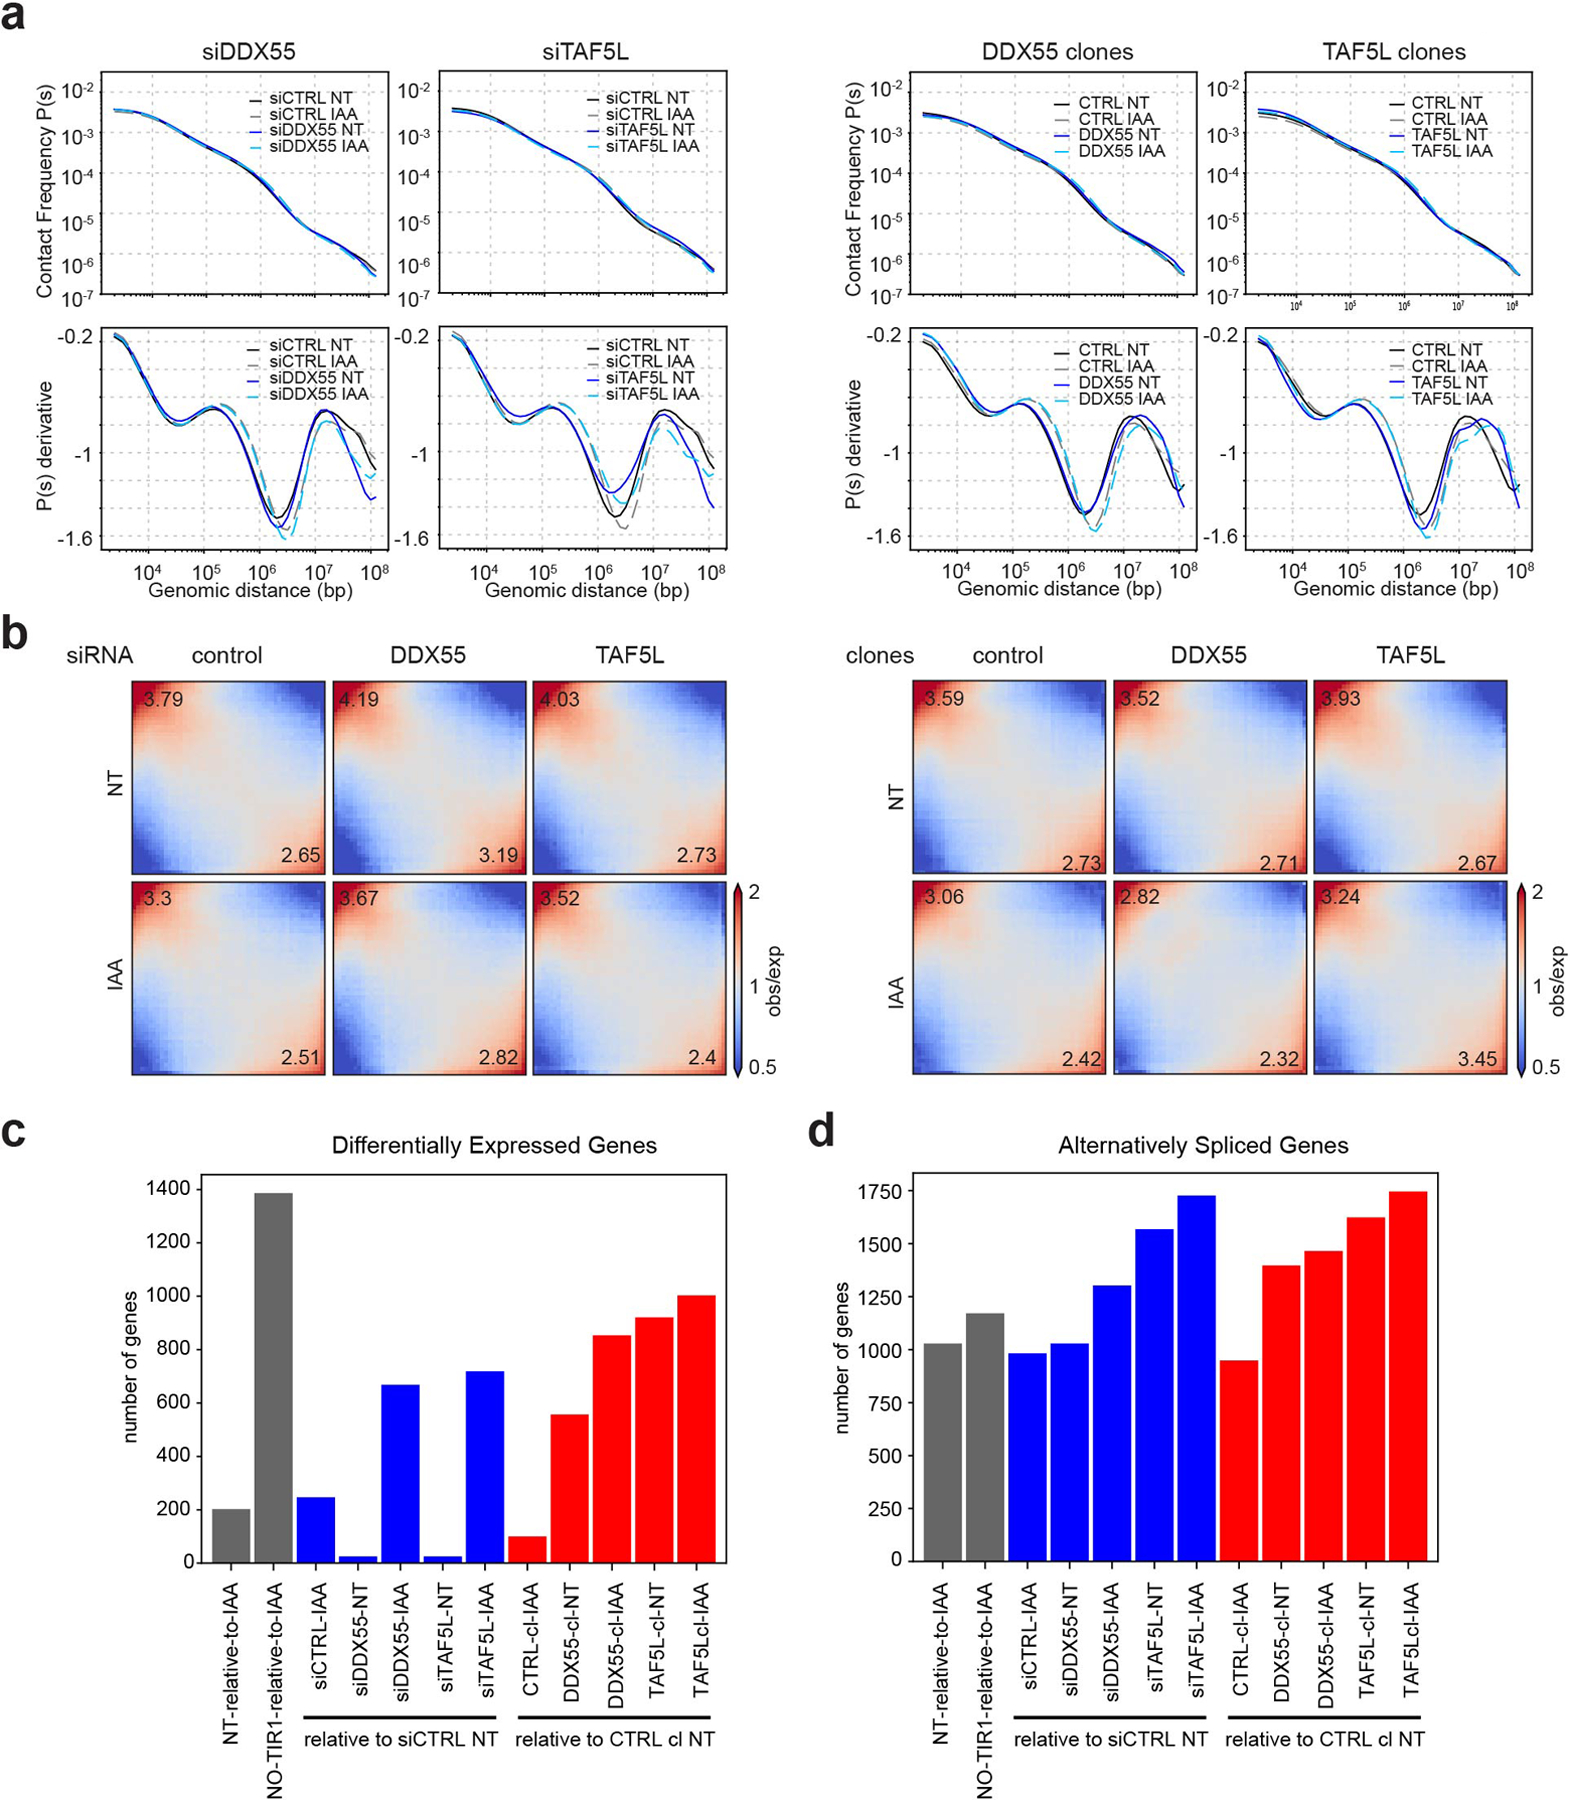
a, Hi-C contact frequency as a function of genomic distance P(s) and its derivative dP/ds for HAP1-CTCFdegron-TIR1 cells without/with auxin (NT and IAA) treated with siRNA (siCTRL, siDDX55 and siTAF5L) (top) and CTRL, DDX55 and TAF5L clones (bottom).
b, Genome-wide saddle plots of Hi-C data binned at 100kb resolution for HAP1-CTCFdegron-TIR1 cells without/with auxin (NT and IAA) treated with siRNA (siCTRL, siDDX55 and siTAF5L) (left) and CTRL, DDX55 and TAF5L clones (right). The compartment strengths are indicated in the corners.
c, Number of Differentially Expressed genes in HAP1-CTCFdegron-TIR1 cells without/with auxin (NT and IAA) treated with siRNA (siCTRL, siDDX55 and siTAF5L) and CTRL, DDX55 and TAF5L clones. Gray bars indicate the CTCF depletion, blue bars indicate the siRNA depletions and red bars indicate the clones.
d, Number of alternatively spliced genes in HAP1-CTCFdegron-TIR1 cells in absence and presence of auxin treated with siRNA (siCTRL, siDDX55 and siTAF5L) and CTRL, DDX55 and TAF5L clones. Gray bars indicate the CTCF depletion, blue bars indicate the siRNA depletions and red bars indicate the clones.
Supplementary Material
ACKNOWLEDGMENTS
We thank members of the Dekker and the Mirny laboratories as well as the members of Open Chromosome Collective for creating a collaborative atmosphere and insightful discussions. We thank the Flow Cytometry Core Facility for FACS sorting the cell lines, and the Deep Sequencing Core for the sequencing at UMass Chan Medical School. We thank Caryn Navarro for help with editing the manuscript. We thank Masato Kanemaki (National Institute of Genetics, Mishima, Japan) for sharing the HCT116-RAD21-AID cell line. We thank Elphege Nora and Benoit Bruneau (Gladstone Institutes, San Francisco, CA, USA) for sharing plasmids. This work was supported by a grant from the National Human Genome Research Institute (NHGRI) to J.D. (HG003143), and a grant from National Institute of General Medical Sciences (NIGMS) to A.A.P (GM133762). J.D. is an investigator of the Howard Hughes Medical Institute. Some of the schematic figures were created with BioRender.com.
Footnotes
COMPETING INTERESTS
The authors declare no competing interests.
SUPPLEMENTARY METHODS can be found in the Supplementary Information file.
CODE AVAILABILITY
Open2C scripts and notebooks used in this study are publicly available in GitHub: https://github.com/open2c and https://github.com/dekkerlab/ALV-repo.git. No other customized codes were developed for this study.
DATA AVAILABILITY
The datasets generated in this publication have been deposited in NCBI’s Gene Expression Omnibus and are accessible through GEO SuperSeries accession number GSE180691. This SuperSeries is composed of the following SubSeries: GSE180922 (Hi-C), GSE180713 (RNA-seq), GSE180690 (ChIP-seq), GSE180657 (CRISPR screen). The following published datasets were used in this study (Supplementary Table 7): GSE72800, GSE110133, GSE70189, GSE104334, GSE104888, GSE95015, ENCODE: https://www.encodeproject.org/experiments/ENCSR131DVD/, ENCODE: https://www.encodeproject.org/experiments/ENCSR620QNS/, ENCODE: https://www.encodeproject.org/files/ENCFF176NSX/@@download/ENCFF176NSX.bigWig, ENCODE: https://www.encodeproject.org/files/ENCFF364QXM/. Source data are provided with this paper. All other data supporting the findings of this study are available from the corresponding author on reasonable request.
REFERENCES
- 1.Dixon JR et al. Topological domains in mammalian genomes identified by analysis of chromatin interactions. Nature 485, 376–380 (2012). [DOI] [PMC free article] [PubMed] [Google Scholar]
- 2.Nora EP et al. Spatial partitioning of the regulatory landscape of the X-inactivation centre. Nature 485, 381–385 (2012). [DOI] [PMC free article] [PubMed] [Google Scholar]
- 3.Rao SSP et al. A 3D map of the human genome at kilobase resolution reveals principles of chromatin looping. Cell 159, 1665–1680 (2014). [DOI] [PMC free article] [PubMed] [Google Scholar]
- 4.Sexton T et al. Three-dimensional folding and functional organization principles of the Drosophila genome. Cell 148, 458–472 (2012). [DOI] [PubMed] [Google Scholar]
- 5.Alipour E & Marko JF Self-organization of domain structures by DNA-loop-extruding enzymes. Nucleic Acids Res 40, 11202–11212 (2012). [DOI] [PMC free article] [PubMed] [Google Scholar]
- 6.Fudenberg G et al. Formation of Chromosomal Domains by Loop Extrusion. Cell Rep 15, 2038–2049 (2016). [DOI] [PMC free article] [PubMed] [Google Scholar]
- 7.Sanborn AL et al. Chromatin extrusion explains key features of loop and domain formation in wild-type and engineered genomes. Proc. Natl. Acad. Sci. U. S. A 112, E6456–6465 (2015). [DOI] [PMC free article] [PubMed] [Google Scholar]
- 8.Nora EP et al. Targeted Degradation of CTCF Decouples Local Insulation of Chromosome Domains from Genomic Compartmentalization. Cell 169, 930–944.e22 (2017). [DOI] [PMC free article] [PubMed] [Google Scholar]
- 9.Nuebler J, Fudenberg G, Imakaev M, Abdennur N & Mirny LA Chromatin organization by an interplay of loop extrusion and compartmental segregation. Proc. Natl. Acad. Sci. U. S. A 115, E6697–E6706 (2018). [DOI] [PMC free article] [PubMed] [Google Scholar]
- 10.Wutz G et al. Topologically associating domains and chromatin loops depend on cohesin and are regulated by CTCF, WAPL, and PDS5 proteins. EMBO J 36, 3573–3599 (2017). [DOI] [PMC free article] [PubMed] [Google Scholar]
- 11.Busslinger GA et al. Cohesin is positioned in mammalian genomes by transcription, CTCF and Wapl. Nature 544, 503–507 (2017). [DOI] [PMC free article] [PubMed] [Google Scholar]
- 12.Rao SSP et al. Cohesin Loss Eliminates All Loop Domains. Cell 171, 305–320.e24 (2017). [DOI] [PMC free article] [PubMed] [Google Scholar]
- 13.Kubo N et al. Promoter-proximal CTCF binding promotes distal enhancer-dependent gene activation. Nat. Struct. Mol. Biol 28, 152–161 (2021). [DOI] [PMC free article] [PubMed] [Google Scholar]
- 14.Hnisz D et al. Activation of proto-oncogenes by disruption of chromosome neighborhoods. Science 351, 1454–1458 (2016). [DOI] [PMC free article] [PubMed] [Google Scholar]
- 15.Narendra V et al. CTCF establishes discrete functional chromatin domains at the Hox clusters during differentiation. Science 347, 1017–1021 (2015). [DOI] [PMC free article] [PubMed] [Google Scholar]
- 16.Splinter E et al. CTCF mediates long-range chromatin looping and local histone modification in the beta-globin locus. Genes Dev 20, 2349–2354 (2006). [DOI] [PMC free article] [PubMed] [Google Scholar]
- 17.de Wit E et al. CTCF Binding Polarity Determines Chromatin Looping. Mol. Cell 60, 676–684 (2015). [DOI] [PubMed] [Google Scholar]
- 18.Flavahan WA et al. Insulator dysfunction and oncogene activation in IDH mutant gliomas. Nature 529, 110–114 (2016). [DOI] [PMC free article] [PubMed] [Google Scholar]
- 19.Franke M et al. Formation of new chromatin domains determines pathogenicity of genomic duplications. Nature 538, 265–269 (2016). [DOI] [PubMed] [Google Scholar]
- 20.Lupiáñez DG et al. Disruptions of topological chromatin domains cause pathogenic rewiring of gene-enhancer interactions. Cell 161, 1012–1025 (2015). [DOI] [PMC free article] [PubMed] [Google Scholar]
- 21.Lupiáñez DG, Spielmann M & Mundlos S Breaking TADs: How Alterations of Chromatin Domains Result in Disease. Trends Genet. TIG 32, 225–237 (2016). [DOI] [PubMed] [Google Scholar]
- 22.Valton A-L & Dekker J TAD disruption as oncogenic driver. Curr. Opin. Genet. Dev 36, 34–40 (2016). [DOI] [PMC free article] [PubMed] [Google Scholar]
- 23.Luan J et al. Distinct properties and functions of CTCF revealed by a rapidly inducible degron system. Cell Rep 34, 108783 (2021). [DOI] [PMC free article] [PubMed] [Google Scholar]
- 24.Gassler J et al. A mechanism of cohesin-dependent loop extrusion organizes zygotic genome architecture. EMBO J 36, 3600–3618 (2017). [DOI] [PMC free article] [PubMed] [Google Scholar]
- 25.Crane E et al. Condensin-driven remodelling of X chromosome topology during dosage compensation. Nature 523, 240–244 (2015). [DOI] [PMC free article] [PubMed] [Google Scholar]
- 26.Campagne A et al. BAP1 complex promotes transcription by opposing PRC1-mediated H2A ubiquitylation. Nat. Commun 10, 348 (2019). [DOI] [PMC free article] [PubMed] [Google Scholar]
- 27.Bonev B et al. Multiscale 3D Genome Rewiring during Mouse Neural Development. Cell 171, 557–572.e24 (2017). [DOI] [PMC free article] [PubMed] [Google Scholar]
- 28.Szabo Q, Bantignies F & Cavalli G Principles of genome folding into topologically associating domains. Sci. Adv 5, eaaw1668 (2019). [DOI] [PMC free article] [PubMed] [Google Scholar]
- 29.Rowley MJ et al. Condensin II Counteracts Cohesin and RNA Polymerase II in the Establishment of 3D Chromatin Organization. Cell Rep 26, 2890–2903.e3 (2019). [DOI] [PMC free article] [PubMed] [Google Scholar]
- 30.Natsume T, Kiyomitsu T, Saga Y & Kanemaki MT Rapid Protein Depletion in Human Cells by Auxin-Inducible Degron Tagging with Short Homology Donors. Cell Rep 15, 210–218 (2016). [DOI] [PubMed] [Google Scholar]
- 31.Haarhuis JHI et al. The Cohesin Release Factor WAPL Restricts Chromatin Loop Extension. Cell 169, 693–707.e14 (2017). [DOI] [PMC free article] [PubMed] [Google Scholar]
- 32.Sanyal A, Lajoie BR, Jain G & Dekker J The long-range interaction landscape of gene promoters. Nature 489, 109–113 (2012). [DOI] [PMC free article] [PubMed] [Google Scholar]
- 33.Hart T & Moffat J BAGEL: a computational framework for identifying essential genes from pooled library screens. BMC Bioinformatics 17, 164 (2016). [DOI] [PMC free article] [PubMed] [Google Scholar]
- 34.Hart T, Brown KR, Sircoulomb F, Rottapel R & Moffat J Measuring error rates in genomic perturbation screens: gold standards for human functional genomics. Mol. Syst. Biol 10, 733 (2014). [DOI] [PMC free article] [PubMed] [Google Scholar]
- 35.Hart T et al. High-Resolution CRISPR Screens Reveal Fitness Genes and Genotype-Specific Cancer Liabilities. Cell 163, 1515–1526 (2015). [DOI] [PubMed] [Google Scholar]
- 36.Hart T et al. Evaluation and Design of Genome-Wide CRISPR/SpCas9 Knockout Screens. G3 Bethesda Md 7, 2719–2727 (2017). [DOI] [PMC free article] [PubMed] [Google Scholar]
- 37.Uusküla-Reimand L et al. Topoisomerase II beta interacts with cohesin and CTCF at topological domain borders. Genome Biol 17, 182 (2016). [DOI] [PMC free article] [PubMed] [Google Scholar]
- 38.Barisic D, Stadler MB, Iurlaro M & Schübeler D Mammalian ISWI and SWI/SNF selectively mediate binding of distinct transcription factors. Nature 569, 136–140 (2019). [DOI] [PMC free article] [PubMed] [Google Scholar]
- 39.Wiechens N et al. The Chromatin Remodelling Enzymes SNF2H and SNF2L Position Nucleosomes adjacent to CTCF and Other Transcription Factors. PLoS Genet 12, e1005940 (2016). [DOI] [PMC free article] [PubMed] [Google Scholar]
- 40.Valletta M et al. Exploring the Interaction between the SWI/SNF Chromatin Remodeling Complex and the Zinc Finger Factor CTCF. Int. J. Mol. Sci 21, E8950 (2020). [DOI] [PMC free article] [PubMed] [Google Scholar]
- 41.Bohla D et al. A functional insulator screen identifies NURF and dREAM components to be required for enhancer-blocking. PloS One 9, e107765 (2014). [DOI] [PMC free article] [PubMed] [Google Scholar]
- 42.Korenjak M et al. dREAM co-operates with insulator-binding proteins and regulates expression at divergently paired genes. Nucleic Acids Res 42, 8939–8953 (2014). [DOI] [PMC free article] [PubMed] [Google Scholar]
- 43.Li X et al. Chromatin boundaries require functional collaboration between the hSET1 and NURF complexes. Blood 118, 1386–1394 (2011). [DOI] [PMC free article] [PubMed] [Google Scholar]
- 44.Lei EP & Corces VG RNA interference machinery influences the nuclear organization of a chromatin insulator. Nat. Genet 38, 936–941 (2006). [DOI] [PubMed] [Google Scholar]
- 45.Yao H et al. Mediation of CTCF transcriptional insulation by DEAD-box RNA-binding protein p68 and steroid receptor RNA activator SRA. Genes Dev 24, 2543–2555 (2010). [DOI] [PMC free article] [PubMed] [Google Scholar]
- 46.Baker SP & Grant PA The SAGA continues: expanding the cellular role of a transcriptional co-activator complex. Oncogene 26, 5329–5340 (2007). [DOI] [PMC free article] [PubMed] [Google Scholar]
- 47.Kagey MH et al. Mediator and cohesin connect gene expression and chromatin architecture. Nature 467, 430–435 (2010). [DOI] [PMC free article] [PubMed] [Google Scholar]
- 48.Phillips-Cremins JE et al. Architectural protein subclasses shape 3D organization of genomes during lineage commitment. Cell 153, 1281–1295 (2013). [DOI] [PMC free article] [PubMed] [Google Scholar]
- 49.Ramasamy S et al. The Mediator complex regulates enhancer-promoter interactions 2022.06.15.496245 Preprint at 10.1101/2022.06.15.496245 (2022). [DOI] [PMC free article] [PubMed] [Google Scholar]
- 50.Bartha I, di Iulio J, Venter JC & Telenti A Human gene essentiality. Nat. Rev. Genet 19, 51–62 (2018). [DOI] [PubMed] [Google Scholar]
- 51.Rinzema NJ et al. Building regulatory landscapes: enhancer recruits cohesin to create contact domains, engage CTCF sites and activate distant genes 2021.10.05.463209 10.1101/2021.10.05.463209v1 (2021) doi:. [DOI] [PMC free article] [PubMed] [Google Scholar]
- 52.Brandão HB et al. RNA polymerases as moving barriers to condensin loop extrusion. Proc. Natl. Acad. Sci. U. S. A 116, 20489–20499 (2019). [DOI] [PMC free article] [PubMed] [Google Scholar]
- 53.Lengronne A et al. Cohesin relocation from sites of chromosomal loading to places of convergent transcription. Nature 430, 573–578 (2004). [DOI] [PMC free article] [PubMed] [Google Scholar]
- 54.Glynn EF et al. Genome-wide mapping of the cohesin complex in the yeast Saccharomyces cerevisiae. PLoS Biol 2, E259 (2004). [DOI] [PMC free article] [PubMed] [Google Scholar]
- 55.Banigan EJ et al. Transcription shapes 3D chromatin organization by interacting with loop-extruding cohesin complexes 2022.01.07.475367 Preprint at 10.1101/2022.01.07.475367 (2022). [DOI] [PMC free article] [PubMed] [Google Scholar]
- 56.Liu NQ et al. WAPL maintains a cohesin loading cycle to preserve cell-type-specific distal gene regulation. Nat. Genet 53, 100–109 (2021). [DOI] [PMC free article] [PubMed] [Google Scholar]
- 57.Cargill M, Venkataraman R & Lee S DEAD-Box RNA Helicases and Genome Stability. Genes 12, 1471 (2021). [DOI] [PMC free article] [PubMed] [Google Scholar]
- 58.Liu Z, Scannell DR, Eisen MB & Tjian R Control of embryonic stem cell lineage commitment by core promoter factor, TAF3. Cell 146, 720–731 (2011). [DOI] [PMC free article] [PubMed] [Google Scholar]
- 59.Schwarzer W et al. Two independent modes of chromatin organization revealed by cohesin removal. Nature 551, 51–56 (2017). [DOI] [PMC free article] [PubMed] [Google Scholar]
- 60.Despang A et al. Functional dissection of the Sox9-Kcnj2 locus identifies nonessential and instructive roles of TAD architecture. Nat. Genet 51, 1263–1271 (2019). [DOI] [PubMed] [Google Scholar]
- 61.Alharbi AB et al. Ctcf haploinsufficiency mediates intron retention in a tissue-specific manner. RNA Biol 18, 93–103 (2021). [DOI] [PMC free article] [PubMed] [Google Scholar]
- 62.Nanavaty V et al. DNA Methylation Regulates Alternative Polyadenylation via CTCF and the Cohesin Complex. Mol. Cell 78, 752–764.e6 (2020). [DOI] [PMC free article] [PubMed] [Google Scholar]
- 63.Ruiz-Velasco M et al. CTCF-Mediated Chromatin Loops between Promoter and Gene Body Regulate Alternative Splicing across Individuals. Cell Syst 5, 628–637.e6 (2017). [DOI] [PubMed] [Google Scholar]
- 64.Shukla S et al. CTCF-promoted RNA polymerase II pausing links DNA methylation to splicing. Nature 479, 74–79 (2011). [DOI] [PMC free article] [PubMed] [Google Scholar]
- 65.Xiao JY, Hafner A & Boettiger AN How subtle changes in 3D structure can create large changes in transcription. eLife 10, e64320 (2021). [DOI] [PMC free article] [PubMed] [Google Scholar]
- 66.Zuin J et al. Nonlinear control of transcription through enhancer-promoter interactions. Nature 604, 571–577 (2022). [DOI] [PMC free article] [PubMed] [Google Scholar]
METHODS-ONLY REFERENCES
- 67.Sanz LA et al. Prevalent, Dynamic, and Conserved R-Loop Structures Associate with Specific Epigenomic Signatures in Mammals. Mol. Cell 63, 167–178 (2016). [DOI] [PMC free article] [PubMed] [Google Scholar]
- 68.Fong N et al. Effects of Transcription Elongation Rate and Xrn2 Exonuclease Activity on RNA Polymerase II Termination Suggest Widespread Kinetic Competition. Mol. Cell 60, 256–267 (2015). [DOI] [PMC free article] [PubMed] [Google Scholar]
- 69.Ran FA et al. Genome engineering using the CRISPR-Cas9 system. Nat. Protoc 8, 2281–2308 (2013). [DOI] [PMC free article] [PubMed] [Google Scholar]
- 70.Hsiau T et al. Inference of CRISPR Edits from Sanger Trace Data. bioRxiv 251082 (2019) doi: 10.1101/251082. [DOI] [PubMed] [Google Scholar]
- 71.Hansen AS et al. Distinct Classes of Chromatin Loops Revealed by Deletion of an RNA-Binding Region in CTCF. Mol. Cell 76, 395–411.e13 (2019). [DOI] [PMC free article] [PubMed] [Google Scholar]
Associated Data
This section collects any data citations, data availability statements, or supplementary materials included in this article.
Supplementary Materials
Data Availability Statement
The datasets generated in this publication have been deposited in NCBI’s Gene Expression Omnibus and are accessible through GEO SuperSeries accession number GSE180691. This SuperSeries is composed of the following SubSeries: GSE180922 (Hi-C), GSE180713 (RNA-seq), GSE180690 (ChIP-seq), GSE180657 (CRISPR screen). The following published datasets were used in this study (Supplementary Table 7): GSE72800, GSE110133, GSE70189, GSE104334, GSE104888, GSE95015, ENCODE: https://www.encodeproject.org/experiments/ENCSR131DVD/, ENCODE: https://www.encodeproject.org/experiments/ENCSR620QNS/, ENCODE: https://www.encodeproject.org/files/ENCFF176NSX/@@download/ENCFF176NSX.bigWig, ENCODE: https://www.encodeproject.org/files/ENCFF364QXM/. Source data are provided with this paper. All other data supporting the findings of this study are available from the corresponding author on reasonable request.


