

Keywords: acute respiratory distress syndrome (ARDS), computed tomography (CT), dynamic contrast-enhanced (DCE), pulmonary blood flow (PBF), pulmonary perfusion
Abstract
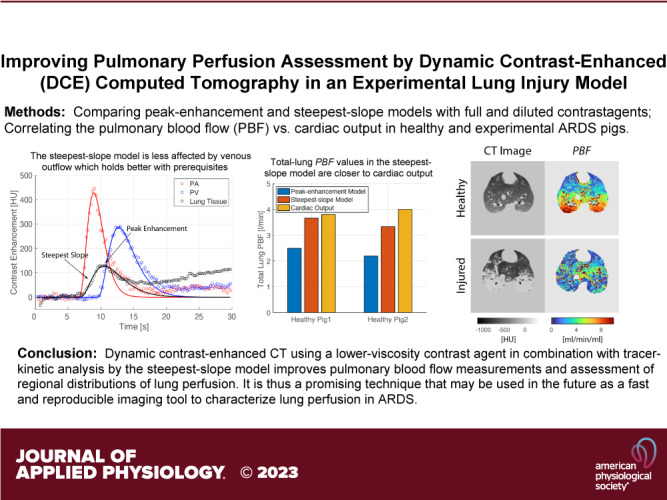
Pulmonary perfusion has been poorly characterized in acute respiratory distress syndrome (ARDS). Optimizing protocols to measure pulmonary blood flow (PBF) via dynamic contrast-enhanced (DCE) computed tomography (CT) could improve understanding of how ARDS alters pulmonary perfusion. In this study, comparative evaluations of injection protocols and tracer-kinetic analysis models were performed based on DCE-CT data measured in ventilated pigs with and without lung injury. Ten Yorkshire pigs (five with lung injury, five healthy) were anesthetized, intubated, and mechanically ventilated; lung injury was induced by bronchial hydrochloric acid instillation. Each DCE-CT scan was obtained during a 30-s end-expiratory breath-hold. Reproducibility of PBF measurements was evaluated in three pigs. In eight pigs, undiluted and diluted Isovue-370 were separately injected to evaluate the effect of contrast viscosity on estimated PBF values. PBF was estimated with the peak-enhancement and the steepest-slope approach. Total-lung PBF was estimated in two healthy pigs to compare with cardiac output measured invasively by thermodilution in the pulmonary artery. Repeated measurements in the same animals yielded a good reproducibility of computed PBF maps. Injecting diluted isovue-370 resulted in smaller contrast-time curves in the pulmonary artery (P < 0.01) and vein (P < 0.01) without substantially diminishing peak signal intensity (P = 0.46 in the pulmonary artery) compared with the pure contrast agent since its viscosity is closer to that of blood. As compared with the peak-enhancement model, PBF values estimated by the steepest-slope model with diluted contrast were much closer to the cardiac output (R2 = 0.82) as compared with the peak-enhancement model. DCE-CT using the steepest-slope model and diluted contrast agent provided reliable quantitative estimates of PBF.
NEW & NOTEWORTHY Dynamic contrast-enhanced CT using a lower-viscosity contrast agent in combination with tracer-kinetic analysis by the steepest-slope model improves pulmonary blood flow measurements and assessment of regional distributions of lung perfusion.
INTRODUCTION
Normal gas exchange occurs through the regional matching of pulmonary ventilation and perfusion (1). In acute respiratory distress syndrome (ARDS), inflammatory lung injury results in ventilation-perfusion mismatching and severe hypoxemia (2). However, it remains unknown if changes in regional perfusion significantly contribute to ARDS progression. Treatment of ARDS to date has focused primarily on mitigating abnormal ventilation (3, 4), but the clinical impact of abnormal perfusion has been underinvestigated (5, 6) due to difficulty in measuring pulmonary blood flow (PBF) distributions.
Pulmonary perfusion imaging has been used in experimental and clinical research but the techniques have different limitations (7). Nuclear imaging techniques enable assessments of regional PBF but require not only a suitable infrastructure but also prolonged acquisition times complicating assessments (8). Dynamic contrast-enhanced (DCE) magnetic resonance imaging provides limited structural information of lung parenchyma due to artifacts from air-tissue interfaces and motion. It also requires special equipment in mechanically ventilated subjects (9). Dual-energy computed tomography (DECT) generates high-resolution static images of blood volume, which is correlated with PBF in healthy subjects (10). This approach is feasible in ARDS patients (11), but mutating conditions (e.g., changing cardiac output, evolving disease) may alter the quantitative relationship of blood volume and flow (12).
DCE-CT captures first-pass tracer kinetics in the lungs allowing the assessment of regional PBF (13). There are various approaches to tracer-kinetic analysis. One model quantifies blood flow from the peak enhancement of CT intensities measured after contrast injection (14) and has been adapted to pulmonary CT studies (15–17). Alternatively, measuring the steepest-slope of the contrast enhancement is widely used to assess perfusion of solid organs and lung tumors (18–20). Since the underlying tracer-kinetic assumptions of both approaches differ from each other, the choice of approach may affect measured flow values.
We hypothesized that DCE-CT offers a promising approach to quantitative assessment of lung perfusion, for example, with regard to the examination of ARDS, but that it requires careful optimization of the contrast agent used, its administration, and of the tracer-kinetic models for data analysis. It was thus the aim of the present study to evaluate regional and total-lung PBF estimated by the peak-enhancement and steepest-slope model against a reference and to assess the effects of tracer viscosity and injection rate on PBF measurements in an animal model of ARDS.
MATERIALS AND METHODS
Animal Preparation and Lung Injury
Animal experiments were approved by the Institutional Animal Care and Use Committee and were performed on 10 Yorkshire pigs (31.8 ± 2.9 kg, 5 males, 5 females). They were included in longitudinal imaging studies and randomized to lung injury (n = 5) and healthy controls (n = 5).
Pigs were anesthetized, intubated with a 6.5-mm cuffed endotracheal tube, and mechanically ventilated (Servo-I Maquet, Solna, Sweden). Anesthesia was induced via intramuscular injection of ketamine and xylazine and maintained by continuous intravenous infusion of ketamine, midazolam, and fentanyl. Propofol was used as an adjunct in case of inadequate anesthesia. The femoral artery was catheterized for blood pressure and arterial blood gas monitoring. An 8-Fr pulmonary artery catheter (Edwards Lifesciences, Irvine, CA) was floated in the right internal jugular vein to measure vascular pressures and cardiac output by semicontinuous thermodilution. All vascular cannulations were ultrasound-guided (Butterfly iQ, Guilford, CT). Urine output was collected via bladder catheterization (in females) or open cystostomy (in males) and recorded hourly. Blood temperature was actively maintained between 37.5°C and 39°C with a circulating water pad. Airway pressures, flows, and volumes were monitored through the ventilator display; inspiratory plateau pressure and respiratory compliance were monitored. All animals received intravenous hydration with 0.9% saline (10–20 mL/kg bolus and 1 mL/kg/h infusion). Hypotension was treated with intravenous fluid bolus administration followed by epinephrine infusion if needed. Animals were temporarily paralyzed with vecuronium during CT scans to avoid motion artifacts.
In the lung injury group, 3.5 mL/kg of HCl (pH 1.0) was divided into 5-mL aliquots and instilled via bronchoscopy into the lobar bronchi (∼10 injections per lung) to ensure symmetric distribution of the acid (21). After HCl injection, the animals were stabilized for 2 h while ventilated supine, followed by CT imaging. Control animals were imaged after 2 h of stabilization but no HCl was injected.
DCE Imaging Protocol
Animals were imaged in supine position and paralyzed to avoid motion artifacts. Before scanning, a lung recruitment maneuver was followed by volume-controlled ventilation with positive end-expiratory pressure (PEEP) 3 cmH2O, tidal volume (VT) 12 mL/kg, and respiratory rate 25 bpm for 15 min. These high-volume low-PEEP ventilator settings were part of our standardized imaging protocol to study the effects of tidal pulmonary stretch on lung injury (21). Cardiac output was recorded immediately before each image acquisition.
DCE-CT data were acquired during a 30-s end-expiratory breath-hold from cross-sectional slabs of the lungs (57.6 mm) at a high-end CT system (SOMATOM Force; Siemens Healthineers, Forchheim, Germany) with 4 frames per second (gantry rotation time, 0.25 s), a tube voltage of 80 kVp, and a tube current of 200 mAs. For each measurement, either 16 mL of the nonionic, extracellular contrast agent Isovue-370 (Bracco, Milan, Italy) or of Isovue-370 diluted in 0.9% physiological saline solution (ratio 3:2) was administered through the jugular vein introducer 5 s after the start of dynamic image acquisition. We chose to dilute Isovue-370 with saline at 3:2 ratio to match the viscosity of Isovue-250, which, at 3–5.1 cP, is close to blood.
In eight pigs, imaging slabs were manually selected proximally to the diaphragm apex. As detailed in Table 1, between 2 and 4 DCE-CT measurements were performed in each of these animals in one session after injection of Isovue-370 at two different concentrations (pure and diluted) and administration rates (4 mL/s in 4 s, 8 mL/L in 2 s). Multiple contrast injections to an animal were separated by a distribution time of 10 min, after which it can be assumed that the contrast concentration from the preceding injection(s) did not vary in time during the subsequent DCE-measurement over 30 s. As summarized in Fig. 1 and Table 1, the realized study concept made it possible to analyze a total of 23 measurements. The study was focused on contrast agent viscosity and the model used for tracer-kinetic analysis, but we were able to make additional preliminary observations regarding different factors affecting the kinetics of the injected contrast agent.
Table 1.
Summary of the 29 DCE-CT measurements performed in 10 pigs with varying contrast agent dilutions and injection rates as well as their use for different purposes (investigation of reproducibility, effect of full vs. diluted contrast, slow vs. fast contrast injection, estimation of whole lung PBF values)
| Measurements |
Purpose |
|||||||
|---|---|---|---|---|---|---|---|---|
| #1 | #2 | #3 | #4 | Reproducibility | Effect of full vs. diluted contrast | Effect of contrast injection rate | Whole lung PBF vs. cardiac output | |
| Injured pig #1 | Diluted contrast, 4 mL/s | Full contrast, 4 mL/s | Diluted contrast, 8 mL/s | Full contrast, 8 mL/s | x | x | ||
| Injured pig #2 | Diluted contrast, 4 mL/s | Full contrast, 4 mL/s | x | |||||
| Injured pig #3 | Diluted contrast, 4 mL/s | Full contrast, 4 mL/s | x | |||||
| Injured pig #4 | Diluted contrast, 4 mL/s | Full contrast, 4 mL/s | Diluted contrast, 4 mL/s | x | x | |||
| Injured pig #5 | Diluted contrast, 4 mL/s | Full contrast, 4 mL/s | Diluted contrast, 4 mL/s | x | x | |||
| Healthy pig #1 | Diluted contrast, 4 mL/s | Full contrast, 4 mL/s | Diluted contrast, 8 mL/s | Full contrast, 8 mL/s | x | x | ||
| Healthy pig #2 | Diluted contrast, 4 mL/s | Full contrast, 4 mL/s | x | |||||
| Healthy pig #3 | Diluted contrast, 4 mL/s | Full contrast, 4 mL/s | Diluted contrast, 4 mL/s | x | x | |||
| Healthy pig #4 | Diluted contrast, 4 mL/s, three slabs | x | ||||||
| Healthy pig #5 | Diluted contrast, 4 mL/s, three slabs | x | ||||||
Multiple measurements were carried out in eight pigs in one imaging slab and in two pigs in three adjacent slabs covering the entire lung parenchyma. DCE-CT, dynamic contrast-enhanced computed tomography; PBF, pulmonary blood flow.
Figure 1.

DCE measurements and comparisons are schematized. Eight pigs underwent comparisons of tracer-kinetic models (performed for both contrast dilutions) and contrast dilutions in one slab of tissue. Two different contrast injection rates and reproducibility were assessed in small subsets of these animals. Two separate animals were used to estimate the total-lung PBF from DCE measurements in three slabs covering the entire lung parenchyma. DCE, dynamic contrast-enhanced measurements; PBF, regional pulmonary blood flow per voxel volume.
In the remaining two healthy animals, DEC-CT data were acquired from three slabs directly adjacent to each other (diluted Isovue-370, 4 mL/s in 4 s, 10 min time lag) to completely cover the lung and to estimate total-lung PBF.
Image Preprocessing
Images of each pulmonary slab were reconstructed with a resolution of 1 × 1 × 2 mm3 using iterative reconstruction with a body kernel (BR36). Deep learning was used to segment lung parenchyma (22), with manual refinement as needed. The pulmonary artery and veins were manually segmented to the lobar branches. Voxels with a contrast enhancement above 300 HU were excluded as larger vascular structures. Then, all sequential CT frames were matched using ANTs (23) to minimize cardiac motion artifacts. The resulting 4-D image data sets were then resized to 2 × 2 × 4 mm3 voxels to balance the signal-to-noise ratio with partial volume effects. All further image analysis was performed using MATLAB (MathWorks, Natick, MA, Release 2022a). Contrast-time curves were passed through a 1-Hz low-pass filter to reduce cardiac artifacts and through a 3-point median filter to further decrease noise. Then, a γ-variate function was fitted to the contrast-time curves using the Levenberg-Marquardt least square algorithm, where data below 50% of the peak value were neglected in the down-slope phase to improve up-slope fitting (17). Voxels with a contrast enhancement lower than 10 Hounsfield units (HU) or unrecognizable peak values were set to zero perfusion. No further spatial smoothening was applied to images throughout processing.
Tracer-Kinetic Analysis
Two different tracer-kinetic models were used to estimate the pulmonary blood flow (PBF):
The peak-enhancement or Mullani–Gould method (14) approximates the pulmonary blood flow per voxel volume (Vvoxel) as the ratio of peak tissue enhancement after contrast injection (Ctissue.peak) to the integral over the contrast-time curve in the pulmonary artery until the time at which the maximum of the tissue peak occurs (.
This holds under the presumption that the contrast outflow from lung tissue can be neglected until the peak appears (14). In practical implementation, however, the problem arises that there is a time lag between contrast-time courses observed in a large tissue-feeding artery and in the tissue regions considered, so the upper limit of integration of the arterial input function is not clearly defined. Therefore, we used the total area under the γ-variate function fitted to the measured arterial input as a well-defined surrogate, as is common in recent DCE-CT studies (16, 17, 19, 24).
The steepest-slope or Miles method (18) approximates the blood flow per voxel volume as the maximum up-slope gradient of the concentration-time curve in lung tissue (Max{gradient.tissue}) divided by pulmonary artery peak enhancement (CPA.peak). This model assumes that the contrast outflow from lung tissue can be neglected until the steepest gradient.
In contrast to the peak-enhancement method, the time delay between the arterial input function and the tissue curve is irrelevant here since CPA.peak is precisely defined without reference to tissue curves.
To assess the effect of the viscosity and injection rate of the contrast agent on the shape of the contrast-time curves measured in the PA and PV, the first moment of the respective fitted γ-variate functions, G(t) ∼ (t – AT)α exp[–(t – AT)/β] with the fit parameters a, b, and AT were computed, where AT is the appearance (or lag) time. Taking AT into account, the mean transit time (MTT) of the contrast agent is given by MTT = (1 + α)β + AT (25). Accordingly, the pulmonary transit time is PTT ≅ MTTPV – PTTPA.
Based on the estimated regional PBF values, normalized values per gram of lung tissue, PBFm, were computed. To this end, the mass density of lung tissue, ρL, was determined from the measured corresponding CT density of lung tissue, CTL (in Hounsfield units, HU) by
with ρw = 0.993 g/cm3 the density of water. This relation holds in a very good approximation since the mass attenuation coefficients of lung tissue and water are nearly identical for 80 kV X-ray spectra.
STATISTICAL ANALYSIS
Statistical analysis was performed using SigmaPlot (Version 13.0; Systat Software GmbH, Erkrath, Germany). The Wilcoxon signed-rank test for paired samples, which does not require assuming normality and equal variance, was used to test differences in the central tendency of parameters characterizing tissue microcirculation. Differences in the central tendency between the cardiac output of healthy and injured pigs were tested by the Mann-Whitney rank test for unpaired samples. A P value of <0.05 was used as the threshold for significance. Correlations between cardiac output and PBF were quantified by the square of the Spearman’s correlation coefficient, R2, determined by linear regression analyses. Voxelwise correspondence between PBF scans in the same animal under otherwise identical measurement conditions was evaluated by a Bland-Altman analysis.
RESULTS
Representative enhancement-time curves of single voxels derived in the anterior and posterior regions of a healthy and an injured pig are presented in Fig. 2. They exemplify that measured data in the upward phase can be described quite well by a γ-variate function.
Figure 2.

Representative enhancement-time curves of single voxels with a size of 2 × 2 × 4 mm3 in a randomly selected anterior and posterior region of one healthy (top) and one injured (bottom) pig. Precontrast CT densities (in HU) are given above the plots. In the injured animal, lung regions with higher CT densities showed less enhancement. Steepest gradients in the up-slope phase that were required for the estimation of PBF values by the steepest-slope model were determined from the γ-variate functions (red curves) fitted to the contrast-time curves. CT, computed tomography; PBF, regional pulmonary blood flow per voxel volume.
A voxel-by-voxel correlation between PBF maps computed from repetitive DCE scans performed on the same pigs (one healthy, two injured; measurements #1 and #3; injection of diluted Isovue-370 with 4 mL/s in 4 s, steepest-slope method) are presented in Fig. 3. Bland-Altman analyses demonstrated an excellent correlation in the healthy animal (mean relative difference of PBF values estimated from measurements #1 and #3, −5%;) and in one injured animal (mean −1%). In contrast, slight but systematic differences were observed in the second injured animal (15%), possibly related to varied hemodynamics between measurements.
Figure 3.

Repeated PBF measurements (#1 and #3; diluted contrast agent; injection, 4 mL/s in 4 s) were analyzed with the steepest-slope method in three pigs, one with a healthy and two with injured lungs. PBF maps are shown in the left panel. Bland–Altman plots of corresponding voxel PBF values between images are plotted in the right panel. The mean value of differences in the PBF values are given at the right edge; the agreement interval, within which 95% of the differences lie, are indicated by the dashed lines. There were slight systematic deviations in one of the injured pigs (bottom). PBF, regional pulmonary blood flow per voxel volume.
Since both pharmacokinetic models assume that there is no contrast outflow during the initial phase of contrast enhancement, they are sensitive to the viscosity and injection rate of the administered contrast agent. The effect of injection rate was explored in one healthy and one injured animal both for pure and diluted Isovue-370. As the Bland-Altman plots shown in Fig. 4, the peak-enhancement model yielded systematically higher regional PBF values for the higher as compared with the lower injection rate in both healthy (mean PBF difference, 16% vs. 2%) and the injured (mean difference, 11% vs. 6%) pig and thus depends more strongly on the administration scheme of the contrast agent.
Figure 4.
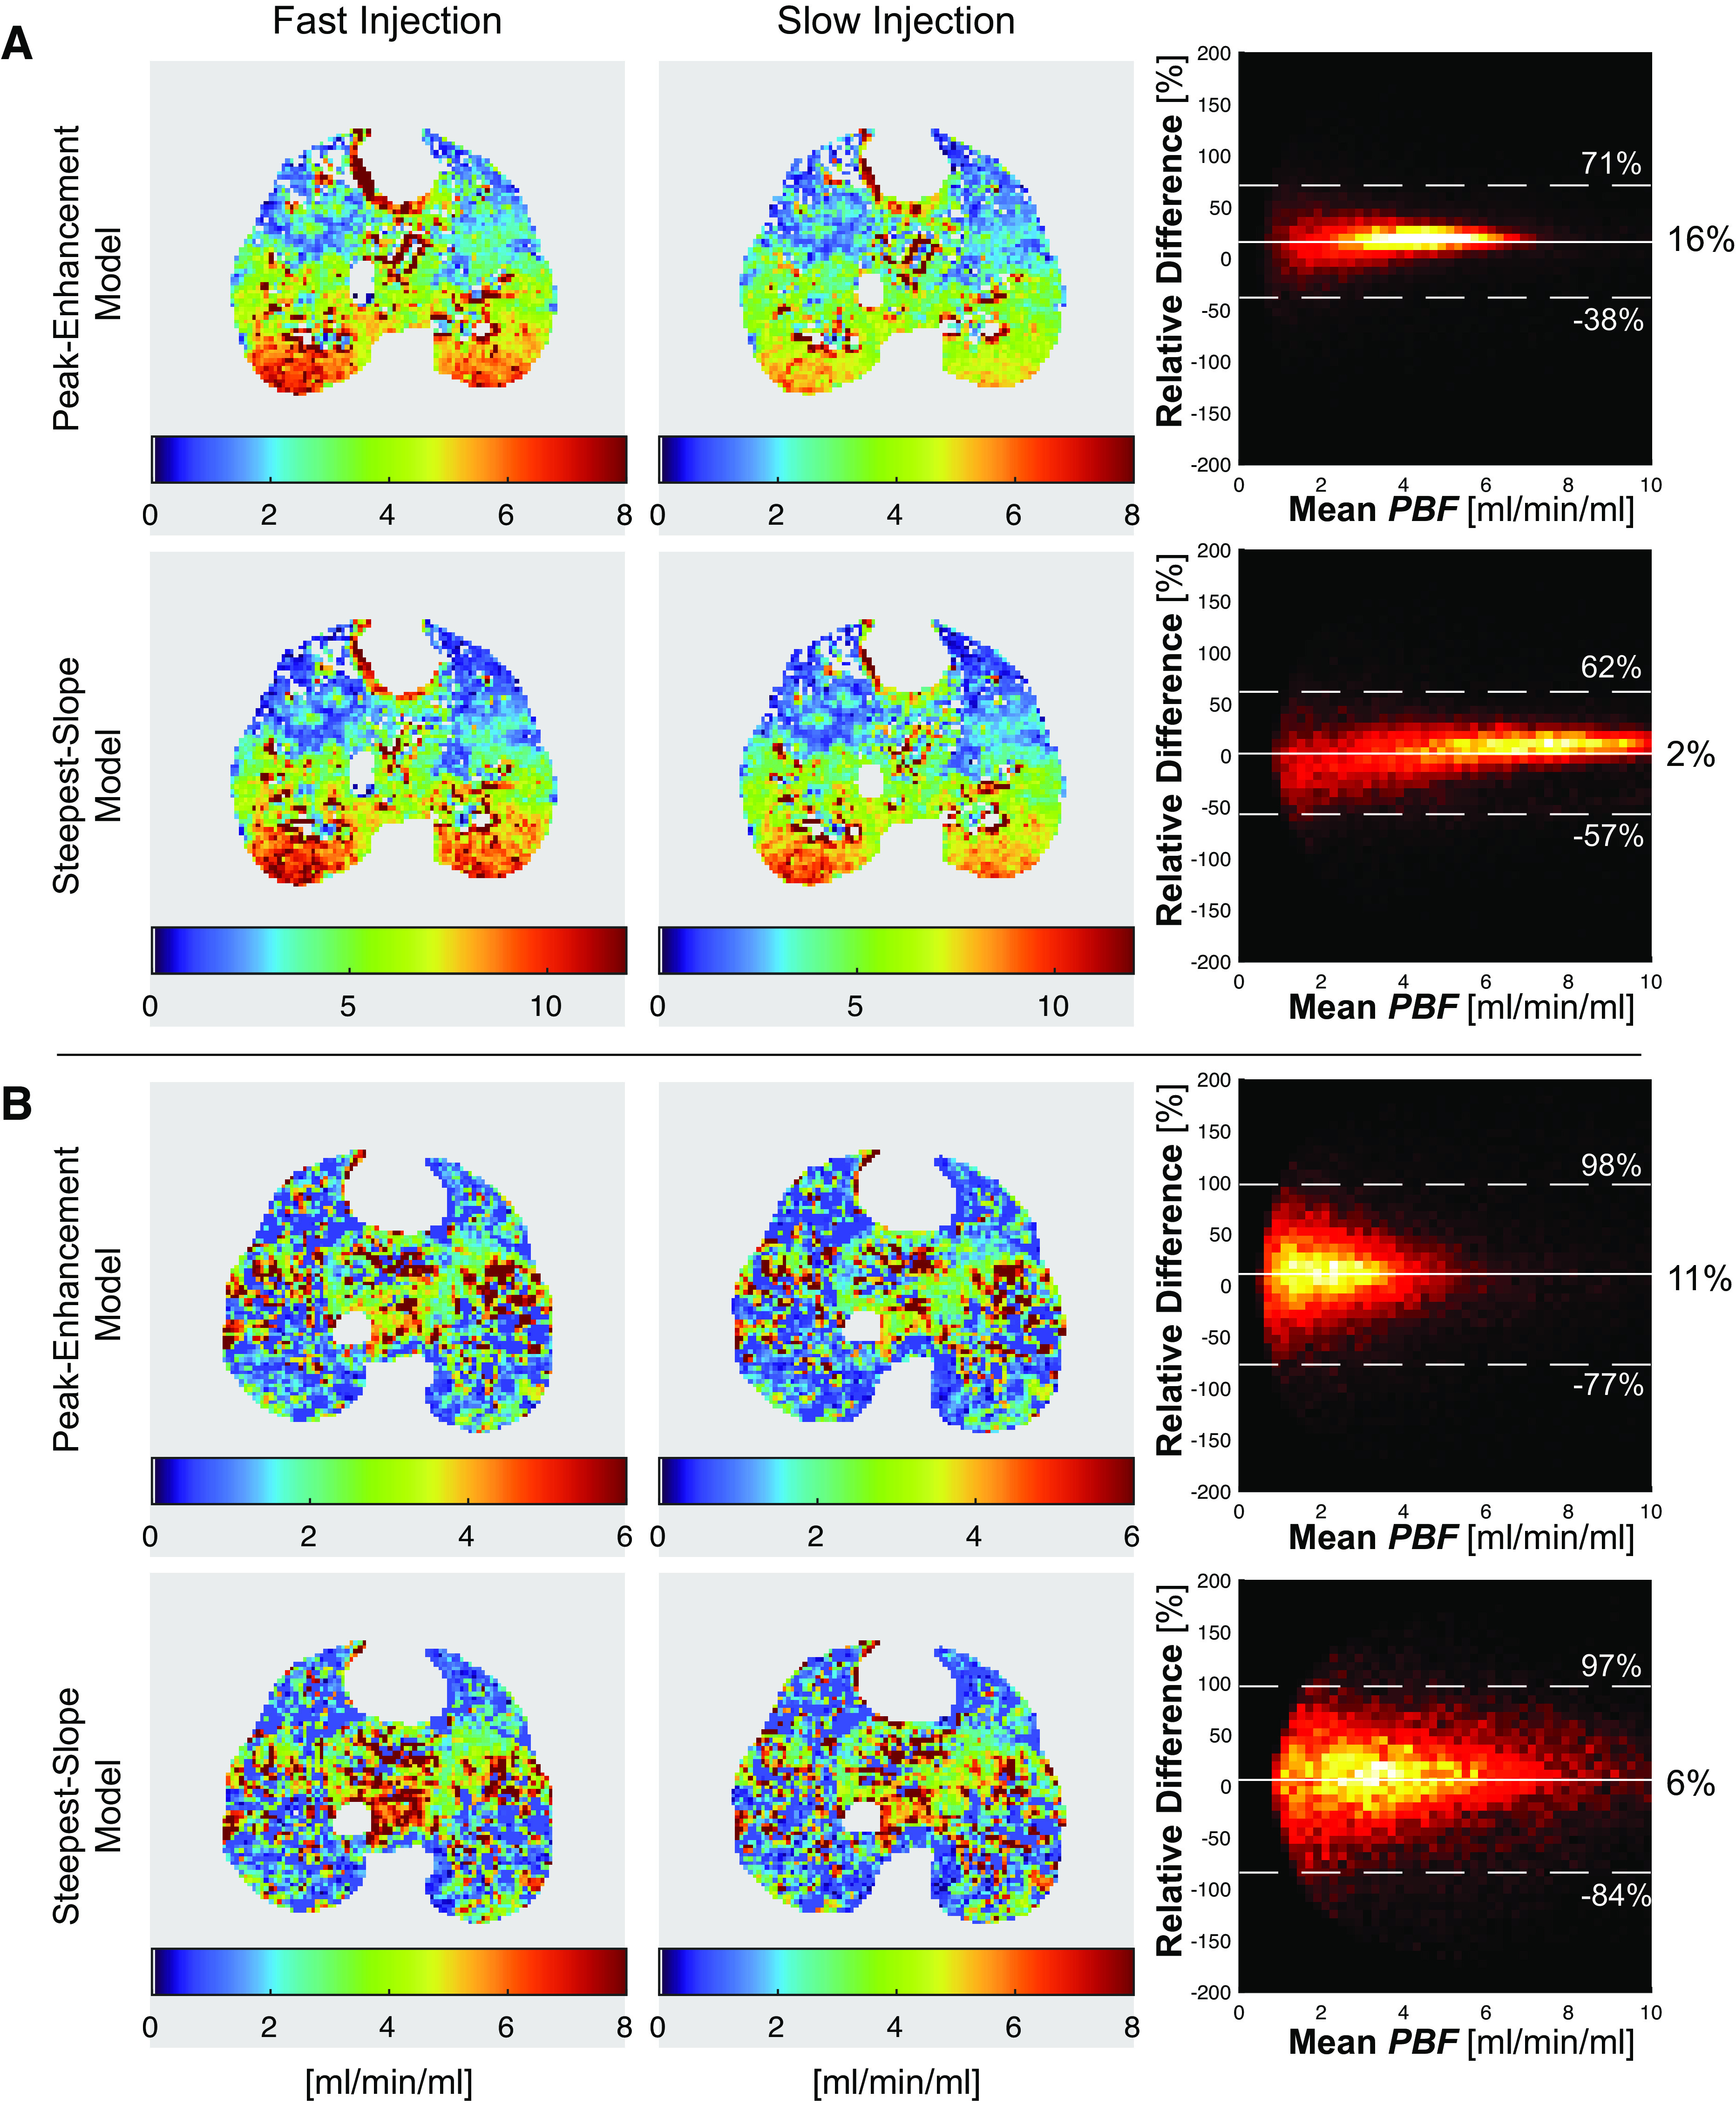
PBF maps obtained after fast (8 mL/s for 2 s) and slow (4 mL/s for 4 s) injection of diluted Isovue-370 are shown for a healthy pig (A) and for a pig with lung injury (B). PBF values were obtained by the peak-enhancement and steepest-slope model. Bland–Altman analyses of individual voxel PBF values are plotted in the right panel. The mean values of differences in the PBF values are given at the right edge; the agreement intervals, within which 95% of the differences lie, are indicated by the dashed lines. The differences were systematically larger in the PBF maps obtained through the peak-enhancement model. PBF, regional pulmonary blood flow per voxel volume.
Moreover, we tested the effects of contrast dilution on DCE tracer kinetics and on PBF values estimated by the peak-enhancement and the steepest-slope models (Table 2). The first moments (and thus the width) of the contrast-time curve were smaller with diluted versus undiluted contrast in both the PA (P < 0.01) and PV (P < 0.01). A reduced width (first moment) at a comparable height of the contrast-time curves observed after injection of diluted instead of pure Isovue-370 implies a smaller area under the PV curves and thus—in agreement with the protocol—a lower administered contrast agent dose (Fig. 5). In contrast to the first moments, differences between PTT were not significant (P = 0.74) presumably due to the additional uncertainty introduced by the appearance time, AT required for PTT calculation. With diluted contrast, slab-averaged regional PBF values in lung tissue were higher than with undiluted dye when either the peak-enhancement model (2.0 ± 0.8 vs. 1.5 ± 0.5 mL/min/mL, P < 0.01) or the steepest-slope model (3.3 ± 1.1 vs. 2.8 ± 0.9 mL/min/mL, P < 0.01) were used for analysis.
Table 2.
Mean and standard deviation of parameters characterizing the contrast kinetics for full vs. diluted contrast in eight pigs (5 injured, 3 healthy; contrast injection, 4 mL/s in 4 s; cf. Table 1)
| Full Contrast | Diluted Contrast | P Value | |
|---|---|---|---|
| First moment in PA, s | 5.9 ± 0.4 | 4.8 ± 0.6 | <0.01 |
| First moment in PV, s | 7.4 ± 0.7 | 6.3 ± 1.0 | <0.01 |
| Pulmonary transit time, s | 4.2 ± 2.2 | 4.2 ± 2.0 | 0.74 |
| Maximum peak enhancement in PA, HU | 549 ± 178 | 490 ± 101 | 0.46 |
| Maximum peak enhancement in PV, HU | 425 ± 110 | 359 ± 72 | 0.04 |
| PBF, peak-enhancement model, mL/min/mL | 1.5 ± 0.5 | 2.0 ± 0.8 | <0.01 |
| PBF, steepest-slope model, mL/min/mL | 2.8 ± 0.9 | 3.3 ± 1.1 | <0.01 |
PA, pulmonary artery; PBF, pulmonary blood flow; PV, pulmonary vein.
Figure 5.
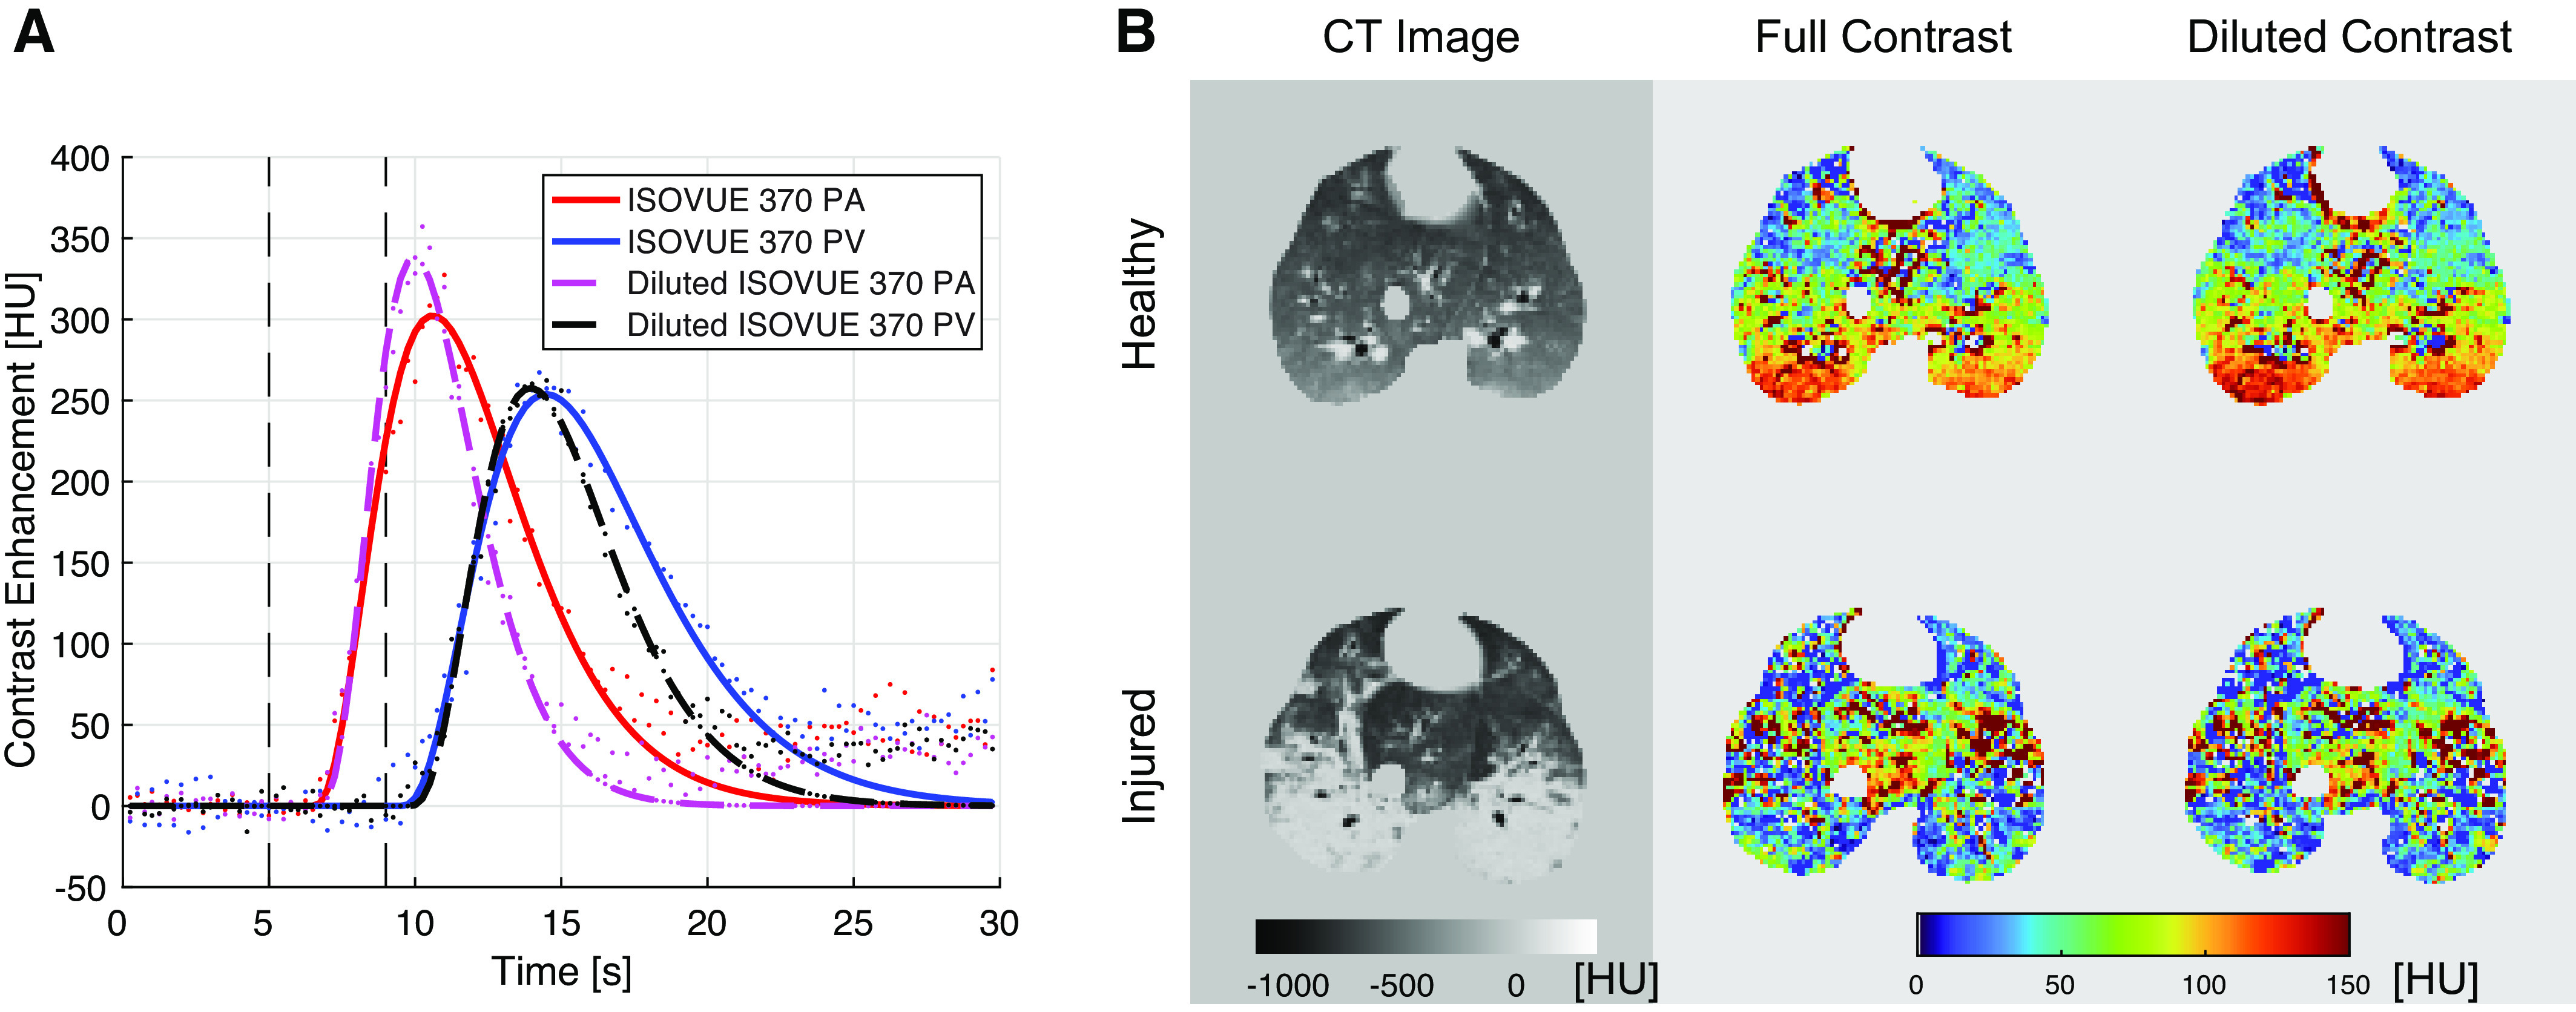
A: contrast-time curves measured in the pulmonary artery (PA) and vein (PV) after injection of full and diluted Isovue-370 (4 mL/s for 4 s) in a healthy pig. B: CT images as well as maps of the regional maximum contrast enhancement (in HU) measured in the healthy and injured lungs of two pigs after injection of full and diluted contrast.
For both contrast agent doses, the steepest-slope model yielded considerably (P < 0.01) higher slab-averaged PBF values as the peak-enhancement model (Table 2). Moreover, regression analyses (Fig. 6) demonstrated a stronger correlation between slab-averaged PBF and cardiac output values for the steepest-slope model (R2 = 0.82 and R2 = 0.42 for full and diluted contrast, respectively) than for the peak-enhancement model (R2 = 0.64 and R2 = 0.41, respectively). No significant difference in cardiac output was found between samples of 5 healthy and 5 injured pigs (P = 0.81). Total-lung PBF values estimated for two healthy pigs from DCE-CT measurements subsequently performed in three slabs are plotted in Fig. 7 versus the corresponding cardiac output values. The steepest-slope model yielded closer values (3.7 and 3.3 L/min in the two pigs) to the cardiac output measurements (3.8 and 4 L/min) than the peak-enhancement model (2.5 and 2.2 L/min).
Figure 6.

Correlation between slab-averaged regional pulmonary blood flow (PBF) values measured in eight pigs and cardiac output measured via a pulmonary artery catheter with thermal dilution. Images were acquired using both full (A and C) and diluted (B and D) Isovue-370 contrast (contrast administration, 4 mL/s in 4 s) and analyzed using either the peak-enhancement model (A and B) or the steepest-slope model (C and D).
Figure 7.
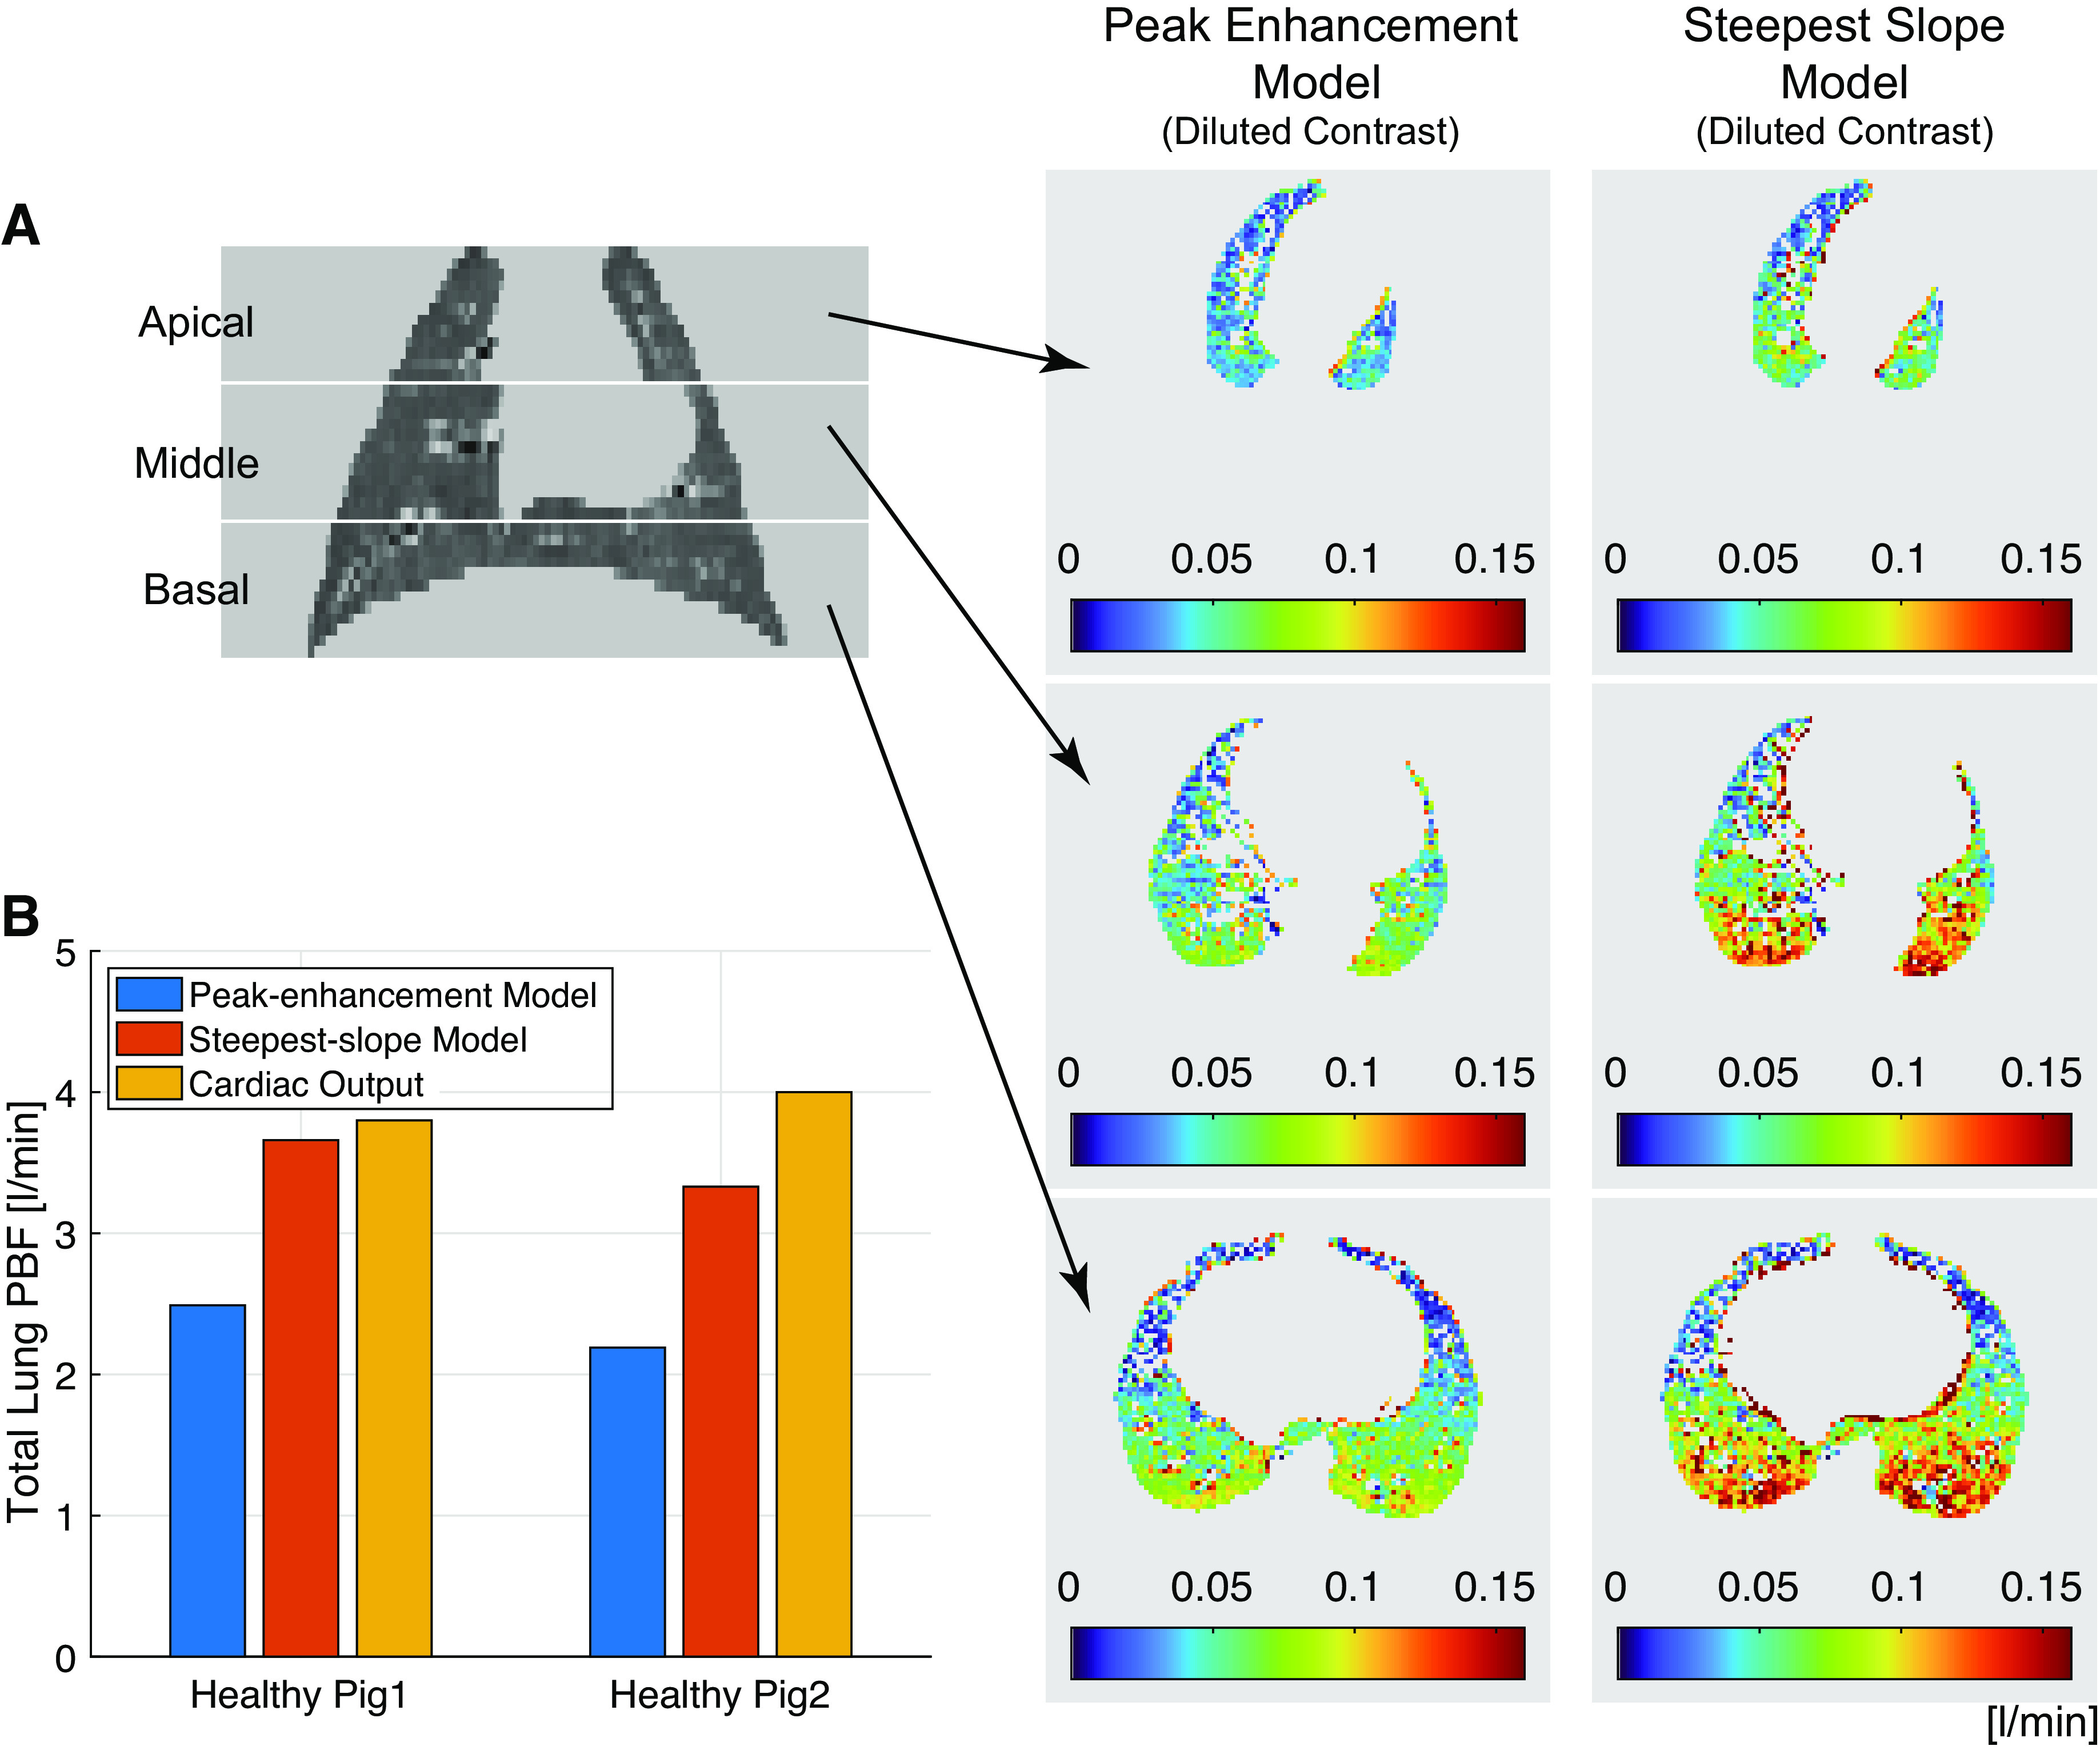
Three separate DCE measurements (contrast administration, 4 mL/s in 4 s) covering the entire lungs were acquired 10 min apart. A: representative coronal CT density maps and representative transversal PBF maps computed from the three slabs using either the peak-enhancement or the steepest-slope model. B: total-lung PBF values computed from DCE-CT measurements using the peak-enhancement and steepest-slope models as compared with the corresponding cardiac output values for both animals. DCE-CT, dynamic contrast-enhanced computed tomography; PBF, regional pulmonary blood flow per voxel volume.
In healthy animals, gradients of regional PBF along the anteroposterior axis were observed, with increasing values going from nondependent to dependent regions (Fig. 8). This effect was reduced by normalizing the regional PBF values to the tissue mass of the voxels (PBFm in mL/min/g). Injured pigs displayed lower PBF (2.7 ± 0.6 vs. 5.4 ± 2.0 mL/min/g) and PBFm (4.7 ± 1.0 vs. 10.5 ± 3.3 mL/min/g) values in the dependent regions as compared with the corresponding regions in the healthy animals.
Figure 8.

Representative postcontrast CT images (approximately at the time of highest contrast enhancement in the lungs) of a healthy and an injured pig as well as corresponding perfusion maps (contrast administration, 4 mL/s in 4 s). CT, computed tomography; PBF, regional pulmonary blood flow per voxel volume; PBFm, regional pulmonary blood flow normalized by tissue weight per voxel.
DISCUSSION
DCE-CT is commonly used in brain imaging(26, 27), where the analysis of first-pass kinetics following the administration of a contrast agent is validated and widely accepted(28, 29). In contrast, perfusion of lung parenchyma is rarely quantified by this promising approach(7). According to our experience, tracer-kinetic analysis of DCE-CT data can capture changes in PBF distributions due to lung injury comparable with other imaging techniques(30, 31). In the present study, we evaluated different contrast agent administration schemes and models for tracer-kinetic analysis of DCE-CT examinations to improve perfusion assessment in an experimental model of lung injury.
To investigate these aspects in detail and still keep the number of pigs due to ethical reasons to a minimum, a total of 29 DCE-CT measurements were performed in 10 pigs (Table 1), specifically between 2 and 4 measurements on the same animal in one session. Replicate DCE-CT measurements on three pigs yielded a good quantitative match of PBF maps indicating a satisfactory reproducibility of PBF measurements. When evaluating PBF against cardiac output (as a measure of global lung perfusion), injection of diluted contrast in combination with the steepest-slope model outperformed the alternative injection protocol and model investigated in our study and yielded markedly stronger correlations between slab-averaged regional PBF values and cardiac output. Furthermore, estimated total-lung PBF values were also closer to cardiac output, although the summation of regional PBF values yielded somewhat lower total-lung PBF values for both tracer-kinetic models, probably due to the exclusion of blood flow in larger vessels.
Both methods assume that contrast injection is rapid enough that tissue venous outflow can be ignored during the relevant up-slope phase. Since the steepest gradient of the up-sloping contrast-time curve used by the steepest-slope method occurs earlier than the maximum peak enhancement used by the peak-enhancement method, the latter is more affected by venous outflow. This is especially true for the contrast agents and protocols used in DCE-CT studies, which result in a pronounced first-pass peak in most tissues. At the time of peak maximum, however, the arterial input is equal to the venous output according to Fick’s principle, which contradicts the assumption of negligible venous outflow at this point in time [cf. the detailed discussion of the prerequisites of the peak-enhancement method by Mullani and Gould (14)]. Therefore, the prerequisites for using the peak-enhancement method in DCE-CT studies are much less fulfilled than those for using the steepest-slope method, especially at high blood flows. This is in line with our finding that estimates of PBF by the peak-enhancement method were more influenced by the rate of contrast injection, especially in lung regions with high flow, although the injection site was a central vein and enhancement peaked rapidly. Therefore, the steepest-slope method is considered more appropriate for the study of regional lung perfusion.
Although it can be assumed that the use of a contrast medium with a viscosity similar to blood is required to achieve a fast mixing with circulating blood and thus for unimpeded circulation, the effect of contrast agent viscosity in DCE imaging is largely unexplored. According to our findings, the use of diluted Isovue-370 matching the viscosity of blood [3.5–5.5 cP (32)] instead of pure Isovue-370 with a viscosity that is roughly twice as high (9.4 cP at 37°C) results in a smaller width of contrast-time curves in the PA (without significantly reducing the peak enhancement) and thus in a reduced venous outflow from lung voxels during the initial up-slope phase, which is a crucial prerequisite for the computation of reliable PBF values. In our study, the use of diluted contrast in combination with the steepest-slope model thus resulted in the strongest correlation of estimated PBF values with cardiac output.
In healthy pigs, we observed a vertical distribution of PBF with dorsal predominance, which was reduced, but not abolished, by density correction to mitigate the effects of decreased aeration of dependent lung (31). This regional perfusion pattern is explained by both hydrostatic (gravitational) and anatomic factors (33). In injured lungs where gas content was severely reduced, we observed that PBF was lower than normal in dependent lung regions. This finding is comparable with studies in oleic acid-induced lung injury (34) and is explained by strong vasoconstrictive responses limiting flow in hypo- or nonventilated regions.
Blood hematocrit is smaller in small pulmonary vessels than in the PA (input function) but may vary substantially (especially in the supine position and after lung injury). A global hematocrit correction (35) could thus introduce a considerable source of uncertainty. Thus, we did not correct for the hematocrit which led to an overestimation of regional PBF values.
Our study improves on previous work on DCE-CT to assess pulmonary perfusion. Although repeat measurements were performed on only three pigs, the good agreements obtained indicate a satisfactory reproducibility of the presented DCE-CT technique for PBF estimation. In our study, the comparison with cardiac output indicates that, at least on a global scale, PBF measurements were reliable. Furthermore, our regional PBF estimates were in the range reported by authors using nuclear imaging (36). We observed wide voxelwise variability of PBF, which can be explained by small-scale movements of lung tissue due to the heartbeat, among other things. DCE-CT studies with similar spatial resolution showed comparable PBF variability with our results (17). Nevertheless, the findings suggest that DCE-CT can detect larger-scale heterogeneity of pulmonary perfusion occurring for example in patients with ARDS.
Previous studies showed significant interpatient heterogeneity of PBF in ARDS patients (37), which may warrant future use of DCE-CT to assess ARDS severity and responses to treatments such as inhaled pulmonary vasodilators. The present study supports the use of our approach to DCE-CT for this purpose. Promising methods for dose reduction are being investigated, which could greatly increase the feasibility of this approach by reducing the radiation exposure to patients [e.g., by reducing the number of image frames (38) or developing undersampling techniques (39)]. The steepest-slope analysis model may be an ideal complement to such approaches because the up-slope maximum gradient can be interpolated and is less dependent on the temporal resolution than the peak-enhancement method.
The study has several limitations. First, we did not evaluate more complex approaches to perfusion analysis, such as deconvolution or two-compartment approaches because they are not expected to be beneficial in lung imaging. Deconvolution is an ill-posed inverse problem that usually does not have a unique solution even in the absence of noise. To avoid physiologically unreasonable solutions, additional assumptions or constraints must be applied (35). Two-compartment models allow a more detailed analysis of the contrast agent distribution in both the intravascular and interstitial space, but require both a good signal-to-noise ratio of contrast-time curves as well as long acquisitions times beyond the first pass to reliably estimate the different model parameters and are thus prone to motion artifacts (35). Second, neither the peak-enhancement nor the steepest-slope model accounts for contrast transfer across the endothelial barrier; they only allow the estimation of tissue perfusion from the initial kinetics of contrast enhancement. Whereas our previous studies (21) show limited pulmonary edema in the early stages of acid aspiration, the accuracy of each model may need to be evaluated separately in more permeable types of injury (e.g., sepsis). Third, the small number of animals limits our ability to make conclusive assessments on studied factors, in particular the effect of injection rate on PBF values. Finally, we used 80 kVp to reduce radiation dose and maximize contrast enhancement but did not explore other approaches to reduce radiation exposure.
Conclusions
Dynamic contrast-enhanced CT using a lower-viscosity contrast agent in combination with tracer-kinetic analysis by the steepest-slope model improves pulmonary blood flow measurements and assessment of regional distributions of lung perfusion. It is thus a promising technique that may be used in the future as a fast and reproducible imaging tool to characterize lung perfusion in ARDS.
DATA AVAILABILITY
Data will be made available upon reasonable request.
GRANTS
This work was supported by NIH (Bethesda, MD) grant R01-HL137389.
DISCLOSURES
No conflicts of interest, financial or otherwise, are declared by the authors.
AUTHOR CONTRIBUTIONS
Y.X. and M.C. conceived and designed research; Y.X., T.K., K.T.M., K.R., and M.C. performed experiments; Y.X., T.K., T.W., G.B., S.E.G., and M.V. analyzed data; Y.X., T.K., T.W., G.B., T.G., S.E.G., J.H., K.T.M., M.V., K.R., M.A., L.B., M.K.K., and M.C. interpreted results of experiments; Y.X. prepared figures; Y.X. and M.C. drafted manuscript; Y.X., T.W., G.B., T.G., J.H., K.T.M., M.V., M.K.K., and M.C. edited and revised manuscript; Y.X., G.B., M.A., L.B., M.K.K., and M.C. approved final version of manuscript.
ACKNOWLEDGMENTS
The authors thank the specialists and students involved in the experiments, especially Austin Lenart, Jiacheng Shen, Shreya Bathula, Priya Shah, Mihail Petrov, Sherbano Khan, and Karina Rozenberg. The authors also thank the technicians and veterinarians of University Laboratory Animal Resources, Michael Frazer from Respiratory Care and Pulmonary Diagnostics Service, and the technologists of the Department of Radiology at the University of Pennsylvania.
REFERENCES
- 1. Wagner PD. The physiological basis of pulmonary gas exchange: implications for clinical interpretation of arterial blood gases. Eur Respir J 45: 227–243, 2015. doi: 10.1183/09031936.00039214. [DOI] [PubMed] [Google Scholar]
- 2. Ranieri VM, Rubenfeld GD, Thompson BT, Ferguson ND, Caldwell E, Fan E, Camporota L, Slutsky AS; ARDS Definition Task Force. Acute respiratory distress syndrome: the Berlin Definition. JAMA 307: 2526–2533, 2012. doi: 10.1001/jama.2012.5669. [DOI] [PubMed] [Google Scholar]
- 3. Brower RG, Matthay MA, Morris A, Schoenfeld D, Thompson BT, Wheeler A; Acute Respiratory Distress Syndrome Network. Ventilation with lower tidal volumes as compared with traditional tidal volumes for acute lung injury and the acute respiratory distress syndrome. N Engl J Med 342: 1301–1308, 2000. doi: 10.1056/NEJM200005043421801. [DOI] [PubMed] [Google Scholar]
- 4. Guérin C, Reignier J, Richard J-C, Beuret P, Gacouin A, Boulain T, Mercier E, Badet M, Mercat A, Baudin O, Clavel M, Chatellier D, Jaber S, Rosselli S, Mancebo J, Sirodot M, Hilbert G, Bengler C, Richecoeur J, Gainnier M, Bayle F, Bourdin G, Leray V, Girard R, Baboi L, Ayzac L; PROSEVA Study Group. Prone positioning in severe acute respiratory distress syndrome. N Engl J Med 368: 2159–2168, 2013. doi: 10.1056/NEJMoa1214103. [DOI] [PubMed] [Google Scholar]
- 5. Brigham KL, Kariman K, Harris TR, Snapper JR, Bernard GR, Young SL. Correlation of oxygenation with vascular permeability-surface area but not with lung water in humans with acute respiratory failure and pulmonary edema. J Clin Invest 72: 339–349, 1983. doi: 10.1172/jci110974. [DOI] [PMC free article] [PubMed] [Google Scholar]
- 6. Cressoni M, Caironi P, Polli F, Carlesso E, Chiumello D, Cadringher P, Quintel M, Ranieri VM, Bugedo G, Gattinoni L. Anatomical and functional intrapulmonary shunt in acute respiratory distress syndrome. Crit Care Med 36: 669–675, 2008. doi: 10.1097/01.CCM.0000300276.12074.E1. [DOI] [PubMed] [Google Scholar]
- 7. Hopkins SR, Wielpütz MO, Kauczor H-U. Imaging lung perfusion. J Appl Physiol (1985) 113: 328–339, 2012. doi: 10.1152/japplphysiol.00320.2012. [DOI] [PMC free article] [PubMed] [Google Scholar]
- 8. Musch G, Layfield JDH, Harris RS, Melo MFV, Winkler T, Callahan RJ, Fischman AJ, Venegas JG. Topographical distribution of pulmonary perfusion and ventilation, assessed by PET in supine and prone humans. J Appl Physiol (1985) 93: 1841–1851, 2002. doi: 10.1152/japplphysiol.00223.2002. [DOI] [PubMed] [Google Scholar]
- 9. Wild JM, Marshall H, Bock M, Schad LR, Jakob PM, Puderbach M, Molinari F, Van Beek EJR, Biederer J. MRI of the lung (1/3): methods. Insights Imaging 3: 345–353, 2012. doi: 10.1007/s13244-012-0176-x. [DOI] [PMC free article] [PubMed] [Google Scholar]
- 10. Fuld MK, Halaweish AF, Haynes SE, Divekar AA, Guo J, Hoffman EA. Pulmonary perfused blood volume with dual-energy CT as surrogate for pulmonary perfusion assessed with dynamic multidetector CT. Radiology 267: 747–756, 2013. doi: 10.1148/radiol.12112789. [DOI] [PMC free article] [PubMed] [Google Scholar]
- 11. Ball L, Robba C, Herrmann J, Gerard SE, Xin Y, Mandelli M, Battaglini D, Brunetti I, Minetti G, Seitun S, Bovio G, Vena A, Giacobbe DR, Bassetti M, Rocco PRM, Cereda M, Rizi RR, Castellan L, Patroniti N, Pelosi P; Collaborators of the GECOVID Group. Lung distribution of gas and blood volume in critically ill COVID-19 patients: a quantitative dual-energy computed tomography study. Crit Care 25: 214, 2021. doi: 10.1186/s13054-021-03610-9. [DOI] [PMC free article] [PubMed] [Google Scholar]
- 12. Kay FU, Beraldo MA, Nakamura MAM, De Santis Santiago R, Torsani V, Gomes S, Roldan R, Tucci MR, Abbara S, Amato MBP, Amaro E. Quantitative dual-energy computed tomography predicts regional perfusion heterogeneity in a model of acute lung injury. J Comput Assist Tomogr 42: 866–872, 2018. doi: 10.1097/RCT.0000000000000815. [DOI] [PMC free article] [PubMed] [Google Scholar]
- 13. Axel L. Cerebral blood flow determination by rapid-sequence computed tomography: theoretical analysis. Radiology 137: 679–686, 1980. doi: 10.1148/radiology.137.3.7003648. [DOI] [PubMed] [Google Scholar]
- 14. Mullani NA, Gould KL. First-pass measurements of regional blood flow with external detectors. J Nucl Med 24: 577–581, 1983. [PubMed] [Google Scholar]
- 15. Wolfkiel CJ, Rich S. Analysis of regional pulmonary enhancement in dogs by ultrafast computed tomography. Invest Radiol 27: 211–216, 1992. doi: 10.1097/00004424-199203000-00006. [DOI] [PubMed] [Google Scholar]
- 16. Jones AT, Hansell DM, Evans TW. Pulmonary perfusion in supine and prone positions: an electron-beam computed tomography study. J Appl Physiol (1985) 90: 1342–1348, 2001. doi: 10.1152/jappl.2001.90.4.1342. [DOI] [PubMed] [Google Scholar]
- 17. Chon D, Beck KC, Larsen RL, Shikata H, Hoffman EA. Regional pulmonary blood flow in dogs by 4D-X-ray CT. J Appl Physiol (1985) 101: 1451–1465, 2006. doi: 10.1152/japplphysiol.01131.2005. [DOI] [PubMed] [Google Scholar]
- 18. Miles KA. Measurement of tissue perfusion by dynamic computed tomography. Br J Radiol 64: 409–412, 1991. doi: 10.1259/0007-1285-64-761-409. [DOI] [PubMed] [Google Scholar]
- 19. Blomley MJ, Coulden R, Bufkin C, Lipton MJ, Dawson P. Contrast bolus dynamic computed tomography for the measurement of solid organ perfusion. Invest Radiol 28, Suppl 5: S72–S77, 1993. doi: 10.1097/00004424-199311001-00023. [DOI] [PubMed] [Google Scholar]
- 20. Brix G, Zwick S, Griebel J, Fink C, Kiessling F. Estimation of tissue perfusion by dynamic contrast-enhanced imaging: simulation-based evaluation of the steepest slope method. Eur Radiol 20: 2166–2175, 2010. doi: 10.1007/s00330-010-1787-6. [DOI] [PubMed] [Google Scholar]
- 21. Xin Y, Martin K, Morais CCA, Delvecchio P, Gerard SE, Hamedani H, Herrmann J, Abate N, Lenart A, Humayun S, Sidhu U, Petrov M, Reutlinger K, Mandelbaum T, Duncan I, Tustison N, Kadlecek S, Chatterjee S, Gee JC, Rizi RR, Berra L, Cereda M. Diminishing efficacy of prone positioning with late application in evolving lung injury. Crit Care Med 49: e1015–e1024, 2021. doi: 10.1097/CCM.0000000000005071. [DOI] [PMC free article] [PubMed] [Google Scholar]
- 22. Gerard SE, Herrmann J, Kaczka DW, Musch G, Fernandez-Bustamante A, Reinhardt JM. Multi-resolution convolutional neural networks for fully automated segmentation of acutely injured lungs in multiple species. Med Image Anal 60: 101592, 2020. doi: 10.1016/j.media.2019.101592. [DOI] [PMC free article] [PubMed] [Google Scholar]
- 23. Avants BB, Tustison NJ, Stauffer M, Song G, Wu B, Gee JC. The Insight ToolKit image registration framework. Front Neuroinform 8: 44, 2014. doi: 10.3389/fninf.2014.00044. [DOI] [PMC free article] [PubMed] [Google Scholar]
- 24. Gould RG. Perfusion quantitation by ultrafast computed tomography. Invest Radiol 27, Suppl 2: S18–S21, 1992. doi: 10.1097/00004424-199212002-00004. [DOI] [PubMed] [Google Scholar]
- 25. Thompson HK, Starmer CF, Whalen RE, Mcintosh HD. Indicator transit time considered as a gamma variate. Circ Res 14: 502–515, 1964. doi: 10.1161/01.RES.14.6.502. [DOI] [PubMed] [Google Scholar]
- 26. Mayer TE, Hamann GF, Baranczyk J, Rosengarten B, Klotz E, Wiesmann M, Missler U, Schulte-Altedorneburg G, Brueckmann HJ. Dynamic CT perfusion imaging of acute stroke. AJNR Am J Neuroradiol 21: 1441–1449, 2000. [PMC free article] [PubMed] [Google Scholar]
- 27. Wintermark M, Flanders AE, Velthuis B, Meuli R, van Leeuwen M, Goldsher D, Pineda C, Serena J, I van der S, Waaijer A, Anderson J, Nesbit G, Gabriely I, Medina V, Quiles A, Pohlman S, Quist M, Schnyder P, Bogousslavsky J, Dillon WP, Pedraza S. Perfusion-CT assessment of infarct core and penumbra: receiver operating characteristic curve analysis in 130 patients suspected of acute hemispheric stroke. Stroke 37: 979–985, 2006. doi: 10.1161/01.STR.0000209238.61459.39. [DOI] [PubMed] [Google Scholar]
- 28. Wintermark M, Maeder P, Thiran J-P, Schnyder P, Meuli R. Quantitative assessment of regional cerebral blood flows by perfusion CT studies at low injection rates: a critical review of the underlying theoretical models. Eur Radiol 11: 1220–1230, 2001. doi: 10.1007/s003300000707. [DOI] [PubMed] [Google Scholar]
- 29. Abels B, Klotz E, Tomandl BF, Kloska SP, Lell MM. Perfusion CT in acute ischemic stroke: a qualitative and quantitative comparison of deconvolution and maximum slope approach. AJNR Am J Neuroradiol 31: 1690–1698, 2010. doi: 10.3174/ajnr.A2151. [DOI] [PMC free article] [PubMed] [Google Scholar]
- 30. Schuster DP, Anderson C, Kozlowski J, Lange N. Regional pulmonary perfusion in patients with acute pulmonary edema. J Nucl Med 43: 863–870, 2002. [PubMed] [Google Scholar]
- 31. Hopkins SR, Henderson AC, Levin DL, Yamada K, Arai T, Buxton RB, Prisk GK. Vertical gradients in regional lung density and perfusion in the supine human lung: the Slinky effect. J Appl Physiol (1985) 103: 240–248, 2007. doi: 10.1152/japplphysiol.01289.2006. [DOI] [PMC free article] [PubMed] [Google Scholar]
- 32. Rand PW, Lacombe E, Hunt HE, Austin WH. Viscosity of normal human blood under normothermic and hypothermic conditions. J Appl Physiol 19: 117–122, 1964. doi: 10.1152/jappl.1964.19.1.117. [DOI] [PubMed] [Google Scholar]
- 33. Glenny RW, Lamm WJ, Bernard SL, An D, Chornuk M, Pool SL, Wagner WW, Hlastala MP, Robertson HT. Selected contribution: redistribution of pulmonary perfusion during weightlessness and increased gravity. J Appl Physiol (1985) 89: 1239–1248, 2000. doi: 10.1152/jappl.2000.89.3.1239. [DOI] [PubMed] [Google Scholar]
- 34. Gust R, Kozlowski J, Stephenson AH, Schuster DP. Synergistic hemodynamic effects of low-dose endotoxin and acute lung injury. Am J Respir Crit Care Med 157: 1919–1926, 1998. doi: 10.1164/ajrccm.157.6.9704110. [DOI] [PubMed] [Google Scholar]
- 35. Brix G, Griebel J, Kiessling F, Wenz F. Tracer kinetic modelling of tumour angiogenesis based on dynamic contrast-enhanced CT and MRI measurements. Eur J Nucl Med Mol Imaging 37, Suppl 1: S30–S51, 2010. doi: 10.1007/s00259-010-1448-7. [DOI] [PubMed] [Google Scholar]
- 36. Schuster DP, Haller J. Regional pulmonary blood flow during acute pulmonary edema: a PET study. J Appl Physiol (1985) 69: 353–361, 1990. doi: 10.1152/jappl.1990.69.1.353. [DOI] [PubMed] [Google Scholar]
- 37. Dakin J, Jones AT, Hansell DM, Hoffman EA, Evans TW. Changes in lung composition and regional perfusion and tissue distribution in patients with ARDS. Respirology 16: 1265–1272, 2011. doi: 10.1111/j.1440-1843.2011.02048.x. [DOI] [PMC free article] [PubMed] [Google Scholar]
- 38. Wintermark M, Smith WS, Ko NU, Quist M, Schnyder P, Dillon WP. Dynamic perfusion CT: optimizing the temporal resolution and contrast volume for calculation of perfusion CT parameters in stroke patients. AJNR Am J Neuroradiol 25: 720–729, 2004. [PMC free article] [PubMed] [Google Scholar]
- 39. Zhao C, Martin T, Shao X, Alger JR, Duddalwar V, Wang DJJ. Low dose CT perfusion with k-space weighted image average (KWIA). IEEE Trans Med Imaging 39: 3879–3890, 2020. doi: 10.1109/TMI.2020.3006461. [DOI] [PMC free article] [PubMed] [Google Scholar]
Associated Data
This section collects any data citations, data availability statements, or supplementary materials included in this article.
Data Availability Statement
Data will be made available upon reasonable request.