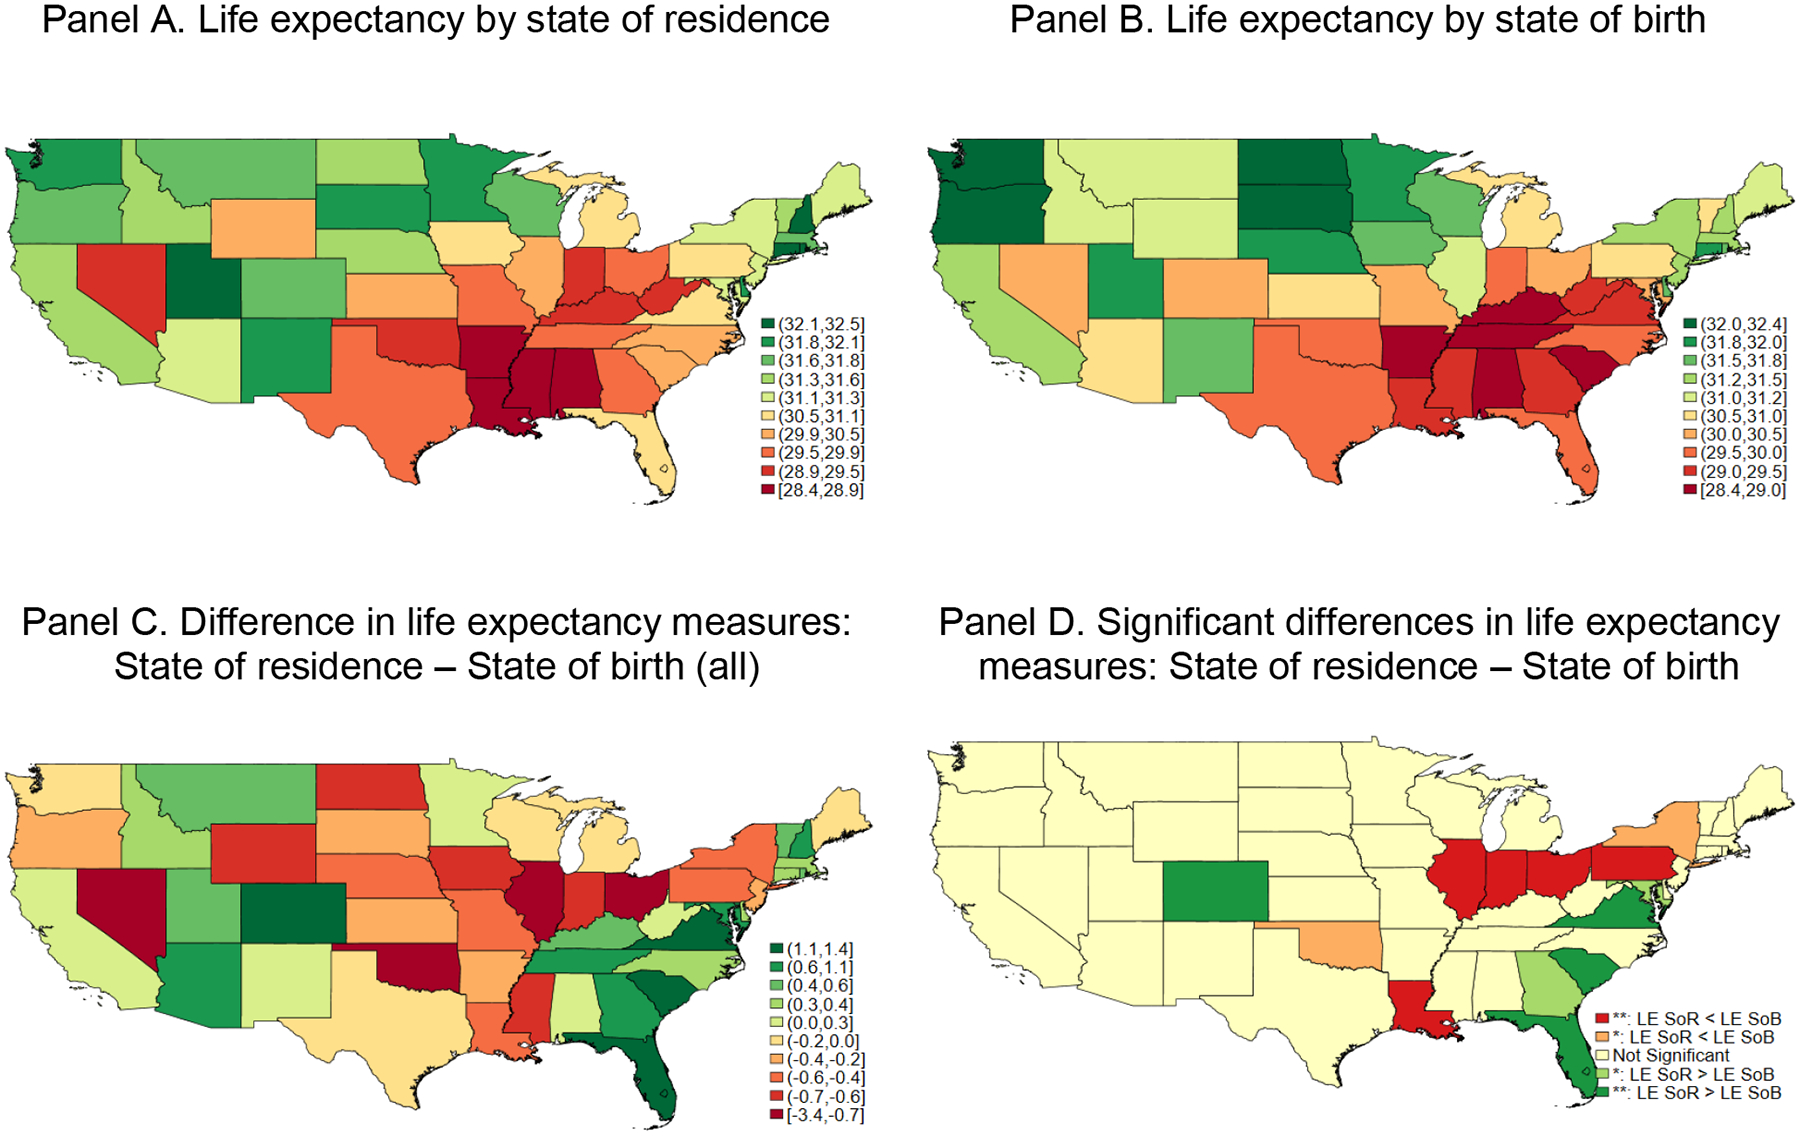
Figure 2:

Male life expectancies at age 50, 2008–2015
Note: Panel A of Figure 2 presents male life expectancies at age 50 grouping individuals by their state of residence in 2008, while Panel B of Figure 2 presents life expectancies at age 50 grouping individuals by their state of birth. Panel C of Figure 2 shows the differences between life expectancies by state of residence and life expectancies by state of birth for each of the states. Panel D of Figure 2 shows in red states in which the life expectancy by state of residence is significantly lower than the life expectancy by state of birth at the 5 and 10 percent significance levels. States in which the life expectancy by state of residence is significantly higher than the life expectancy by state of birth at the 5 and 10 significance levels are shown in green.
