

ABSTRACT
Background
Chronic kidney disease–associated pruritus (CKD-aP) is common in dialysis patients, and is associated with lower quality of life and increased risk of death. We investigated the association between residual estimated glomerular filtration rate (eGFR), dialysis adequacy or serum phosphate level and CKD-aP in incident dialysis patients.
Methods
A total of 1256 incident hemodialysis (HD) and 670 peritoneal dialysis (PD) patients (>18 years) from the Netherlands Cooperative Study on the Adequacy of Dialysis (NECOSAD) study were included (1997–2007) and followed until death, transplantation or a maximum of 10 years. CKD-aP was measured using a single item of the Kidney Disease Quality of Life Instrument-36. The associations were studied by logistic and linear regression analyses, adjusted for potential baseline confounders.
Results
At baseline mean (standard deviation) age was 60 (16) years, 62% were men and median (interquartile range) residual eGFR was 3.4 (1.7; 5.3) mL/min/1.73 m2. The prevalence of CKD-aP (∼70%) was similar in HD and PD. It was observed that 12 months after starting dialysis (after multivariable adjustment) each 1 mL/min/1.73 m2 higher residual eGFR, one unit higher total weekly Kt/V, or 1 mmol/L lower serum phosphate level was associated with lower burden of CKD-aP in HD and PD patients of –0.05 (95% CI –0.09; –0.02) and –0.09 (95% CI –0.13; –0.05), –0.15 (95% CI –0.26; –0.05) and –0.35 (95% CI –0.54; –0.16), and of –0.34 (95%CI: –0.51; –0.17) and –0.45 (95%CI: –0.71; –0.19), respectively. We found no association between dialysis Kt/V and CKD-aP.
Conclusions
Higher residual eGFR and lower serum phosphate level, but not the dialysis dose, were related with lower burden of CKD-aP in dialysis patients.
Keywords: dialysis, dialysis adequacy, itching, pruritus, residual kidney function
Graphical Abstract
Graphical Abstract.

KEY LEARNING POINTS.
What is already known about this subject?
Chronic kidney disease–associated pruritus (itching) is highly prevalent among dialysis patients and associated with poor sleep, depression, interference with people's work, overall lower quality of life and increased risk of death.
Little is known about factors associated with the severity of pruritus in dialysis patients due to the lack of longitudinal follow-up studies.
Although several hypotheses have been proposed, the etiology and pathophysiology of pruritus in dialysis patients are not fully understood.
What this study adds?
The prevalence of pruritus in this cohort of chronic dialysis patients was 70%, of whom 20% experienced severe/extreme burden to pruritus.
Higher residual kidney function and lower levels of serum phosphate were associated with a decreased risk of pruritus in both hemodialysis and peritoneal dialysis patients at 12 months after start of dialysis.
No association was observed between dialysis dose and pruritus in either hemodialysis or peritoneal dialysis patients.
What impact this may have on practice or policy?
These insights may help us better understand pruritus and underscore the need for recognition of pruritus in chronic dialysis patients.
These study findings may inform future guidelines about prevention and treatment of pruritus, and emphasizes the importance of residual kidney function in chronic dialysis patients.
INTRODUCTION
Chronic kidney disease–associated pruritus (itching) (CKD-aP) affects up to 70% of dialysis patients, and ∼40% report being at least moderately bothered by pruritus [1, 2]. The presence of CKD-aP in dialysis patients is associated with poor sleep, depression, interference with people's work, overall lower quality of life and increased risk of death [3–6].
Itching can have different causes, namely: dermatological (e.g. dry skin, eczema, allergy), internal disease (e.g. CKD, diabetes mellitus, anemia, liver disease), neurological (e.g. stroke), psychiatric (e.g. depression) and drug-induced (e.g. opioids, chloroquine) [7]. Although several hypotheses have been proposed, the etiology and pathophysiology of CKD-aP are not fully understood [8]. The underlying mechanisms of CKD-aP are believed to be multifactorial, including uremic toxin deposition, peripheral neuropathy, immune system dysfunction and imbalance of the endogenous opioid system [9, 10]. It is thought that uremia causes structural alterations in the skin related to dehydration, increased systemic inflammation, and accumulation of phosphorus and calcium which potentially leads to dermal microcalcifications [5, 9, 10]. It has been stated that dialysis dose has to be optimized and high serum phosphate levels should be reduced in case of pruritus in dialysis patients, but previous studies found contradictory results [9, 11–14]. Moreover, protein-bound uremic toxins are not effectively removed during dialysis, whereas endogenous kidney function is about five times more efficient [15].
Little is known about factors associated with the severity of itching in dialysis patients due to the lack of longitudinal follow-up studies. Identification of potential modifiable causal risk factors of CKD-aP is important. Therefore, our aim is to investigate the effect of residual kidney function, dialysis adequacy, and serum phosphate levels on the burden of pruritus in incident hemodialysis (HD) and peritoneal dialysis (PD) patients separately. These results may inform future guidelines about prevention and treatment of pruritus in chronic dialysis patients.
MATERIALS AND METHODS
Study design and population
The NEtherlands COoperative Study on the Adequacy of Dialysis (NECOSAD) is a prospective multicenter cohort study with 1926 incident chronic HD and PD patients from 38 Dutch dialysis centers, as previously described in detail [16]. Briefly, all patients aged ≥18 years, who had never received kidney replacement therapy before, were eligible for the study. Inclusion ran from 1997 until 2007. Maximum follow-up time was 10 years after the start of dialysis, with the latest follow-up date on 1 January 2018. Follow-up visits took place at the start of dialysis, at 3 months and at 6 months, and subsequently at 6-month intervals until loss to follow-up, death, transfer to a nonparticipating dialysis center, kidney transplantation or withdrawal from the study. The institutional review board of the Academic Medical Hospital, Amsterdam, the Netherlands approved the study (MEC95/226a), and the institutional review boards of all participating hospitals provided additional local approval. All patients gave written informed consent. For the present analysis, baseline is defined as 3 months after the start of dialysis treatment, when the patients’ fluid and metabolic conditions had stabilized.
Data collection
Demographic and clinical data such as age, sex, ethnicity, primary kidney disease, current smoking, medication, history of diabetes, cardiovascular disease, blood pressure, blood and 24-h urine samples were collected at all visits until the end of follow-up. Primary kidney disease was classified as diabetic nephropathy, glomerulonephritis, renal vascular disease, and other kidney diseases, according to the European Renal Association codes [17].
Assessment of dialysis adequacy and residual kidney function
Plasma creatinine and urea levels were measured predialysis and after the long interval. Urine creatinine and urea were measured from 24-h urine collections at each study visit. Residual kidney function, expressed as estimated glomerular filtration rate (eGFR), was calculated as the mean of endogenous creatinine and urea clearance corrected for body surface area (mL/min/1.73 m2) [18, 19]. Total clearance of waste products, endogenous kidney function plus dialysis, was expressed as total Kt/V(urea) per week in HD and PD patients, in which V was calculated according to Watson et al. [20, 21]. Dialysis Kt/V(urea) per week was expressed in HD and PD patients as a measure of dialysis adequacy without residual kidney function [21]. Anuria was defined as urine volume <100 mL/day.
Assessment of pruritus
Pruritus was measured at baseline and every 6 months after starting dialysis, using a single item of the Kidney Disease Quality of Life Instrument-36 (KDQOL-36) [22]. Patients could indicate on a 5-item Likert scale if they were bothered by pruritus or dry skin during the past 4 weeks: 1 = not at all; 2 = somewhat; 3 = moderately; 4 = very much; and 5 = extremely bothered.
Data analysis
Baseline characteristics are presented for all 1926 patients, stratified for dialysis modality (HD or PD), as mean ± standard deviation (SD), median [interquartile range (IQR)] or counts (percentages) where appropriate. The burden of pruritus (mean ± SD) during 10 years follow-up in HD and PD patients is shown graphically per time point. Patients were reclassified when they switched their dialysis modality during follow-up and were censored when they died or were transplanted. To avoid bias and maintain power, we used multiple imputation (using 10 repetitions) for the main analyses, including all risk factors, confounders and the outcome in the model [23, 24]. The data were missing completely at random (Supplementary data, Table S1).
All analyses were performed separately for HD and PD patients. We studied the cross-sectional association at baseline and after 12 months between pruritus and the following factors by means of logistic and linear regression analyses: residual eGFR, dialysis Kt/V, total weekly Kt/V and serum phosphate concentrations. For the logistic regression analyses, we divided pruritus into two categories: not present (score 1, reference category) and present (score 2–5). Results were expressed as odds ratios (OR) [95% confidence interval (CI)] for pruritus present versus absent for each 1 mL/min/1.73 m2 increment in eGFR, one unit increment in dialysis and total weekly Kt/V and 1 mmol/L increment in phosphate concentration separately. As burden of pruritus was measured on a Likert scale, we also performed logistic regression analyses with pruritus divided into three categories: not present (score 1, reference category), mild/moderate (score 2/3) and severe/extreme (score 4/5) pruritus as a sensitivity analysis. Here OR (95% CI) for (mild/moderate and severe/extreme) pruritus compared with the reference category were calculated. Analyses were adjusted for potential baseline confounders: age, sex, smoking and diabetes mellitus (full model).
Finally, we explored the presence of effect modification between total weekly Kt/V (low/normal), diabetes (yes/no), and serum phosphate levels (high/normal) on the presence of severe/extreme pruritus at baseline. As a mediation analysis we added dry skin and serum phosphate levels to the models, likely being in the causal pathway between eGFR or dialyses adequacy and pruritus.
The longitudinal associations between residual eGFR, dialysis Kt/V, total weekly Kt/V (fixed variables) and pruritus (outcome) were also investigated over 10 years follow-up using linear mixed models (LMM). All LMM analyses were based on maximum likelihood estimation, with random intercepts to capture variation between and within patients, thus accounting for repeated measurements. Patients were censored when they switched their dialysis modality during follow-up or when they died or were transplanted. As a sensitivity analysis we repeated the LMM over 2 and 5 years of follow-up.
All statistical analyses were performed using SPSS statistical software, version 25.0 (IBM Corp., Armonk, NY, USA) and R version 4.0.3.
RESULTS
Baseline characteristics
Baseline characteristics of all dialysis patients (n = 1926), and separately for HD (n = 1256) and PD (n = 670), are presented in Table 1. In total, ∼70% (n = 1082) were bothered by pruritus, of whom ∼50% (n = 768) had mild/moderate and ∼20% (n = 314) severe/extreme pruritus. Dialysis Kt/V levels of HD patients were lower than expected, probably due to increased levels of eGFR.
Table 1:
Baseline characteristics (3 months after the start of dialysis) of all 1926 NECOSAD study participants.
| Dialysis modality | |||
|---|---|---|---|
| Baseline variables | All patients, N = 1926 | HD, N = 1256 | PD, N = 670 |
| Demographic/anthropometric | |||
| Age, years | 59.9 ± 15.1 | 63.8 ± 13.9 | 53.3 ± 14.8 |
| Sex, male, n (%) | 1196 (62.2) | 744 (59.4) | 452 (67.6) |
| Educational level, low, n (%) | 1005 (55.9) | 710 (61.0) | 295 (46.5) |
| Payed employment, yes, n (%) | 365 (20.4) | 150 (13.0) | 215 (34.0) |
| Married/living together, yes, n (%) | 1277 (70.7) | 792 (67.6) | 485 (76.3) |
| Race, n (%) | |||
| Caucasian | 1770 (91.9) | 1157 (92.1) | 613 (91.5) |
| Asian | 105 (5.5) | 68 (5.4) | 31 (5.0) |
| Black | 44 (2.3) | 29 (2.3) | 15 (2.2) |
| Smokinga, current, n (%) | 389 (22.4) | 235 (21.1) | 154 (24.8) |
| Body mass index, kg/m2 | 24.1 (21.9; 26.9) | 24 (21.8; 26.9) | 24.2 (22.2; 27) |
| Blood pressure (mmHg) | |||
| Systolic blood pressure | 149 ± 23 | 153 ± 22 | 140 ± 21 |
| Diastolic blood pressure | 82 ± 12 | 81 ± 11 | 84 ± 12 |
| SGA classification | 6 (5; 7) | 6 (5; 7) | 6 (6; 7) |
| Medication use, n (%) | |||
| Insulin analogues | 237 (13.9) | 148 (13.5) | 89 (14.7) |
| Phosphate binders | 1530 (90.0) | 978 (89.5) | 552 (90.9) |
| ACE inhibitors | 469 (24.5) | 278 (22.3) | 191 (28.6) |
| Diuretics | 517 (27.0) | 330 (26.5) | 187 (28.0) |
| Corticosteroids | 81 (4.2) | 64 (5.1) | 17 (2.5) |
| Comorbidity | |||
| History of cardiovascular diseaseb, yes, n (%) | 619 (35.6) | 462 (41.3) | 157 (25.3) |
| Diabetesc, yes, n (%) | 384 (22.3) | 261 (23.6) | 123 (20.0) |
| Psychiatric disease, yes, n (%) | 52 (3.0) | 38 (3.4) | 14 (2.3) |
| Davies comorbidityd, n (%) | |||
| No | 936 (48.9) | 535 (42.9) | 401 (60.0) |
| Intermediate | 808 (42.2) | 584 (46.8) | 224 (33.5) |
| Severe | 172 (9.0) | 129 (10.3) | 43 (6.4) |
| Hypertensione, yes, n (%) | 1553 (82.0) | 999 (81.0) | 554 (84.1) |
| Pruritus, n (%) | |||
| No | 461 (29.9) | 304 (30.7) | 157 (28.4) |
| Mild | 522 (33.8) | 322 (32.5) | 200 (36.2) |
| Moderate | 246 (15.9) | 157 (15.9) | 89 (16.1) |
| Severe | 193 (12.5) | 133 (13.4) | 60 (10.8) |
| Extreme | 121 (7.8) | 74 (7.5) | 47 (8.5) |
| Dry skin, n (%) | |||
| No | 467 (30.4) | 289 (29.3) | 178 (32.4) |
| Mild | 452 (29.4) | 273 (27.7) | 179 (32.5) |
| Moderate | 261 (17.0) | 170 (17.2) | 91 (16.5) |
| Severe | 236 (15.4) | 169 (17.1) | 67 (12.2) |
| Extreme | 121 (7.9) | 86 (8.7) | 35 (6.4) |
| Dialysis characteristics | |||
| Diuresis, ≥100 mL/24 h, n (%) | 1544 (97.8) | 936 (96.6) | 608 (99.8) |
| Residual diuresis, mL/24 h | 809 (433; 1400) | 709 (381; 1164) | 1050 (533; 1700) |
| Residual kidney function (mL/min/1.73 m2) | 3.4 (1.7; 5.3) | 3 (1.5; 4.8) | 4 (2.2; 6.2) |
| Total weekly Kt/Vf | 3.4 (2.8; 4) | 2.3 (1.9; 2.7) | |
| Dialysis Kt/Vf | 2.8 (2.2; 3.3) | 1.5 (1.2; 1.7) | |
| Frequency HD, n/week | |||
| 1 | 10 (0.8) | ||
| 2 | 432 (35.0) | ||
| 3 | 791 (64.1) | ||
| 4 | 1 (0.1) | ||
| Dialysis treatment time, h/week | 9 (8; 12) | ||
| Primary kidney disease, n (%) | |||
| Diabetes | 280 (14.6) | 178 (14.2) | 102 (15.2) |
| Glomerulonephritis | 234 (12.2) | 111 (8.9) | 123 (18.4) |
| Renal vascular disease | 328 (17.1) | 248 (19.8) | 80 (12.0) |
| Other | 1081 (56.2) | 717 (57.2) | 364 (54.4) |
| Biomarkers | |||
| Hemoglobin, mmol/L | 6.9 (6.3; 7.6) | 6.6 (6.1; 7.2) | 7.4 (6.8; 8) |
| Urea, mmol/L | 23.9 (19.6; 28.9) | 25.9 (21.7; 30.8) | 20.6 (16.5; 24.5) |
| Creatinine, µmol/L | 741 (587.0; 909.3) | 751.5 (603.0; 930.5) | 706 (565.0; 864.5) |
| Phosphate (PO4), mmol/L | 1.8 (1.4; 2.1) | 1.8 (1.4; 2.2) | 1.7 (1.4; 2.0) |
| Intact PTH, pmol/L | 13.9 (5.7; 29.8) | 14.2 (6.3; 30.3) | 12.9 (4.5; 29.0) |
| Albumin, g/L | 36.3 (33.0; 39.6) | 36.1 (33.0; 39.0) | 36.5 (33.0; 40.0) |
Where data are not n (%), they are mean ± SD or median (IQR).
aCurrent smoking was defined as current cigarette smokers including those who quit smoking in the past 3 months.
bDefined as any history of a cerebral vascular accident, a myocardial infarction or peripheral vascular disease.
cHistory of diabetes was defined based on diabetes mellitus registered as a comorbid condition or diabetic nephropathy as primary kidney disease.
dBased on the presence or absence of seven comorbidities. Low risk is classified as having no comorbid conditions; intermediate as having one or two comorbid conditions and severe as having three or more comorbid diseases.
eSystolic blood pressure ≥130 mmHg and/or the diastolic blood pressure ≥80 mmHg or use of antihypertensive drugs.
fDetermined using Watson's formula.
SGA, subjective global assessment; Kt/V, a number used to quantify hemodialysis and peritoneal dialysis treatment adequacy; ACE, angiotensin-converting enzyme; PTH, parathyroid hormone.
Figure 1 shows the burden score of pruritus over 10 years of follow-up. On average, PD patients have a slightly higher burden score of pruritus, compared with HD patients.
Figure 1:

Burden of pruritus (measured on a 5-point Likert scale) over time in HD and PD patients. Mean scores ±SD of pruritus are represented by the solid lines, over a period of 10 years. Blue lines represents HD patients, orange lines PD patients. Due to the long follow-up time, the number of patients contributing data differs across the time points in the graphs, see table attached. For HD and PD, median (IQR) and mean (±SD) eGFR are shown.
eGFR, dialysis adequacy, serum phosphate levels and pruritus
At baseline, both HD and PD patients with extreme pruritus compared with without pruritus had a lower eGFR of 1.8 and 2.6, versus 3.1 and 4.6 mL/min/1.73 m2, respectively (Supplementary data, Table S2). After 12 months of dialysis treatment, the average decrease of residual eGFR and urine volume in HD patients was 1.0 mL/min/1.73 m2 (SD 2.55) and 224 mL/24 h (SD 487), and in PD patients 1.1 mL/min/1.73 m2 (SD 2.37) and 258 mL/24 h (SD 670), respectively. In total, 2.8% of HD and 0.2% of PD patients were anuric at 12 months. In the first year of dialysis treatment 44 patients (3.9%) switched from HD to PD and 60 (9.7%) from PD to HD.
We found no association between residual eGFR and pruritus at baseline. However, we did find an inverse association between residual eGFR and pruritus at 12 months in both HD and PD patients. After multivariable adjustment, each 1 mL/min/1.73 m2 higher residual eGFR was associated with a significantly lower risk of pruritus in HD (OR 0.94, 95% CI 0.89; 0.99) and PD (OR 0.88, 95% CI 0.80; 0.95) patients (Tables 2A and 2B). Additional adjustment for dry skin attenuated the effect, representing possible mediation (data not shown). Using linear regression analysis, higher residual eGFR levels at 12 months were also significantly associated with lower burden scores for pruritus after multivariable adjustment with a beta of –0.05 (95% CI –0.09; –0.02) in HD patients (Supplementary data, Table S3A) and –0.09 (95% CI –0.13; –0.05) in PD patients (Supplementary data, Table S3B). A small, but not significant effect was observed between change in eGFR between baseline and 12 months, and pruritus at 12 months in HD and PD patients (0.03, 95% CI –0.01; 0.07 and 0.02, 95% CI –0.03; 0.08, respectively). No associations were observed between urine volume and pruritus in HD or PD patients (data not shown).
Table 2A:
Logistic regression analysis for the association between residual eGFR, dialysis Kt/V, total weekly Kt/V (including residual kidney function), serum phosphate levels and the presence of pruritus (yes/no) at baseline and 12 months after start dialysis among HD patients.
| Crude | Full model | ||||
|---|---|---|---|---|---|
| Pruritus | N | OR | 95% CI | OR | 95% CI |
| Baseline, N = 1256 | |||||
| No pruritus (score 1) | |||||
| Reference | 347 | 1.00 | 1.00 | ||
| Pruritus (score 2–5) | |||||
| eGFR, per 1 mL/min/1.73 m2 increase | 909 | 0.99 | 0.95; 1.04 | 0.99 | 0.94; 1.04 |
| Dialysis Kt/V, per 1 unit increase | 909 | 0.98 | 0.84; 1.15 | 0.98 | 0.83; 1.16 |
| Total weekly Kt/V, per 1 unit increase | 909 | 0.98 | 0.83; 1.16 | 0.98 | 0.82; 1.16 |
| Phosphate (PO4), per 1 mmol/L increase | 909 | 1.18 | 0.92; 1.51 | 1.18 | 0.92; 1.52 |
| 12 months, N = 918 | |||||
| No pruritus (score 1) | |||||
| Reference | 227 | 1.00 | 1.00 | ||
| Pruritus (score 2–5) | |||||
| eGFR, per 1 mL/min/1.73 m2 increase | 691 | 0.94 | 0.89; 1.00 | 0.94 | 0.89; 0.99 |
| Dialysis Kt/V, per 1 unit increase | 691 | 1.05 | 0.85; 1.28 | 1.06 | 0.86; 1.30 |
| Total weekly Kt/V, per 1 unit increase | 691 | 0.88 | 0.72; 1.07 | 0.87 | 0.71; 1.08 |
| Phosphate (PO4), per 1 mmol/L increase | 691 | 1.58 | 1.13; 2.22 | 1.63 | 1.15; 2.30 |
Full model = adjusted for age, sex, smoking and diabetes mellitus.
Kt/V, a number used to quantify hemodialysis and peritoneal dialysis treatment adequacy.
Table 2B:
Logistic regression analysis for the association between residual eGFR, dialysis Kt/V, total weekly Kt/V (including residual kidney function), serum phosphate levels and the presence of pruritus (yes/no) at baseline and 12 months after start dialysis among PD patients.
| Crude | Full model | ||||
|---|---|---|---|---|---|
| Pruritus | N | OR | 95% CI | OR | 95% CI |
| Baseline, N = 670 | |||||
| No pruritus (score 1) | |||||
| Reference | 176 | 1.00 | 1.00 | ||
| Pruritus (score 2–5) | |||||
| eGFR, per 1 mL/min/1.73 m2 increase | 494 | 0.94 | 0.88; 1.00 | 0.94 | 0.88; 1.00 |
| Dialysis Kt/V, per 1 unit increase | 494 | 0.99 | 0.64; 1.55 | 1.00 | 0.60; 1.66 |
| Total weekly Kt/V, per 1 unit increase | 494 | 0.76 | 0.57; 1.01 | 0.74 | 0.54; 1.01 |
| Phosphate (PO4), per 1 mmol/L increase | 494 | 1.82 | 1.20; 2.76 | 1.74 | 1.14; 2.66 |
| 12 months, N = 490 | |||||
| No pruritus (score 1) | |||||
| Reference | 96 | 1.00 | 1.00 | ||
| Pruritus (score 2–5) | |||||
| eGFR, per 1 mL/min/1.73 m2 increase | 394 | 0.88 | 0.82; 0.95 | 0.88 | 0.80; 0.95 |
| Dialysis Kt/V, per 1 unit increase | 394 | 1.13 | 0.70; 1.81 | 1.15 | 0.70; 1.89 |
| Total weekly Kt/V, per 1 unit increase | 394 | 0.66 | 0.47; 0.92 | 0.63 | 0.45; 0.89 |
| Phosphate (PO4), per 1 mmol/L increase | 394 | 1.76 | 1.04; 2.99 | 1.81 | 1.06; 3.10 |
Full model = adjusted for age, sex, smoking and diabetes mellitus.
Kt/V, a number used to quantify hemodialysis and peritoneal dialysis treatment adequacy.
After multivariable adjustment, an inverse relation was shown between eGFR and weekly dialysis Kt/V: in HD (beta –0.07, 95% CI –0.09; –0.05) and PD (beta –0.04, 95% CI –0.05; –0.03) patients. A negligible association was observed between urine volume and eGFR in HD and PD patients.
We found no associations in HD and PD patients between weekly dialysis Kt/V and pruritus after multivariable adjustment at baseline or at 12 months (Tables 2A and 2B, Supplementary data, Tables S3A and S3B).
At baseline, in both HD and PD patients no effect was found of total weekly KT/V on pruritus (Tables 2A and 2B). However, at 12 months a significant inverse association was observed in PD patients (OR 0.63, 95% CI 0.45; 0.89) (Table 2B). Additional adjustment for eGFR led to attenuation of the effect (OR 0.65, 95% CI 0.43; 0.98). Potential mediation effect was shown for serum phosphate levels and dry skin. Using linear regression analyses, higher total weekly Kt/V at 12 months was also significantly associated with lower burden scores for pruritus after multivariable adjustment, in both HD (Supplementary data, Table S3A) (beta –0.15, 95% CI –0.26; –0.05) and PD (Supplementary data, Table S3B) (beta –0.35, 95% CI –0.54; –0.16) patients. Additional adjustment for eGFR led to attenuation of the effect, with beta –0.10 (95% CI –0.23; 0.02) in HD patients and –0.28 (95% CI –0.49; –0.07) in PD patients.
A positive association was seen between serum phosphate levels and the risk of pruritus, in both HD and PD patients. After multivariable adjustment, at 12 months, each 1 mmol/L increase in serum phosphate level was associated with a 1.63 times increased odds of pruritus in HD (95% CI 1.15; 2.30) (Table 2A) and 1.81 times higher odds in PD (95% CI 1.06; 3.10) patients (Table 2B). Similar associations were observed at baseline in PD patients (OR 1.74, 95% CI 1.14; 2.66). Moreover, linear regression analysis showed that increased serum phosphate levels at 12 months were significantly associated with higher burden scores for pruritus with a beta of 0.34 (95% CI 0.17; 0.51) in HD patients (Supplementary data, Table S3A) and 0.45 (95% CI 0.19; 0.71) in PD patients (Supplementary data, Table S3B).
The abovementioned associations were similar when logistic regression analyses were performed with pruritus divided into three categories (Supplementary data, Tables S4a until S7b).
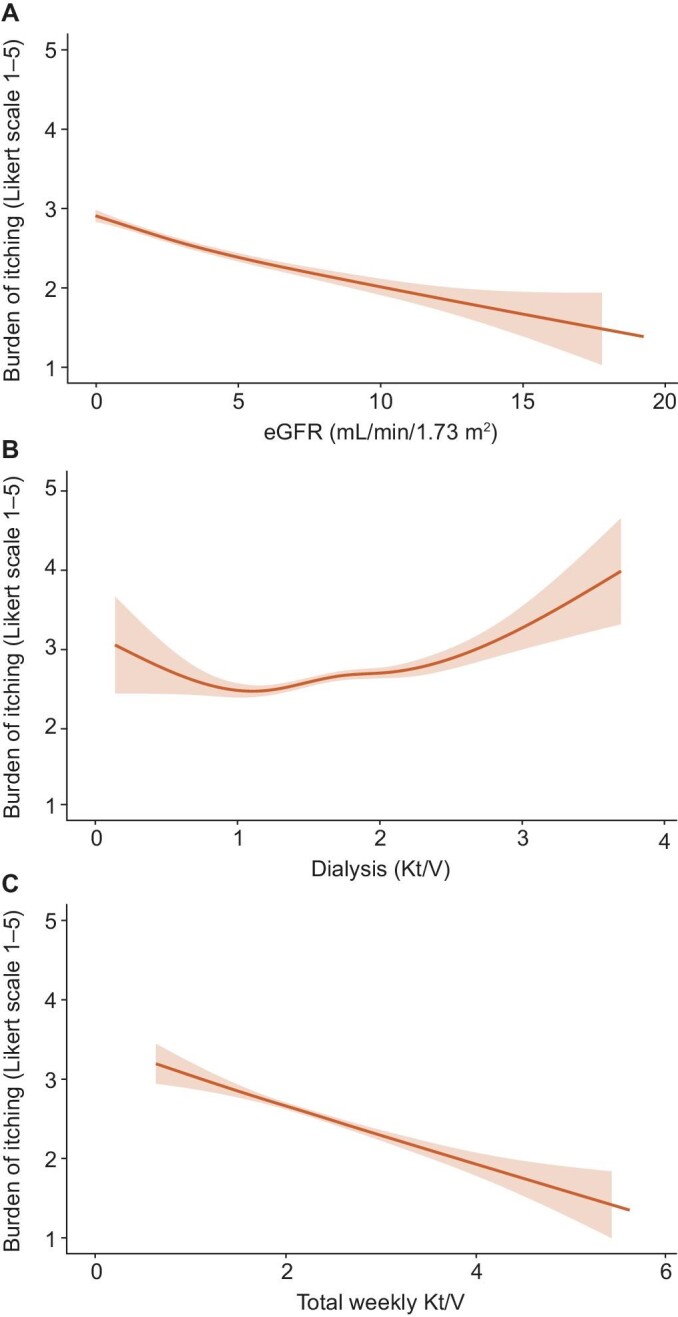
Findings from the LMM analyses over 10 years of follow-up were similar to the cross-sectional analyses, showing an inverse relation between eGFR and pruritus: in HD (–0.04, 95% CI –0.05; –0.02) (Table 3A, Fig. 2) and PD (–0.08, 95% CI –0.10; –0.06) (Table 3B, Fig. 3) patients. In addition, significant associations were observed in PD patients between dialysis Kt/V, total weekly Kt/V and pruritus (0.25, 95% CI 0.10; 0.39 and –0.27, 95% CI –0.37; –0.17, respectively) (Table 3B, Fig. 3). Comparable results were found after 2 and 5 years follow-up (data not shown).
Table 3A:
Linear mixed models analyses for the association between residual eGFR, dialysis Kt/V, total weekly Kt/V (including residual kidney function) and pruritus over 10 year follow-up among HD patients.
| Pruritusa | N | Coef. | 95% CI |
|---|---|---|---|
| eGFR, per 1 mL/min/1.73 m2 increase | 958 | –0.04 | –0.05; –0.02 |
| Dialysis Kt/V, per 1 unit increase | 1048 | 0.03 | –0.01; 0.06 |
| Total weekly Kt/V, per 1 unit increase | 959 | –0.01 | –0.06; 0.03 |
aMeasured on a 5-item Likert scale, with higher scores meaning more bothered.
Kt/V, a number used to quantify hemodialysis and peritoneal dialysis treatment adequacy.
Figure 2:

Linear mixed models analyses for the association between residual eGFR (A), dialysis Kt/V (B), total weekly Kt/V (including residual kidney function) (C) and pruritus over 10 year follow-up among HD patients.
Table 3B:
Linear mixed models analyses for the association between residual eGFR, dialysis Kt/V, total weekly Kt/V (including residual kidney function) and pruritus over 10 year follow-up among PD patients.
| Pruritusa | N | Coef. | 95% CI |
|---|---|---|---|
| eGFR, per 1 mL/min/1.73 m2 increase | 571 | –0.08 | –0.10; –0.06 |
| Dialysis Kt/V, per 1 unit increase | 544 | 0.25 | 0.10; 0.39 |
| Total weekly Kt/V, per 1 unit increase | 539 | –0.27 | –0.37; –0.17 |
aMeasured on a 5-item Likert scale, with higher scores meaning more bothered.
Kt/V, a number used to quantify hemodialysis and peritoneal dialysis treatment adequacy.
Figure 3:
Linear mixed models analyses for the association between residual eGFR (A), dialysis Kt/V (B), total weekly Kt/V (including residual kidney function) (C) and pruritus over 10 year follow-up among PD patients.
No effect modification was observed between total weekly Kt/V and diabetes, or serum phosphate on the presence of pruritus at baseline in HD or PD patients (Supplementary data, Table S9a/b).
DISCUSSION
In this cohort of 1926 incident chronic dialysis patients, the prevalence of pruritus was 70%, of whom 20% experienced severe/extreme burden to pruritus. Over time, PD patients had on average a slightly higher burden score of pruritus compared with HD patients. Higher residual kidney function and lower levels of serum phosphate were associated with a decreased risk of pruritus in both HD and PD patients at 12 months after start of dialysis. In contrast, we found no association between dialysis dose and pruritus.
The negative impact of pruritus on quality of life in patients on dialysis is widely known [6]. In line with our findings, the Dialysis Outcomes and Practice Patterns Study (DOPPS), which included over 23 000 HD patients from 21 countries, found that ∼70% of HD patients suffer from pruritus, of whom ∼45% has moderate/severe pruritus [11, 25]. Several studies have compared the prevalence of pruritus in HD and PD patients, with mixed results [26–29]. We found no difference in the prevalence of pruritus between HD and PD patients 3 months after start of dialysis. Other studies observed that longer dialysis vintage was associated with higher pruritus scores [29, 30]. We hypothesized that a declining residual kidney function might explain the association between longer dialysis vintage and higher pruritus burden. In this NECOSAD study we found that higher residual kidney function at 12 months was significantly associated with lower burden score of pruritus in both HD (beta –0.05, 95% CI –0.09; –0.02) and PD (beta –0.09, 95% CI –0.13; –0.05) patients. Similar results were found over 10 years of longitudinal follow-up using LMM (HD: –0.04, 95% CI –0.05; –0.02 and PD: –0.08, 95% CI –0.10; –0.06). Despite the effect being small, these findings may confirm the hypothesis that residual kidney function plays an important role in the pathogenesis and severity of pruritus. We found no association between residual kidney function and pruritus at baseline, which may be attributed to the fact that residual eGFR levels were still rather “high” when starting dialysis (median 3.4 mL/min/1.73 m2, IQR 1.7; 5.3) compared with after 12 months of treatment (median 2.0 mL/min/1.73 m2, IQR 0.7; 3.9). In addition, we found no association between urine volume and pruritus. Differences in results between studies might be due to variation in residual kidney function.
We also observed that after multivariable adjustment, each 1 unit increase in total weekly Kt/V at 12 months was associated with a decrease in pruritus burden score of –0.15 (95% CI –0.26; –0.05) in HD patients and –0.35 (95% CI –0.54; –0.16) in PD patients. Using LMM over 10 years follow-up, this relation persisted in PD patients (–0.27, 95% CI –0.37; –0.17). In contrast, we found no cross-sectional relation between weekly dialysis Kt/V dose (thus without residual kidney function) and pruritus. A positive association was observed between dialysis Kt/V and pruritus in PD patients using LMM (0.25, 95% CI 0.10; 0.39). Higher prescribed dialysis Kt/V dose is related to less residual kidney function, which may explain the positive association with pruritus burden. In the DOPPS I study (n = 17 034) a significantly lower risk of moderate/severe pruritus in HD patients with a single pool Kt/V > 1.5 per dialysis session (P ≤ .004) was shown, whereas no relation was found in the DOPPS II study (n = 12 839) [11]. Unfortunately, In the DOPPS I and II study there was no information available regarding residual kidney function. The relation between dialysis adequacy and pruritus in patients receiving PD has rarely been reported. In the study of Wu et al. [31] (n = 85) a higher intensity of pruritus was noted among PD patients with a weekly total Kt/V < 1.88. They suggested that a Kt/V above the current target may not further improve survival but is able to remove more pruritogenic substances and thereby lower the intensity of pruritus in both HD and PD patients. A low Kt/V might be associated with higher phosphate levels, but not necessarily [32, 33]. We observed at 12 months after starting dialysis, that after multivariable adjustment, each 1 mmol/L increase in serum phosphate levels was significantly associated with an increase in burden score for pruritus of 0.34 (95% CI 0.17; 0.51) in HD patients and 0.45 (95% CI 0.19; 0.71) in PD patients.
Finally, dry skin is present in 50%–85% of patients with CKD-aP, which likely aggravates pruritus and leaves people predisposed to poor wound healing [9, 11]. In the NECOSAD study, 78% of the patients with CKD-aP are bothered by dry skin. It is at present unclear to what extent dry skin causes pruritus or vice versa. We controlled in our analyses for dry skin, which resulted in effect attenuation, which may suggest a mediation effect.
The inverse relation found between residual kidney function and pruritus in dialysis patients is clinically relevant. Most likely, uremic toxin deposition in the skin that is not effectively removed during dialysis plays an important role in pruritus [34]. This is underscored by the fact that pruritus resolves after kidney transplantation in about 74% of HD patients [35]. It is now believed that residual kidney function in patients undergoing dialysis reflects not only glomerular filtration, but also tubular secretion of protein-bound organic anions or uremic toxins [15]. These protein-bound organic anions are only partly (about 10%) removed by dialysis treatment [15]. This may explain our null finding between dialysis Kt/V and pruritus. Probably the retention of protein-bound organic anions as a consequence of a declining residual kidney function may explain the inverse relation with pruritus.
This study has several strengths. This is the first study that only included incident dialysis patients and was large enough to compare HD and PD patients separately. Second, since residual kidney function was measured, we could untangle the effect of eGFR based on 24 h urine collection and dialysis dose on the burden of pruritus.
Nevertheless, this study has limitations. First, we encountered missing data. However, we used multiple imputation to maintain power and minimize bias. Second, this study has an observational design, and therefore no causal inferences can be made. Third, scoring pruritus by a questionnaire may be susceptible to misclassification. However, in general, non-differential misclassification results in underestimation of the effect [36]. Fourth, medication that may have an influence on pruritus was not incorporated in the analyses [25]. Fifth, the widely used calculation of weekly standard Kt/V according to the KDQOI 2015 guidelines [37] could not be incorporated as dialysis time and frequency of PD patients was missing. Therefore, weekly Kt/V was calculated according to the paper of Termorshuizen et al. [19], which opened the possibility to compare HD and PD groups.
In conclusion, higher residual kidney function and lower serum phosphate levels, but not dialysis dose, were associated with a lower risk of pruritus in both HD and PD patients. These results may inform future guidelines about prevention and treatment of pruritus, and emphasizes the importance of residual kidney function in chronic dialysis patients.
Supplementary Material
ACKNOWLEDGEMENTS
We thank the investigators and study nurses of the participating dialysis centers and the data managers of the NECOSAD for collection and management of data. We thank the nursing staff of the participating dialysis centers and the staff of the NECOSAD trial office for their invaluable assistance in the collection and management of data for this study.
Contributor Information
Robin Lengton, Department of Clinical Epidemiology, Leiden University Medical Centre, Leiden, The Netherlands.
Esmee M van der Willik, Department of Clinical Epidemiology, Leiden University Medical Centre, Leiden, The Netherlands.
Esther N M de Rooij, Department of Clinical Epidemiology, Leiden University Medical Centre, Leiden, The Netherlands; Department of Nephrology, Leiden University Medical Centre, Leiden, The Netherlands.
Yvette Meuleman, Department of Clinical Epidemiology, Leiden University Medical Centre, Leiden, The Netherlands.
Saskia Le Cessie, Department of Clinical Epidemiology, Leiden University Medical Centre, Leiden, The Netherlands; Section Medical Statistics, Department of Biomedical Datasciences, Leiden University Medical Centre, Leiden, The Netherlands.
Wieneke M Michels, Department of Nephrology, Leiden University Medical Centre, Leiden, The Netherlands.
Marc Hemmelder, Department of Internal Medicine, Division of Nephrology, Maastricht University Medical Centre and CARIM Research School for Cardiovascular Disease, Maastricht, The Netherlands.
Friedo W Dekker, Department of Clinical Epidemiology, Leiden University Medical Centre, Leiden, The Netherlands.
Ellen K Hoogeveen, Department of Clinical Epidemiology, Leiden University Medical Centre, Leiden, The Netherlands; Department of Nephrology, Leiden University Medical Centre, Leiden, The Netherlands; Department of Nephrology, Jeroen Bosch Hospital, den Bosch, The Netherlands.
FUNDING
The NECOSAD was supported by grants from the Dutch Kidney Foundation and the Dutch National Health Insurance Board. This project was supported by an unrestricted grant from Vifor Pharma. The funders did not have any role in study design, writing the report, or the decision to submit the report for publication.
AUTHORS’ CONTRIBUTIONS
Research idea and study design: R.L., F.W.D., E.K.H.; statistical analysis: R.L., E.N.M.R., S.L.C., F.W.D., E.K.H.; interpretation: all authors; supervision or mentorship: F.W.D., E.K.H. Each author contributed important intellectual content during manuscript drafting or revision and accepts accountability for the overall work by ensuring that questions pertaining to the accuracy or integrity of any portion of the work are appropriately investigated and resolved.
CONFLICT OF INTEREST STATEMENT
All authors declare that they have no relevant financial interests or disclosures to report.
DATA AVAILABILITY STATEMENT
As our data could be used to identify individuals, privacy concerns prevent us from allowing them to be publically available. Nevertheless, data will be available (conditional on agreement on privacy matters and appropriate usage of the data) upon request. Contact information: Friedo W. Dekker, F.W.Dekker@lumc.nl.
REFERENCES
- 1. Hu X, Sang Y, Yang Met al. Prevalence of chronic kidney disease-associated pruritus among adult dialysis patients: a meta-analysis of cross-sectional studies. Medicine (Baltimore) 2018;97:e10633. [DOI] [PMC free article] [PubMed] [Google Scholar]
- 2. Sukul N, Karaboyas A, Csomor PAet al. Self-reported pruritus and clinical, dialysis-related, and patient-reported outcomes in hemodialysis patients. Kidney Med 2021;3:42–53.e1. [DOI] [PMC free article] [PubMed] [Google Scholar]
- 3. Mathur VS, Lindberg J, Germain Met al. A longitudinal study of uremic pruritus in hemodialysis patients. Clin J Am Soc Nephrol 2010;5:1410–9. [DOI] [PMC free article] [PubMed] [Google Scholar]
- 4. Ko MJ, Wu HY, Chen HYet al. Uremic pruritus, dialysis adequacy, and metabolic profiles in hemodialysis patients: a prospective 5-year cohort study. PLoS One 2013;8:e71404. [DOI] [PMC free article] [PubMed] [Google Scholar]
- 5. Rayner HC, Larkina M, Wang Met al. International comparisons of prevalence, awareness, and treatment of pruritus in people on hemodialysis. Clin J Am Soc Nephrol 2017;12:2000–7. [DOI] [PMC free article] [PubMed] [Google Scholar]
- 6. van der Willik EM, Lengton R, Hemmelder MHet al. Itching in dialysis patients: impact on health-related quality of life and interactions with sleep problems and psychological symptoms - results from the RENINE/PROMs registry. Nephrol Dial Transplant 2022;37:1731–41. [DOI] [PMC free article] [PubMed] [Google Scholar]
- 7. Balak DMW, Kemperman PMJH, Bing Thio H.. Chronische jeuk. Ned Tijdschr Geneeskd; 2021;165:D5199. [PubMed] [Google Scholar]
- 8. Swarna SS, Aziz K, Zubair Tet al. Pruritus associated with chronic kidney disease: a comprehensive literature review. Cureus 2019;11:e5256. [DOI] [PMC free article] [PubMed] [Google Scholar]
- 9. Combs SA, Teixeira JP, Germain MJ.. Pruritus in kidney disease. Semin Nephrol 2015;35:383–91. [DOI] [PMC free article] [PubMed] [Google Scholar]
- 10. Ozen N, Cinar FI, Askin Det al. Uremic pruritus and associated factors in hemodialysis patients: a multi-center study. Kidney Res Clin Pract 2018;37:138–47. [DOI] [PMC free article] [PubMed] [Google Scholar]
- 11. Pisoni RL, Wikstrom B, Elder SJet al. Pruritus in haemodialysis patients: international results from the Dialysis Outcomes and Practice Patterns Study (DOPPS). Nephrol Dial Transplant 2006;21:3495–505. [DOI] [PubMed] [Google Scholar]
- 12. Duque MI, Thevarajah S, Chan YHet al. Uremic pruritus is associated with higher kt/V and serum calcium concentration. Clin Nephrol 2006;66:184–91. [DOI] [PubMed] [Google Scholar]
- 13. Zucker I, Yosipovitch G, David Met al. Prevalence and characterization of uremic pruritus in patients undergoing hemodialysis: uremic pruritus is still a major problem for patients with end-stage renal disease. J Am Acad Dermatol 2003;49:842–6. [DOI] [PubMed] [Google Scholar]
- 14. Dyachenko P, Shustak A, Rozenman D.. Hemodialysis-related pruritus and associated cutaneous manifestations. Int J Dermatol 2006;45:664–7. [DOI] [PubMed] [Google Scholar]
- 15. Lowenstein J, Grantham JJ.. Residual renal function: a paradigm shift. Kidney Int 2017;91:561–5. [DOI] [PubMed] [Google Scholar]
- 16. Hoogeveen EK, Halbesma N, Rothman KJet al. Obesity and mortality risk among younger dialysis patients. Clin J Am Soc Nephrol 2012;7:280–8. [DOI] [PMC free article] [PubMed] [Google Scholar]
- 17. van Dijk PC, Jager KJ, de Charro Fet al. Renal replacement therapy in Europe: the results of a collaborative effort by the ERA-EDTA registry and six national or regional registries. Nephrol Dial Transplant 2001;16:1120–9. [DOI] [PubMed] [Google Scholar]
- 18. Jansen MA, Hart AA, Korevaar JCet al. Predictors of the rate of decline of residual renal function in incident dialysis patients. Kidney Int 2002;62:1046–53. [DOI] [PubMed] [Google Scholar]
- 19. Termorshuizen F, Dekker FW, van Manen JGet al. Relative contribution of residual renal function and different measures of adequacy to survival in hemodialysis patients: an analysis of the Netherlands Cooperative Study on the Adequacy of Dialysis (NECOSAD)-2. J Am Soc Nephrol 2004;15:1061–70. [DOI] [PubMed] [Google Scholar]
- 20. Watson PE, Watson ID, Batt RD.. Total body water volumes for adult males and females estimated from simple anthropometric measurements. Am J Clin Nutr 1980;33:27–39. [DOI] [PubMed] [Google Scholar]
- 21. Termorshuizen F, Korevaar JC, Dekker FWet al. Time trends in initiation and dose of dialysis in end-stage renal disease patients in The Netherlands. Nephrol Dial Transplant 2003;18:552–8. [DOI] [PubMed] [Google Scholar]
- 22. Hays RD, Kallich JD, Mapes DLet al. Development of the kidney disease quality of life (KDQOL) instrument. Qual Life Res 1994;3:329–38. [DOI] [PubMed] [Google Scholar]
- 23. de Goeij MC, van Diepen M, Jager KJet al. Multiple imputation: dealing with missing data. Nephrol Dial Transplant 2013;28:2415–20. [DOI] [PubMed] [Google Scholar]
- 24. Moons KG, Donders RA, Stijnen Tet al. Using the outcome for imputation of missing predictor values was preferred. J Clin Epidemiol 2006;59:1092–101. [DOI] [PubMed] [Google Scholar]
- 25. Shirazian S, Aina O, Park Yet al. Chronic kidney disease-associated pruritus: impact on quality of life and current management challenges. Int J Nephrol Renov Dis 2017;10:11–26. [DOI] [PMC free article] [PubMed] [Google Scholar]
- 26. Mettang T, Fritz P, Weber Jet al. Uremic pruritus in patients on hemodialysis or continuous ambulatory peritoneal dialysis (CAPD). The role of plasma histamine and skin mast cells. Clin Nephrol 1990;34:136–41. [PubMed] [Google Scholar]
- 27. Tessari G, Dalle Vedove C, Loschiavo Cet al. The impact of pruritus on the quality of life of patients undergoing dialysis: a single centre cohort study. J Nephrol 2009;22:241–8. [PubMed] [Google Scholar]
- 28. Wu HY, Peng YS, Chen HYet al. A comparison of uremic pruritus in patients receiving peritoneal dialysis and hemodialysis. Medicine (Baltimore) 2016;95:e2935. [DOI] [PMC free article] [PubMed] [Google Scholar]
- 29. Min JW, Kim SH, Kim YOet al. Comparison of uremic pruritus between patients undergoing hemodialysis and peritoneal dialysis. Kidney Res Clin Pract 2016;35:107–13. [DOI] [PMC free article] [PubMed] [Google Scholar]
- 30. Ramakrishnan K, Bond TC, Claxton Aet al. Clinical characteristics and outcomes of end-stage renal disease patients with self-reported pruritus symptoms. Int J Nephrol Renovasc Dis 2013;7:1–12. [DOI] [PMC free article] [PubMed] [Google Scholar]
- 31. Wu HY, Huang JW, Tsai WCet al. Prognostic importance and determinants of uremic pruritus in patients receiving peritoneal dialysis: a prospective cohort study. PLoS One 2018;13:e0203474. [DOI] [PMC free article] [PubMed] [Google Scholar]
- 32. Tattersall J, Martin-Malo A, Pedrini Let al. EBPG guideline on dialysis strategies. Nephrol Dial Transplant 2007;22:ii5–21. [DOI] [PubMed] [Google Scholar]
- 33. Tattersall J, Canaud B, Heimburger Oet al. High-flux or low-flux dialysis: a position statement following publication of the Membrane Permeability Outcome study. Nephrol Dial Transplant 2010;25:1230–2. [DOI] [PubMed] [Google Scholar]
- 34. Berger TG, Steinhoff M.. Pruritus and renal failure. Semin Cutan Med Surg 2011;30:99–100. [DOI] [PMC free article] [PubMed] [Google Scholar]
- 35. Krajewski PK, Olczyk P, Krajewska Met al. Clinical characteristics of itch in renal transplant recipients. Front Med 2020;7:615334. [DOI] [PMC free article] [PubMed] [Google Scholar]
- 36. Rothman KJ, Greenland S.. Modern Epidemiology. 2nd edn.Philadelphia: Lippincott-Raven, 1998. [Google Scholar]
- 37. National Kidney Foundation . KDOQI Clinical Practice Guideline for Hemodialysis Adequacy: 2015 update. Am J Kidney Dis 2015;66:884–930. [DOI] [PubMed] [Google Scholar]
Associated Data
This section collects any data citations, data availability statements, or supplementary materials included in this article.
Supplementary Materials
Data Availability Statement
As our data could be used to identify individuals, privacy concerns prevent us from allowing them to be publically available. Nevertheless, data will be available (conditional on agreement on privacy matters and appropriate usage of the data) upon request. Contact information: Friedo W. Dekker, F.W.Dekker@lumc.nl.