

Abstract
Background
Sudden acquired retinal degeneration syndrome (SARDS) is a common cause of irreversible blindness in dogs. It bears clinical resemblance to hypercortisolism, which can be associated with hypercoagulability. The role of hypercoagulability in dogs with SARDS is unknown.
Objective
Determine hemostatic profiles in dogs with SARDS.
Animals
Prospective pilot study: Dogs with a history of SARDS (n = 12). Prospective case‐control study: Dogs with recent onset of SARDS (n = 7) and age‐, breed‐, and sex‐matched controls (n = 7).
Methods
Prospective pilot study: We performed thromboelastography (TEG). Prospective case‐control study: Dogs had CBC, serum biochemistry, urinalysis, TEG, fibrinogen concentration, antithrombin activity, D‐dimers, thrombin‐antithrombin complexes, and optical platelet aggregometry performed.
Results
Prospective pilot study: 9/12 dogs with a history of SARDS were hypercoagulable with increased TEG G value and 2/3 had hyperfibrinogenemia. Case‐control study: All dogs with SARDS and 5/7 controls were hypercoagulable based on TEG G value. Dogs with SARDS had significantly higher G values (median, 12.7 kdynes/s; range, 11.2‐25.4; P = .04) and plasma fibrinogen concentration (median, 463 mg/dL; range, 391‐680; P < .001) compared to controls.
Conclusions and Clinical Importance
Hypercoagulability was common in both dogs with SARDS and controls, but dogs with SARDS were significantly more hypercoagulable on TEG. The role of hypercoagulability in the pathogenesis of SARDS remains to be determined.
Keywords: coagulation, fibrinogen, hypercoagulability, SARDS
Abbreviations
- aPTT
activated partial thromboplastin time
- AT
antithrombin
- CSCR
central serous chorioretinopathy
- ERG
electroretinogram
- HC
hypercortisolism
- MA
TEG maximum amplitude
- PAI‐1
plasminogen activator inhibitor‐1
- PPP
platelet‐poor plasma
- PRP
platelet‐rich plasma
- PT
prothrombin time
- SARDS
sudden acquired retinal degeneration syndrome
- TAT
thrombin‐antithrombin
- TEG
thromboelastography
1. INTRODUCTION
Sudden acquired retinal degeneration syndrome (SARDS) is a leading cause of irreversible blindness in dogs, but its pathogenesis is incompletely characterized. 1 , 2 , 3 It occurs in a variety of dog breeds, making a genetic etiology unlikely. An immune‐mediated pathogenesis has been suggested previously because many dogs with SARDS have circulating antiretinal antibodies. 4 , 5 , 6 However, systemic administration of the immunosuppressant drug mycophenolate mofetil is not associated with vision recovery in affected dogs. 7 Anecdotally, although monotherapy with systemic corticosteroids does not improve vision in SARDS, 1 , 8 combination immunosuppressive therapy results in better vision restoration than monotherapy. 8 This observation supports a possible immune system role in SARDS pathophysiology. Overall, the underlying pathogenesis of SARDS is unknown, and understanding it could provide a stronger, mechanistic link between immune system activation and retinal disease. A crucial knowledge gap is the lack of understanding of the etiopathogenesis of SARDS. Overcoming this gap could allow development of biomarkers to diagnose affected dogs before the onset of overt blindness and mechanistically relevant treatments to preserve vision. Currently, no useful biomarkers of early disease are available because nonocular clinical signs are either absent or overlap with more common endocrinopathies, and dogs are not diagnosed with SARDS until the onset of overt vision deficit. 9
Dogs with SARDS frequently exhibit a myriad of systemic signs, some of which are reminiscent of hypercortisolism (HC). 8 , 9 , 10 , 11 These include polyuria, polydipsia, polyphagia, and weight gain. Several laboratory abnormalities also are seen in dogs with SARDS, some of which overlap with HC, including increased liver enzyme activity 8 , 9 , 12 and proteinuria. 12 A recent survey of owners of dogs with SARDS found that kidney, respiratory, pancreatic, and platelet disorders were present more commonly in affected dogs around the time of death compared to a general reference population. 8 Systemic hypercoagulability, assessed by thromboelastography (TEG), has been identified in some dogs with systemic illnesses, including HC, 13 , 14 , 15 , 16 , 17 protein‐losing nephropathy, 18 , 19 and pancreatitis. 20 This association led to our hypothesis that systemic hypercoagulability underlying a prothrombotic state is a contributing factor in dogs with SARDS. Our working hypothesis is that intravascular thrombosis contributes to impaired choroidal vascular perfusion and other end‐organ damage, thus potentially linking the disruptions identified in the systemic circulation with the retinal and systemic consequences in dogs with SARDS.
Our primary aims were to determine whether dogs with SARDS evaluated at a large referral hospital had abnormal hemostatic laboratory test results at any stage after SARDS diagnosis, and if dogs with recently diagnosed SARDS were hypercoagulable on TEG compared to healthy age‐, sex‐, and breed‐matched control dogs. Our rationale was to explore whether hemostatic dysfunction might provide novel biomarkers or therapeutic targets for dogs with SARDS. Our hypothesis was that dogs with SARDS would be hypercoagulable compared to healthy controls.
2. MATERIALS AND METHODS
2.1. Animals
Prospective animal work was conducted with institutional approval (North Carolina State University Institutional Animal Care and Use Committee, hospital board) and client written informed consent.
2.2. Study design
2.2.1. Pilot study for TEG
Owners of dogs with a history of SARDS were invited to participate in a pilot study to evaluate TEG in their dogs to allow a priori power analysis for a prospective case‐control study. Some dogs also underwent further coagulation testing and CBC. A priori power analysis was performed on TEG data from a cohort of 8 dogs in this pilot study (median age, 10.3 years; range, 7.1‐11.8 years) and historical data collected by the investigators from 8 approximately age‐matched, apparently healthy dogs (median age, 8.0 years; range, 5.5‐10.6 years). Age did not differ significantly between groups (P = .14, 2‐tailed unpaired Student's t test). Normality tests of TEG maximum amplitude (MA) values in both groups indicated normal distribution (Shapiro‐Wilk test W 0.98 control, P = .98; 0.89 SARDS, P = .22). Median TEG MA in dogs with SARDS was 71.2 mm (range, 61.8‐78.4 mm; reference interval, 47‐65 mm; values from 6 dogs exceeded the reference range) compared with normal dogs at 60.5 mm (range, 52.5‐66.5; 1 dog exceeded the reference range). Assuming normal distribution in both groups, sample size for the prospective case‐control study was predicted to be 6 in each group, with a power of 0.8 and an alpha of 5%.
2.2.2. Prospective case‐control study
Dogs with a recent diagnosis of SARDS were recruited from those presented primarily to the ophthalmology service of North Carolina State University Veterinary Hospital and by recruitment from confirmed cases of SARDS presented to local ophthalmologists. No dogs were previously included in the pilot study. Age‐, breed‐, and sex‐matched controls were recruited after SARDS case recruitment from dogs belonging to members of staff and students at North Carolina State University. Dogs with SARDS were eligible for inclusion if body weight was >5 kg, vision loss occurred <6 weeks prior, and the fundus was clearly visible by ophthalmoscopy. A definitive diagnosis of SARDS was made based on history, minimal fundus evidence of retinal degeneration with severe attenuation of electroretinography (ERG) a‐ and b‐wave amplitudes, and consistent chromatic pupillary light reflex (PLR) findings, 2 specifically, an absence of red light response with preserved blue light response. Exclusion criteria for the SARDS group included systemic administration of immunosuppressive medications within the previous 21 days, any prior history of systemic or ocular neoplasia, uveitis, glaucoma, mature or hypermature cataracts, intraocular surgery, inherited retinal disorders, kidney disease, hepatopathy, and known pre‐existing endocrinopathy. Likewise, dogs that had received PO, parenteral or topical corticosteroids, or medications that could predispose to hypocoagulability (eg, nonsteroidal anti‐inflammatory drugs, platelet inhibitors, omega 3 fatty acids) within the last 2 months were excluded.
After recruitment of dogs with SARDS, matched control dogs were recruited. Dogs were eligible for inclusion if body weight >5 kg, they had a history of normal vision and systemic health, and were of comparable breed, age, and sex to a dog with SARDS. Exclusion criteria for the control dogs were similar to dogs with SARDS, in addition to a history or clinical finding of abnormal vision in either eye.
2.3. Ophthalmic examination
Pilot study and case‐control dogs underwent full ophthalmic examination including menace response, evaluation of chromatic PLR, evaluation of tear production, corneal fluorescein staining, slit lamp biomicroscopy, and binocular indirect ophthalmoscopy. If ERG had not been performed previously and reviewed by the authors before enrollment, an ERG was performed on both eyes after 1 hour of dark adaptation with pharmacologic mydriasis (Tropicamide 1%). The ERGs were performed using a handheld ERG unit (RetEVet, LKC Technologies, Gaithersburg, Maryland) with contact lens electrodes (ERG‐Jet, Fabrinal, La Chaux‐de‐Fonds, Switzerland) and platinum ground electrode placed at the occiput and platinum reference electrode placed 3 cm from the lateral canthus (Grass; Natus Neurology, Middleton, Wisconsin). A dark‐adapted intensity‐response series followed by a light‐adapted protocol was performed according to published guidelines for ERGs in dogs. 21
2.4. Sample collection and handling
After ophthalmic examination, a blood sample was collected from each pilot study and case‐control study dog by venipuncture of the jugular vein using a 21‐gauge butterfly needle and plastic vacutainer blood tubes. The blood was collected sequentially into a plain tube, a tube containing 3.2% sodium citrate (at a ratio of 1:9 citrate:whole blood), and a tube containing 7.5% potassium EDTA. In addition, a voided urine sample was collected from each case‐control study dog.
2.5. Baseline laboratory assessment
Case‐control study (SARDS and control) dogs all had CBC (Advia120 Hematology Analyzer Siemens Diagnostics Tarrytown, New York), serum biochemistry analysis (Stago Compact, Diagnostica Stago, Parsippany, New Jersey), urinalysis (Roche U411 Analyzer, Roche Diagnostics, Indianapolis, Indiana), and urine protein:creatinine ratio performed at the North Carolina State University Clinical Pathology laboratory.
2.6. Hemostatic laboratory tests
After a standardized 30‐minute rest period after venipuncture at room temperature, optical platelet aggregometry (Chrono‐log 700 Aggregometer, Chrono‐log Corp, Havertown, Pennsylvania) and TEG (TEG500 Hemostasis Analyzer, Haemonetics Corp, Braintree, Massachusetts) were performed on different aliquots of citrated whole blood. One aliquot was centrifuged at 650 × g for 3 minutes at room temperature to yield platelet‐rich plasma (PRP) and packed red blood cells. After a 30‐minute equilibration period, 500 μL of the PRP was added to a glass cuvette containing a magnetic stir bar. The sample was warmed to 37°C and stirred at 1200 rpm. Extent of platelet aggregation (%) in response to adenosine diphosphate (ADP) and collagen were recorded using an optical aggregometer.
Recalcified, kaolin‐activated TEG was performed on a different aliquot of the citrated whole blood as previously described. 22 Briefly, 1 mL of citrated whole blood was added to a vial of kaolin and mixed gently. Then, 340 μL of this mixed sample was added to a standardized TEG pin‐and‐cup that was prewarmed to 37°C and contained 20 μL of calcium chloride. Samples were randomized to 1 of 4 different channels on 3 TEG machines, performed by the same technician, and run for a standard 90‐minute period. The TEG variables related to rate of clot formation (R time [min], K time [min], alpha angle [degrees]); clot strength (MA [mm], G [kdynes/s]); and clot lysis (LY30 [%]) were recorded. Hypercoagulability was defined as a TEG G value above the upper limit of the institutional reference interval (>8.9 kdynes/s). Reference intervals were derived from a population of 48 normal dogs. These dogs were owned by students, staff, or faculty at North Carolina State University. Each dog was deemed healthy based on physical examination findings and baseline laboratory testing (CBC, serum biochemistry, urinalysis), and coagulation profile consisting of prothrombin time (PT), activated partial thromboplastin time (aPTT), fibrinogen, and D‐dimers. These dogs were not receiving any medications other than routine heartworm preventative and flea and tick control and were all current on routine vaccinations. Breeds consisted of mixed breed dogs (n = 21), Labrador Retriever (n = 5), American Staffordshire Terrier (n = 3), Border Collie (n = 3), Australian Cattledog (n = 2), French Bulldog (n = 2), Golden Retriever (n = 2), Great Dane (n = 2), and 1 each of 8 additional breeds. The sex distribution of this population was 22/48 (46%) spayed females and 26/48 (54%) castrated males. Median body weight was 21.2 kg (range, 7‐59.5 kg). Ages ranged from 11 months to 10.5 years, with a median age of 4.0 years. Sample collection, processing, and analysis of samples strictly followed the aforementioned technique used for the dogs with SARDS and their controls. Histograms and box and whisker plots were generated, and the data were determined to be normally distributed. The reference interval for each TEG parameter was defined as the mean ± 2 SD.
The remaining citrated whole blood was centrifuged at 4000 × g for 15 minutes at room temperature to yield platelet‐poor plasma (PPP). The PPP was harvested and frozen at −80°C for later batch analysis of the remaining hemostatic variables (antithrombin activity [AT], fibrinogen, thrombin antithrombin complexes [TAT], and D‐dimers) at the Comparative Coagulation Laboratory at Cornell University. These remaining tests all were performed within 12 months of collection and storage. The frozen PPP samples were thawed at 37°C immediately before being assayed. First, AT was measured using a functional assay configured to measure thrombin inhibition (anti‐IIa assay) using a commercial chromogenic kit (Anti‐II assay kit—Stachrom ATIII, Diagnostica Stago, Parsippany, New Jersey) and the manufacturer's automated analyzer (Analyzer—STA Compact, Diagnostica Stago, Parsippany, New Jersey). Fibrinogen was measured in a functional assay (Clauss fibrinogen) with a human thrombin reagent (Diagnostica Stago, Parsippany, New Jersey) and mechanical endpoint detection. Aliquots of pooled plasma (prepared from 20 healthy adult dogs) were used as assay standards for AT and fibrinogen determinations. The pooled plasma standard had an assigned AT value of 100%, and the fibrinogen content of the standard was measured using a gravimetric method. 23 The D‐dimer concentration was measured using a quantitative, immunoturbidimetric method as previously described using a commercial kit (HemosIL, D‐dimer, Instrumentation Laboratory, Bedford, Massachusetts) with the manufacturer's human D‐dimer standard. Plasma thrombin‐antithrombin (TAT) complex concentration was measured using a commercial sandwich enzyme immunoassay (Enzygnost TAT Micro, Dade Behring, Marburg, Germany). The assay was configured with rabbit anti‐human thrombin and antithrombin antibodies, and a human TAT standard.
2.7. Statistical analysis
Statistical analysis was performed using R version 4.0.2 and GraphPad Prism version 9.1.1 for Mac OS. Thromboelastography, aggregometry, and physiological variables were examined individually for the effect of SARDS status, age, and sex on the value via multiple linear regression. This approach was taken in an unpaired manner because of a lack of conventional dependence between matched dogs. Models then were reduced via backward selection using the Akaike information criteria (AIC) with a requirement to always include SARDS status in the final model. Where SARDS status alone was left in the model, the P value was equivalent to that which was generated by the Student's t test. Because of concerns of unequal variance, anywhere that SARDS status was the only variable remaining; Welch's t test was used to account for the potential for unequal variance. Correlation analysis between TEG‐G and fibrinogen concentration was performed using simple linear regression.
Significance for a priori hypotheses was set at P < .05 with power of 80%. A priori power analysis was performed in G*Power 3.1 using a t test for a difference between 2 independent means (because pilot study dogs were not case‐control matched).
Significance for post hoc tests was determined based on a Bonferroni‐adjusted cutoff to maintain a 5% false discovery rate within that set of variables (e.g., within aggregometry). P value cutoffs are presented in Table S1. Factors included in the statistical analysis and relevant to hemostasis included: TEG (MA, G, angle, K, R), platelet aggregometry (amplitude, slope, lag, and area under the curve of collagen and ADP), coagulation testing (fibrinogen, AT, D‐dimer, and TAT), CBC (hematocrit, platelet count, PCV, plasma total protein concentration, and segmented neutrophil count), and serum biochemistry (albumin concentration and globulin concentration). Graphs present an indication of the median value and interquartile range.
3. RESULTS
3.1. TEG pilot study
A summary of demographic and clinicopathological results for the 12 dogs with a history of SARDS that were evaluated for TEG in the pilot study is presented in Table 1. Median dog age was 10.9 years (range, 7.0‐15.0 years). Breeds of dog included Dachshund (n = 5), Miniature Schnauzer (n = 3), mixed breed (n = 3), and 1 Jack Russell terrier. Dogs were sampled at a median of 3.7 months (range, 0.2‐36.2 months) after ERG‐confirmed diagnosis of SARDS. Of the 12 dogs evaluated, 9/12 were hypercoagulable based on an increased TEG G value (median, 13.23 kdynes/s; range, 8.1‐18.2 kdynes/s; reference interval [RI], 4.0‐8.9 kdynes/s). Of the smaller number of dogs that underwent more comprehensive hemostatic testing, 2/3 had hyperfibrinogenemia, both of which also had increased TEG G value (Table 1). Of the 5 dogs that underwent CBC testing, 4/5 had normal platelet counts, and mild thrombocytopenia was detected in 1 dog, which was verified by review of a blood smear (Table 1).
TABLE 1.
TEG pilot study: Dogs with a history of SARDS that underwent pilot testing with TEG.
| Variable | Units | Reference interval | Median (range) | N/total outside of reference range (n above ref. range) |
|---|---|---|---|---|
| Age (n = 12) | y | NA | 10.9 (7‐15) | NA |
| Time since SARDS diagnosis (n = 12) | mo | NA | 3.7 (0.2‐36.2) | NA |
| Hematocrit (n = 5) | % | 39.2‐55.9 | 51.4 (41.3‐54.7) | 0/5 |
| Plasma total protein (n = 4) | g/dL | 5.9‐7.3 | 7.0 (6.9‐7.1) | 0/4 |
| White blood cell count (n = 5) | ×103/μL | 4.39‐11.6 | 4.95 (4.7‐8.1) | 0/5 |
| Platelet count (n = 5) | ×103/μL | 190‐468 | 346 (183‐467) | 1/5 (0 above) |
| Prothrombin time (n = 3) | s | 8.4‐9.7 | 9.4 (9‐9.7) | 0/3 |
| Activated partial thromboplastin time (n = 3) | s | 10.5‐15.1 | 13.6 (12.9‐16.2) | 1/3 (1 above) |
| D‐dimers (n = 3) | ng/dL | <135 | <135 (<135‐141) | 1/3 (1 above) |
| Fibrinogen (n = 3) | mg/dL | 108‐210 | 338 (174‐390) | 2/3 (2 above) |
| TEG R (n = 12) | min | 2‐5 | 3.6 (0.2‐6.2) | 5/12 (4 above) |
| TEG K (n = 12) | min | 1‐3 | 1.1 (0.8‐1.6) | 4/12 (0 above) |
| TEG angle (n = 12) | degrees | 58‐75 | 75.2 (64.1‐87.0) | 6/12 (6 above) |
| TEG MA (n = 12) | mm | 47‐65 | 71.4 (61.8‐78.4) | 9/12 (9 above) |
| TEG G value (n = 12) | kdynes/s | 4‐8.9 | 12.7 (8.1‐18.2) | 9/12 (9 above) |
| TEG Ly30 (n = 12) | % | 0‐8 | 0.0 (0‐0.5) | 0/12 |
Abbreviations: MA, maximum amplitude; NA, not applicable; SARDS, sudden acquired retinal degeneration syndrome; TEG, thromboelastography.
3.2. Prospective case‐control study
In total, 7 dogs with SARDS were enrolled over an 8‐month period. Median dog age was 9.8 years (range, 6.7‐12.4 years) and median body weight was 9.2 kg (range, 6.9‐34.1 kg). Sex distribution included 4/7 castrated males and 3/7 spayed females. Dogs with SARDS consisted of 4 pure breed dogs (Miniature Schnauzer [2], Beagle [1], and Rough Collie [1]) and 3 mixed breed dogs. The control population was matched as closely as possible. One dog (Beagle) was excluded from the control population after recruitment as because it was diagnosed with an intestinal foreign body within 6 hours of participating in the study. An additional Beagle subsequently was recruited to replace this dog. Control dogs consisted of 4 castrated males and 3 spayed females. The control population was comprised of the same 4 pure dog breeds as dogs with SARDS and 3 mixed‐breed dogs. The median age of the control dogs was 9.5 years (range, 6.1‐12.1 years) and median body weight was 8.8 kg (range, 7.9‐26.4 kg).
Dogs with SARDS had had an acute deterioration of vision at a median of 21 days (range, 9‐39 days) before blood collection. Electroretinograms collected before enrollment did not have measurable a‐ or b‐waves at bright flash intensity in any dog with SARDS, in contrast to a mean bright flash (10 cds/m2) b‐wave amplitude of 255.5 ± 62 μV in matched controls. Chromatic PLR testing was consistent with SARDS in all affected animals, reflecting an absent or severely diminished red‐light PLR with a present blue light PLR. Most dogs had nuclear sclerosis evident on clinical examination (7/7 SARDS and 6/7 controls); other clinically unimportant ophthalmic examination findings included conjunctival hyperemia, mucoid ocular discharge or both (3/7 SARDS and 1/7 controls), and punctate or incipient cataract (1/7 SARDS and 1/7 controls). One dog with SARDS previously had undergone enucleation OD because of trauma, before the onset of SARDS. Fundus examination in control dogs was unremarkable apart from mild peripheral tapetal mottling visible bilaterally in 1 dog. Fundus examination in dogs with SARDS was mostly unremarkable, but 3 dogs had evidence of mild vascular attenuation and mild diffuse tapetal hyper‐reflectivity and 1 of these dogs had a focal area of tapetal hyper‐reflectivity visible in 1 eye.
The CBC variables in the dogs with SARDS and controls are shown in Figure 1A‐D and Table 2. No significant difference was found in hematocrit between dogs with SARDS and healthy controls (Figure 1A, Table 2). Two dogs with SARDS had hematocrits below the reference interval. Platelet count was not significantly different between groups, but 2 dogs with SARDS had mild thrombocytosis (Figure 1B, Table 2). Plasma protein concentration was not significantly different between groups, but 4/5 samples from dogs with SARDS had increased plasma protein concentrations (Figure 2C, Table 2). Two plasma samples from dogs with SARDS did not have plasma protein concentration evaluated because of lipemia. Three dogs with SARDS had evidence of mature neutrophilia; the remainder of dogs with SARDS had mature neutrophil counts within the reference interval (Figure 2D, Table 2), and these results did not reach the P value cutoff for this portion of the analysis.
FIGURE 1.
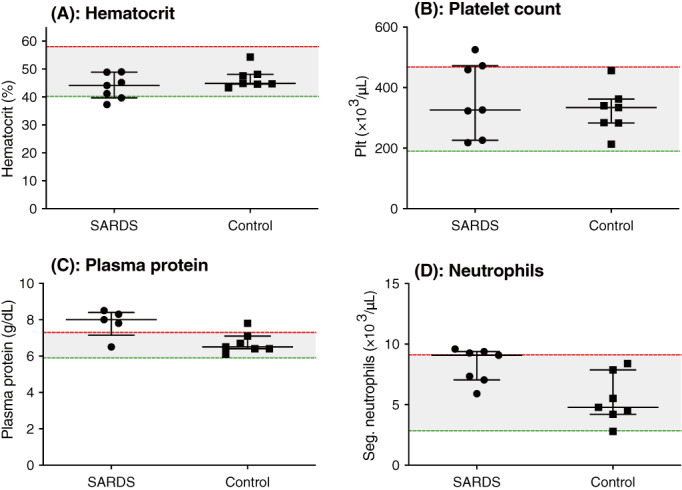
Case‐control complete blood count. Scatterplots of (A) hematocrit (%), (B) platelet count (Plt) (×103/μL), (C) plasma protein concentration (g/dL) and (D) segmented neutrophil count (Seg) (×103/μL) in dogs with sudden acquired retinal degeneration syndrome (SARDS) compared to controls. No measurements met the P value cutoff for significance. Median and interquartile range are shown, with the shaded area representing the reference range of measurements.
TABLE 2.
Prospective case‐control study: Serum biochemistry and CBC variables included in statistical analysis with statistical cutoff values and P values.
| Variable | Units | Reference interval | SARDS | Controls | P value |
|---|---|---|---|---|---|
| HCT | % | 40.2‐61.2 | 44.1 (37.3‐49.0) | 44.9 (43.3‐54.3) | .11 |
| PCV | % | 39‐58 | 44 (35‐49) | 44 (42‐52) | .25 |
| Platelet count | ×103/μL | 190‐468 | 326 (218‐525) | 334 (213‐456) | .49 |
| Segmented neutrophil count | ×103/μL | 2.841‐9.112 | 9.086 (5.908‐9.599) | 4.784 (2.791‐8.393) | .01 |
| Plasma total protein | g/dL | 5.3‐7.2 | 6.8 (5.7‐7.3) | 6.1 (5.3‐6.7) | .03 |
| Serum albumin | g/dL | 3.2‐4.3 | 3.9 (3.5‐4.2) | 3.8 (3.3‐4.2) | .16 |
| Serum globulins | g/dL | 1.8‐3.4 | 2.9 (2.2‐3.1) | 2.4 (2.0‐2.6) | .01 |
Note: Adjusted P value cutoffs are presented in Table S1.
Abbreviations: HCT, hematocrit; SARDS, sudden acquired retinal degeneration syndrome.
FIGURE 2.
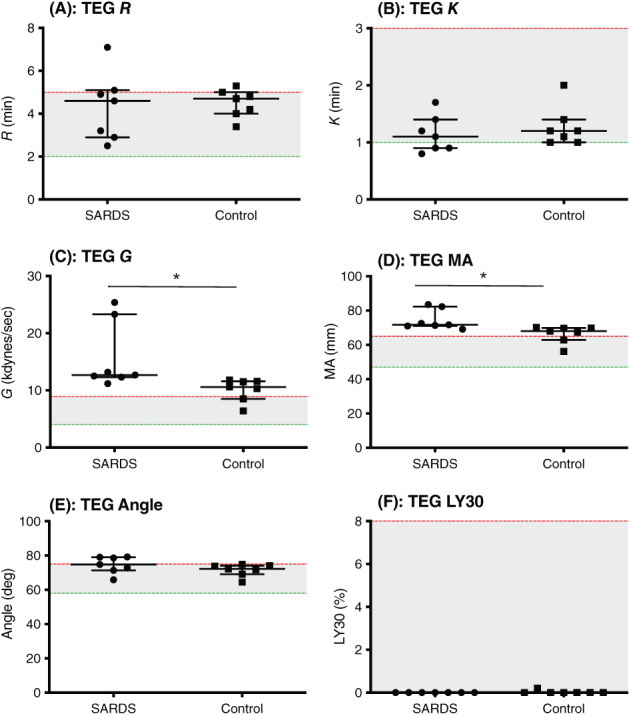
Case‐control thromboelastography (TEG). Scatterplots of (A) R time (R) (minutes), (B) K time (K) (minutes), (C) alpha angle (degrees), (D) maximum amplitude (MA) (mm), (E) elastic shear modulus (G) (kdynes/s), (F) % lysis at 30 minutes (LY30) (%) in dogs with sudden acquired retinal degeneration syndrome (SARDS) compared to controls. *P < .05. Median and interquartile range are shown, with the shaded area representing the reference range of measurements.
Two measurements from serum biochemistry were included in the statistical analysis. Neither serum albumin nor globulin concentration (Table 2) met the P value cutoff for this portion of the analysis. Additional urine and blood sample variables not included in the statistical analysis are presented in Supplementary File 1.
Comparison of TEG variables between the 2 groups is presented in Figure 2A‐F and Table 3. There was no significant difference in TEG variables, R time (Figure 2A, Table 3; 2/7 SARDS and 1/7 controls had values above the reference interval) or K time (Figure 2B, Table 3; 1/7 SARDS had a value below the reference interval). All dogs with SARDS and 5/7 healthy control dogs were hypercoagulable based on increased TEG G value. Dogs with SARDS had significantly higher TEG G values compared to normal dogs (Figure 2C, Table 3) as well as significantly higher MA values compared to controls (Figure 2D, Table 3; 7/7 SARDS and 5/7 controls had values above the reference interval). No significant differences were found between dogs with SARDS and controls for the variables alpha angle (Figure 2E, Table 3), or LY30 (Figure 2F, Table 3).
TABLE 3.
Prospective case‐control study: TEG and coagulation testing values included in statistical analysis with statistical cutoff values and P values.
| Variable | Units | Reference interval | SARDS | Controls | P value |
|---|---|---|---|---|---|
| R time | min | 2‐5 | 4.6 (2.5‐7.1) | 4.7 (3.4‐5.3) | .81 |
| K time | min | 1‐3 | 1.1 (0.8‐1.7) | 1.2 (1‐2) | .49 |
| G | kdynes/s | 4.0‐8.9 | 12.7 (11.2‐25.4) | 10.6 (6.4‐11.8) | .04 |
| Maximum amplitude | mm | 47‐65 | 71.7 (69.1‐83.5) | 68 (56.2‐70.2) | .02 |
| Angle | degrees | 58‐75 | 74.8 (65.9‐79.2) | 72.2 (64.5‐74.9) | .22 |
| Ly30 | % | 0‐8 | 0 (0‐0) | 0 (0‐0.2) | NP |
| AT | % | 65‐145 | .99 | ||
| Fibrinogen | mg/dL | 150‐490 | 463 (391‐680) | 297 (166‐393) | .001 |
| D‐dimer | mg/mL | 0‐575 | 387 (62‐658) | 292 (79‐826) | .85 |
| TAT | μg/L | 6.8‐10.2 | 14.1 (2.4‐154.9) | 8.9 (2.9‐133.5) | .81 |
Note: Adjusted P value cutoffs are presented in Table S1.
Abbreviations: AT, antithrombin; SARDS, sudden acquired retinal degeneration syndrome; TAT, thrombin‐antithrombin; TEG, thromboelastography.
The remaining hemostatic biomarkers, AT, fibrinogen, D‐dimers, and TAT are presented in Figure 3A‐D and Table 3. No significant difference was found in AT (Figure 3A, Table 3) between dogs with SARDS and healthy controls. A mild increase in AT above the reference interval was identified in 1 dog with SARDS and 1 healthy control. Dogs with SARDS had significantly higher plasma concentrations of fibrinogen compared to normal dogs (Figure 3B, Table 3). Two dogs with SARDS but no control dogs were hyperfibrinogenemic. No significant difference in plasma concentration of D‐dimers (Figure 3C, Table 3) was found between dogs with SARDS and healthy controls. One dog with SARDS and 2 control dogs had mildly increased D‐dimers. No significant difference in TAT was found between the dogs with SARDS and healthy controls (Figure 3D, Table 3). Thrombin‐antithrombin activity was increased in 5/7 dogs with SARDS and 3/7 control dogs. Strong positive correlations were found between TEG‐G and fibrinogen concentration (simple linear regression, R 2 = 0.49; P = .01; Figure 3E) and TEG‐MA and fibrinogen concentration (simple linear regression, R 2 = 0.43; P = .01; Figure 3F). No significant association was found between age and fibrinogen concentration (simple linear regression, R 2 = 0.05; P = .46; Figure 3G).
FIGURE 3.
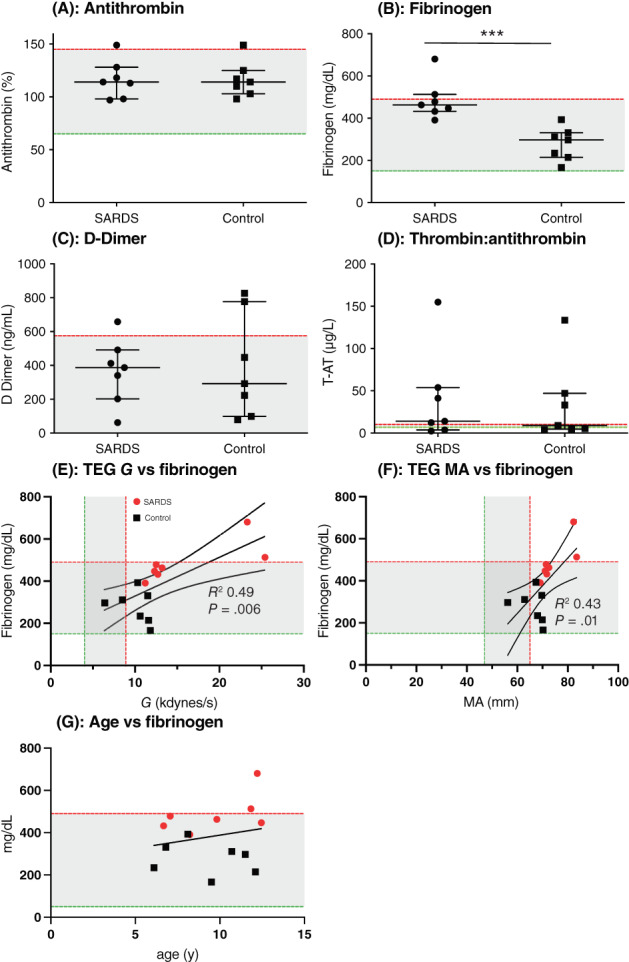
Case‐control coagulation testing. Scatterplots of (A) antithrombin (AT) activity (%), (B) fibrinogen (mg/dL) (×103/μL), (C) D‐dimers (ng/dL), and (D) thrombin‐antithrombin (TAT) complex (%) in dogs with sudden acquired retinal degeneration syndrome (SARDS) compared to controls. (E) Simple linear regression plot with 95% confidence intervals of thromboelastography (TEG)‐G and fibrinogen concentration illustrating the significant positive association. (F) Simple linear regression plot with 95% confidence intervals of TEG‐maximum amplitude (MA) and fibrinogen concentration illustrating the significant positive association. (G) Simple linear regression plot of age and Fibrinogen concentration. ***P < .0001. Median and interquartile range are shown, with the shaded area representing the reference range of measurements.
No significant differences in optical platelet aggregometry variables, performed using ADP or collagen were found between either group of dogs. Data are summarized in Table 4.
TABLE 4.
Prospective case‐control study: Comparison of optical platelet aggregometry variables measured in dogs with SARDS compared to healthy controls.
| Platelet agonist | Variable | SARDS | Controls | P value |
|---|---|---|---|---|
| ADP | Amplitude (%) | 62 (8‐103) | 45 (13‐72) | .42 |
| Slope | 75 (40‐134) | 79 (39‐88) | .26 | |
| Lag (s) | 50 (42‐65) | 52 (40‐62) | .68 | |
| AUC | 240.7 (3.2‐459.3) | 151.9 (30.9‐310.5) | .53 | |
| Collagen | Amplitude (%) | 60 (1‐71) | 7 (1‐79) | .04 |
| Slope | 66 (18‐132) | 18 (11‐116) | .1 | |
| Lag (s) | 128 (16‐360) | 316 (8‐360) | .31 | |
| AUC | 85.4 (0‐208.9) | 7.5 (0‐202.5) | .22 |
Note: Adjusted P value cutoffs are presented in Table S1.
Abbreviations: ADP, adenosine diphosphate; AUC, area under the curve; SARDS, sudden acquired retinal degeneration syndrome.
4. DISCUSSION
We identified several dogs with SARDS that had evidence of systemic hypercoagulability. A pilot study identified hypercoagulability on TEG in 9 of 12 dogs with SARDS. Furthermore, systemic hypercoagulability was common in the prospective case‐control study of dogs recently diagnosed with SARDS, based on indicators of increased clot strength on TEG (MA and G) and increased plasma fibrinogen concentrations. Interestingly, matched controls also frequently had increased indicators of clot strength on TEG tracings, although dogs with SARDS were significantly more hypercoagulable. Based on this information, hemostatic laboratory tests were not a useful discriminatory marker between SARDS and controls, but could provide new insight into the pathologic basis of the disease.
The pathogenesis of SARDS in dogs is incompletely understood and diagnosis before the onset of vision loss is difficult. Early biomarkers of the disease are needed so that effective therapeutic strategies can be investigated. Dogs with SARDS also exhibit many systemic signs and laboratory abnormalities that overlap with endocrinopathies. 8 , 9 , 10 , 11 , 12 Dogs with SARDS might be more likely to have kidney, respiratory and pancreatic disorders around the time of their death compared to a general reference population, but clinical studies are needed to verify this observation. 8 Hypercoagulability is known to be a feature of several systemic disorders in dogs, including HC, 15 , 16 protein‐losing nephropathy, 18 , 19 and pancreatitis. 20 Many of these conditions overlap with systemic abnormalities seen in dogs with SARDS, but the prevalence of hypercoagulability in SARDS has not been investigated specifically.
Focal or multifocal retinal detachments frequently are identified in dogs with SARDS. 9 , 24 , 25 This finding is also commonly found in a cause of acute painless vision disturbance in humans, central serous chorioretinopathy (CSCR). 26 , 27 , 28 Hypercortisolism is common in people with CSCR. 29 , 30 , 31 , 32 , 33 Patients with CSCR have increased plasma fibrinogen concentration 34 and are at higher risk for thrombotic events. The proposed pathophysiology is that thrombosis limits choroidal perfusion, causing ischemic choroidal effusion and subsequent bullous retinal detachment. 29 Patients with CSCR are also at a higher risk of thrombotic events, including retinal vein occlusion 34 and cerebrovascular accidents. 35 Consequently, we hypothesize that intravascular thrombosis contributes to impaired choroidal circulation in dogs with SARDS associated with a systemic hypercoagulable state. Indeed, a study using fluorescein angiography in dogs with SARDS noted initial hypofluorescence, which might indicate a vascular filling defect. 24 However, the choroidal circulation is more optimally imaged using indocyanine green angiography or optical coherence tomography angiography. 36
We completed a pilot study in which TEG was performed in a group of 12 dogs with SARDS without overt signs of concurrent illness. A hypercoagulable state was identified in 9 of these dogs based on increased MA and G value. The results of this study then were used to determine an appropriate sample size for a prospective case‐control study. Interestingly, TEG evidence of systemic hypercoagulability was identified commonly in both dogs with SARDS and age‐ and breed‐matched controls. Dogs with SARDS, however, were significantly more hypercoagulable based on interpretation of TEG, MA, and G value. Several additional tests were evaluated concurrently in these dogs to better characterize their hemostatic profiles. Indicators of clot strength on TEG (ie, MA and G) are influenced by fibrinogen content, platelet number, platelet function, and hematocrit. 37 , 38 Dogs with SARDS had evidence of significantly increased plasma fibrinogen concentration compared to controls, which was positively correlated with TEG MA and G values consistent with previous publications. 38 , 39 No significant differences were found in hematocrit, platelet number, or platelet function, as assessed by optical aggregometry, between dogs with SARDS and their controls. Our data therefore suggest that the plasmatic components of hemostasis (i.e., an excess of fibrinogen) impart a hypercoagulable state in dogs with SARDS rather than the cellular components of blood. Hypercoagulability also can arise as a result of a deficiency of antithrombin, an endogenous anticoagulant, 40 but such a deficiency was not identified in dogs with SARDS or their controls.
Increased plasma fibrinogen concentrations indicate that systemic inflammation was present in both groups of dogs, but to a significantly greater extent in the SARDS group. Cross talk between inflammation and coagulation is well described, 41 , 42 such that increased fibrinogen plasma concentrations are associated with enhanced thrombosis risk. 34 , 43 , 44 It was not possible with our study design to determine whether the inflammatory response seen in dogs with SARDS was acute or chronic. Other indicators of acute inflammation, such as neutrophilic leukocytosis, were lacking in dogs with SARDS, which suggests longstanding inflammation is present in dogs by the time of vision loss. Another challenge with interpretation of fibrinogen concentration is whether documented hypercoagulable state translates into actual in vivo thrombus formation. Thrombin‐antithrombin complexes were measured as an indicator of clot turnover in our study. These form when antithrombin inhibits and complexes with surplus unbound thrombin in hypercoagulable states. 45 No significant differences in measured TAT complexes were identified between dogs with SARDS and controls, suggesting thrombin generation was not enhanced. It is also possible, however, that sample size was too small to identify differences in TAT complexes between groups in this study leading to a type II error.
We also evaluated D‐dimers as an alternative indicator of clot turnover. D‐dimers are a subtype of fibrin degradation products formed after plasmin‐mediated dissolution of fibrin clots. D‐dimers had a higher association with thrombosis in dogs than TEG parameters in a retrospective study. 46 D‐dimers were not significantly different between dogs with early SARDS and matched controls in our study, suggesting thrombogenesis and subsequent fibrinolysis were not enhanced in this population. Impaired fibrinolysis is an additional mechanism implicated in the development of hypercoagulability. Hypofibrinolysis is less well characterized in dogs compared to prothrombotic factor excess (eg, hyperfibrinogenemia) and antithrombotic deficiency (eg, antithrombin loss). A factor implicated in the prothrombotic tendency of people with CSCR is increased plasma concentrations of plasminogen activator inhibitor‐1 (PAI‐1), an endogenous inhibitor of fibrinolysis, which induces a hypofibrinolytic tendency. 47 Excess of PAI‐1 in mice also is associated with increased hunger and weight gain attributed to an increase in body fat, 48 similar to clinical findings in dogs with SARDS. Hypercoagulable TEG tracings and hyperfibrinogenemia in dogs with SARDS, without concurrent increases in D‐dimers, suggest the possible presence of hypofibrinolysis that could fit with the observations seen in CSCR. The extent of fibrinolysis on TEG was assessed in our study by evaluating LY30 and did not differ between dogs with SARDS or controls. It is important to note that no observed lysis is normal for most dogs on kaolin‐activated TEG (ie, LY30 = 0%). The addition of tissue plasminogen activator to TEG improves the sensitivity for detecting perturbations in fibrinolysis, although this approach typically is used when evaluating dogs for hyperfibrinolysis. 49 , 50 More work on the contribution of hypofibrinolysis to prothrombotic states and defining laboratory methods for evaluating fibrinolysis in dogs is warranted. 51
Our study had some limitations. We identified a biased population of dogs with SARDS that underwent coagulation testing. The number of dogs enrolled in the prospective arms of our study also was small. Although the pilot study provided data to inform an appropriate sample size for recognizing changes on TEG between groups, a larger sample size might be needed to identify meaningful differences in other hemostatic biomarkers. We also defined hypercoagulability solely based on increased clot strength on TEG, indicated by MA and G, consistent with previous publications. 39 , 52 , 53 , 54 We reported indicators of the rate of clot formation, as recommended by veterinary‐specific guidelines. 55 Changes in these variables, specifically decreased R time, decreased K time, and increased alpha angle, also have been seen in some animals with hypercoagulability, although strong activators in kaolin‐activated TEG can normalize these values. We found positive correlations between MA and fibrinogen concentration and G value and fibrinogen concentration, suggesting hypercoagulability was present in these animals driven by increased fibrinogen. Furthermore, an inherent limitation of studies evaluating hemostatic profiles in dogs with spontaneous disease is that coagulation is a dynamic process. Consequently, the snapshot view of in vivo hemostatic activity provides limited information. Despite this, we have sampled dogs with recently diagnosed and more longstanding SARDS, and consistently found changes suggestive of hypercoagulability. Also, TEG evidence of hypercoagulability was identified, albeit less severely, in matched controls in the prospective case‐control study. We intended to recruit control dogs without concurrent illnesses. Subclinical inflammation or other mild occult comorbidities plausibly could have gone undetected in a population of older dogs. Lastly, none of the dogs in any arm of our study had confirmed thrombotic complications based on diagnostic imaging or necropsy. Future studies in dogs using noninvasive choroidal vascular imaging techniques are indicated, as have been performed in humans with CSCR. 56 , 57 Hypercoagulability is just 1 contributor to thrombosis development, along with changes in blood flow and endothelial disruption, as described by Virchow's triad. The interplay of these 3 factors is complex and challenging to characterize in individual dogs.
CONFLICT OF INTEREST DECLARATION
Authors declare no conflict of interest.
OFF‐LABEL ANTIMICROBIAL DECLARATION
Authors declare no off‐label use of antimicrobials.
INSTITUTIONAL ANIMAL CARE AND USE COMMITTEE (IACUC) OR OTHER APPROVAL DECLARATION
Approved by North Carolina State University, 18‐070‐O.
HUMAN ETHICS APPROVAL DECLARATION
Authors declare human ethics approval was not needed for this study.
Supporting information
Data S1. Supporting Information.
Table S1. P value cutoffs for statistical analysis. Significance for post hoc tests was determined based on a Bonferroni adjusted cutoff to maintain a 5% false discovery rate within that set of variables. Other physiologic variables include coagulation tests, complete blood count, and serum biochemistry variables preselected as relevant to coagulation.
ACKNOWLEDGMENT
This work was supported by grants from the American College of Veterinary Ophthalmologists Vision for Animals Foundation (VAF2020‐A and VAFSARDS2015) and the National Institutes of Health (NIH) K08EY028628 (to Freya M. Mowat). The authors also acknowledge support from the North Carolina State University College of Veterinary Medicine and the North Carolina Veterinary Medical Foundation Retinal Research Fund.
Lynch AM, Ruterbories LK, Robertson JB, Lunn KF, Mowat FM. Hemostatic profiles in dogs with sudden acquired retinal degeneration syndrome. J Vet Intern Med. 2023;37(3):948‐959. doi: 10.1111/jvim.16710
REFERENCES
- 1. Stuckey JA, Pearce JW, Giuliano EA, et al. Long‐term outcome of sudden acquired retinal degeneration syndrome in dogs. J Am Vet Med Assoc. 2013;243:1425‐1431. [DOI] [PubMed] [Google Scholar]
- 2. Komaromy AM, Abrams KL, Heckenlively JR, et al. Sudden acquired retinal degeneration syndrome (SARDS) – a review and proposed strategies toward a better understanding of pathogenesis, early diagnosis, and therapy. Vet Ophthalmol. 2016;19:319‐331. [DOI] [PubMed] [Google Scholar]
- 3. Heller AR, van der Woerdt A, Gaarder JE, et al. Sudden acquired retinal degeneration in dogs: breed distribution of 495 canines. Vet Ophthalmol. 2017;20:103‐106. [DOI] [PubMed] [Google Scholar]
- 4. Mowat FM, Avelino J, Bowyer A, et al. Detection of circulating anti‐retinal antibodies in dogs with sudden acquired retinal degeneration syndrome using indirect immunofluorescence: a case‐control study. Exp Eye Res. 2020;193:107989. [DOI] [PubMed] [Google Scholar]
- 5. Braus BK, Hauck SM, Amann B, et al. Neuron‐specific enolase antibodies in patients with sudden acquired retinal degeneration syndrome. Vet Immunol Immunopathol. 2008;124:177‐183. [DOI] [PubMed] [Google Scholar]
- 6. Bellhorn RW, Murphy CJ, Thirkill CE. Anti‐retinal immunoglobulins in canine ocular diseases. Semin Vet Med Surg (Small Anim). 1988;3:28‐32. [PubMed] [Google Scholar]
- 7. Young WM, Oh A, Williams JG, et al. Clinical therapeutic efficacy of mycophenolate mofetil in the treatment of SARDS in dogs—a prospective open‐label pilot study. Vet Ophthalmol. 2018;21:565‐576. [DOI] [PubMed] [Google Scholar]
- 8. Washington DR, Li Z, Fox LC, Mowat FM. Canine sudden acquired retinal degeneration syndrome: owner perceptions on the time to vision loss, treatment outcomes, and prognosis for life. Vet Ophthalmol. 2021;24:156‐168. [DOI] [PMC free article] [PubMed] [Google Scholar]
- 9. Oh A, Foster ML, Williams JG, et al. Diagnostic utility of clinical and laboratory test parameters for differentiating between sudden acquired retinal degeneration syndrome and pituitary‐dependent hyperadrenocorticism in dogs. Vet Ophthalmol. 2019;22:842‐858. [DOI] [PubMed] [Google Scholar]
- 10. Plummer CE, Specht A, Gelatt KN. Ocular manifestations of endocrine disease. Compend Contin Educ Vet. 2007;29:733‐743. [PubMed] [Google Scholar]
- 11. Acland GM, Aguirre GD. Sudden acquired retinal degeneration: clinical signs and diagnosis. Trans Am Coll Vet Ophthalmol. 1986;17:6. [Google Scholar]
- 12. Leis ML, Lucyshyn D, Bauer BS, Grahn BH, Sandmeyer LS. Sudden acquired retinal degeneration syndrome in western Canada: 93 cases. Can Vet J. 2017;58:1195‐1199. [PMC free article] [PubMed] [Google Scholar]
- 13. Klose TC, Creevy KE, Brainard BM. Evaluation of coagulation status in dogs with naturally occurring canine hyperadrenocorticism. J Vet Emerg Crit Care (San Antonio). 2011;21:625‐632. [DOI] [PubMed] [Google Scholar]
- 14. Kol A, Nelson RW, Gosselin RC, Borjesson DL. Characterization of thrombelastography over time in dogs with hyperadrenocorticism. Vet J. 2013;197:675‐681. [DOI] [PubMed] [Google Scholar]
- 15. Pace SL, Creevy KE, Krimer PM, Brainard BM. Assessment of coagulation and potential biochemical markers for hypercoagulability in canine hyperadrenocorticism. J Vet Intern Med. 2013;27:1113‐1120. [DOI] [PubMed] [Google Scholar]
- 16. Park FM, Blois SL, Abrams‐Ogg AC, et al. Hypercoagulability and ACTH‐dependent hyperadrenocorticism in dogs. J Vet Intern Med. 2013;27:1136‐1142. [DOI] [PubMed] [Google Scholar]
- 17. Rose L, Dunn ME, Bedard C. Effect of canine hyperadrenocorticism on coagulation parameters. J Vet Intern Med. 2013;27:207‐211. [DOI] [PubMed] [Google Scholar]
- 18. Lennon EM, Hanel RM, Walker JM, Vaden SL. Hypercoagulability in dogs with protein‐losing nephropathy as assessed by thromboelastography. J Vet Intern Med. 2013;27:462‐468. [DOI] [PubMed] [Google Scholar]
- 19. White CR, Langston C, Hohenhaus AE, Lamb K, Hackner S, Fox PR. Evaluation of the relationship between clinical variables and thromboelastographic findings in dogs with protein‐losing nephropathy. J Vet Emerg Crit Care (San Antonio). 2016;26:74‐79. [DOI] [PubMed] [Google Scholar]
- 20. Nielsen L, Holm J, Rozanski E, Meola D, Price LL, Laforcade A. Multicenter investigation of hemostatic dysfunction in 15 dogs with acute pancreatitis. J Vet Emerg Crit Care (San Antonio). 2019;29:264‐268. [DOI] [PubMed] [Google Scholar]
- 21. Ekesten B, Komaromy AM, Ofri R, et al. Guidelines for clinical electroretinography in the dog: 2012 update. Doc Ophthalmol. 2013;127:79‐87. [DOI] [PubMed] [Google Scholar]
- 22. Bucknoff MC, Hanel RM, Marks SL, Motsinger‐Reif AA, Suter SE. Evaluation of thromboelastography for prediction of clinical bleeding in thrombocytopenic dogs after total body irradiation and hematopoietic cell transplantation. Am J Vet Res. 2014;75:425‐432. [DOI] [PubMed] [Google Scholar]
- 23. Whitton CM, Sands D, Hubbard AR, Gaffney PJ. A collaborative study to establish the 2nd International Standard for Fibrinogen, Plasma. Thromb Haemost. 2000;84:258‐262. [PubMed] [Google Scholar]
- 24. Osinchuk SC, Leis ML, Salpeter EM, Sandmeyer LS, Grahn BH. Evaluation of retinal morphology of canine sudden acquired retinal degeneration syndrome using optical coherence tomography and fluorescein angiography. Vet Ophthalmol. 2019;22:398‐406. [DOI] [PubMed] [Google Scholar]
- 25. Grozdanic SD, Lazic T, Kecova H, Mohan K, Kuehn MH. Optical coherence tomography and molecular analysis of sudden acquired retinal degeneration syndrome (SARDS) eyes suggests the immune‐mediated nature of retinal damage. Vet Ophthalmol. 2019;22:305‐327. [DOI] [PMC free article] [PubMed] [Google Scholar]
- 26. Kang HG, Woo SJ, Lee JY, et al. Pathogenic risk factors and associated outcomes in the bullous variant of central serous chorioretinopathy. Ophthalmol Retina. 2022;6:939‐948. [DOI] [PubMed] [Google Scholar]
- 27. Mohabati D, van Rijssen TJ, van Dijk EH, et al. Clinical characteristics and long‐term visual outcome of severe phenotypes of chronic central serous chorioretinopathy. Clin Ophthalmol. 2018;12:1061‐1070. [DOI] [PMC free article] [PubMed] [Google Scholar]
- 28. Prünte C, Flammer J. Choroidal capillary and venous congestion in central serous chorioretinopathy. Am J Ophthalmol. 1996;121:26‐34. [DOI] [PubMed] [Google Scholar]
- 29. Wang M, Munch IC, Hasler PW, Prünte C, Larsen M. Central serous chorioretinopathy. Acta Ophthalmol. 2008;86:126‐145. [DOI] [PubMed] [Google Scholar]
- 30. van Haalen FM, van Dijk EHC, Dekkers OM, et al. Cushing's syndrome and hypothalamic‐pituitary‐adrenal axis hyperactivity in chronic central serous chorioretinopathy. Front Endocrinol (Lausanne). 2018;9:39. [DOI] [PMC free article] [PubMed] [Google Scholar]
- 31. Soares RR, Samuelson A, Chiang A. Association of chronic central serous chorioretinopathy with subclinical Cushing's syndrome. Am J Ophthalmol Case Rep. 2022;26:101455. [DOI] [PMC free article] [PubMed] [Google Scholar]
- 32. Brinks J, van Haalen FM, van Rijssen TJ, et al. Central serous chorioretinopathy in active endogenous Cushing's syndrome. Sci Rep. 2021;11:2748. [DOI] [PMC free article] [PubMed] [Google Scholar]
- 33. Haimovici R, Rumelt S, Melby J. Endocrine abnormalities in patients with central serous chorioretinopathy. Ophthalmology. 2003;110:698‐703. [DOI] [PubMed] [Google Scholar]
- 34. Limon U, Bozkurt E, Bulut S, et al. Elevated serum fibrinogen/albumin ratios in patients with acute central serous chorioretinopathy. Eur J Ophthalmol. 2022;32:1735‐1742. [DOI] [PubMed] [Google Scholar]
- 35. Tsai DC, Huang CC, Chen SJ, et al. Central serous chorioretinopathy and risk of ischaemic stroke: a population‐based cohort study. Br J Ophthalmol. 2012;96:1484‐1488. [DOI] [PubMed] [Google Scholar]
- 36. Teussink MM, Breukink MB, van Grinsven MJ, et al. OCT angiography compared to fluorescein and indocyanine green angiography in chronic central serous chorioretinopathy. Invest Ophthalmol Vis Sci. 2015;56:5229‐5237. [DOI] [PubMed] [Google Scholar]
- 37. Smith SA, McMichael MA, Gilor S, et al. Correlation of hematocrit, platelet concentration, and plasma coagulation factors with results of thromboelastometry in canine whole blood samples. Am J Vet Res. 2012;73:789‐798. [DOI] [PubMed] [Google Scholar]
- 38. Lynch AM, Ruterbories L, Jack J, Motsinger‐Reif AA, Hanel R. The influence of packed cell volume versus plasma proteins on thromboelastographic variables in canine blood. J Vet Emerg Crit Care (San Antonio). 2020;30:418‐425. [DOI] [PubMed] [Google Scholar]
- 39. Fry W, Lester C, Etedali NM, Shaw S, DeLaforcade A, Webster CRL. Thromboelastography in dogs with chronic hepatopathies. J Vet Intern Med. 2017;31:419‐426. [DOI] [PMC free article] [PubMed] [Google Scholar]
- 40. Kuzi S, Segev G, Haruvi E, Aroch I. Plasma antithrombin activity as a diagnostic and prognostic indicator in dogs: a retrospective study of 149 dogs. J Vet Intern Med. 2010;24:587‐596. [DOI] [PubMed] [Google Scholar]
- 41. Levi M, van der Poll T. Inflammation and coagulation. Crit Care Med. 2010;38:S26‐S34. [DOI] [PubMed] [Google Scholar]
- 42. Petaja J. Inflammation and coagulation. An overview. Thromb Res. 2011;127(Suppl 2):S34‐S37. [DOI] [PubMed] [Google Scholar]
- 43. van Hylckama VA, Rosendaal FR. High levels of fibrinogen are associated with the risk of deep venous thrombosis mainly in the elderly. J Thromb Haemost. 2003;1:2677‐2678. [DOI] [PubMed] [Google Scholar]
- 44. Devreese KMJ. COVID‐19‐related laboratory coagulation findings. Int J Lab Hematol. 2021;43(Suppl 1):36‐42. [DOI] [PMC free article] [PubMed] [Google Scholar]
- 45. Rimpo K, Tanaka A, Ukai M, Ishikawa Y, Hirabayashi M, Shoyama T. Thrombin‐antithrombin complex measurement using a point‐of‐care testing device for diagnosis of disseminated intravascular coagulation in dogs. PLoS One. 2018;13:e0205511. [DOI] [PMC free article] [PubMed] [Google Scholar]
- 46. Thawley VJ, Sanchez MD, Drobatz KJ, et al. Retrospective comparison of thromboelastography results to postmortem evidence of thrombosis in critically ill dogs: 39 cases (2005‐2010). J Vet Emerg Crit Care (San Antonio). 2016;26:428‐436. [DOI] [PubMed] [Google Scholar]
- 47. Iijima H, Iida T, Murayama K, Imai M, Gohdo T. Plasminogen activator inhibitor 1 in central serous chorioretinopathy. Am J Ophthalmol. 1999;127:477‐478. [DOI] [PubMed] [Google Scholar]
- 48. Kenny S, Gamble J, Lyons S, et al. Gastric expression of plasminogen activator inhibitor (PAI)‐1 is associated with hyperphagia and obesity in mice. Endocrinology. 2013;154:718‐726. [DOI] [PMC free article] [PubMed] [Google Scholar]
- 49. Spodsberg EH, Wiinberg B, Jessen LR, Marschner CB, Kristensen AT. Endogenous fibrinolytic potential in tissue‐plasminogen activator‐modified thromboelastography analysis is significantly decreased in dogs suffering from diseases predisposing to thrombosis. Vet Clin Pathol. 2013;42:281‐290. [DOI] [PubMed] [Google Scholar]
- 50. Fletcher DJ, Rozanski EA, Brainard BM, de Laforcade AM, Brooks MB. Assessment of the relationships among coagulopathy, hyperfibrinolysis, plasma lactate, and protein C in dogs with spontaneous hemoperitoneum. J Vet Emerg Crit Care (San Antonio). 2016;26:41‐51. [DOI] [PubMed] [Google Scholar]
- 51. Jeffery U, Brooks MB, LeVine DN. Development of a fibrinolysis assay for canine plasma. Vet J. 2017;229:19‐25. [DOI] [PubMed] [Google Scholar]
- 52. Respess M, O'Toole TE, Taeymans O, et al. Portal vein thrombosis in 33 dogs: 1998‐2011. J Vet Intern Med. 2012;26:230‐237. [DOI] [PubMed] [Google Scholar]
- 53. Kelley D, Lester C, DeLaforcade A, Webster CRL. Thromboelastographic evaluation of dogs with congenital portosystemic shunts. J Vet Intern Med. 2013;27:1262‐1267. [DOI] [PubMed] [Google Scholar]
- 54. McPhetridge JB, Lynch AM, Webster CRL, et al. Pre‐operative hemostatic status in dogs undergoing splenectomy for splenic masses. Front Vet Sci. 2022;9:686225. [DOI] [PMC free article] [PubMed] [Google Scholar]
- 55. Hanel RM, Chan DL, Conner B, et al. Systematic evaluation of evidence on veterinary viscoelastic testing part 4: definitions and data reporting. J Vet Emerg Crit Care (San Antonio). 2014;24:47‐56. [DOI] [PubMed] [Google Scholar]
- 56. Nicholson B, Noble J, Forooghian F, Meyerle C. Central serous chorioretinopathy: update on pathophysiology and treatment. Surv Ophthalmol. 2013;58:103‐126. [DOI] [PMC free article] [PubMed] [Google Scholar]
- 57. van Rijssen TJ, van Dijk EHC, Dijkman G, Boon CJF. Clinical characteristics of chronic central serous chorioretinopathy patients with insufficient response to reduced‐settings photodynamic therapy. Graefes Arch Clin Exp Ophthalmol. 2018;256:1395‐1402. [DOI] [PMC free article] [PubMed] [Google Scholar]
Associated Data
This section collects any data citations, data availability statements, or supplementary materials included in this article.
Supplementary Materials
Data S1. Supporting Information.
Table S1. P value cutoffs for statistical analysis. Significance for post hoc tests was determined based on a Bonferroni adjusted cutoff to maintain a 5% false discovery rate within that set of variables. Other physiologic variables include coagulation tests, complete blood count, and serum biochemistry variables preselected as relevant to coagulation.