

Abstract
Many studies have demonstrated the impairment of sustained attention due to total sleep deprivation (TSD). However, it remains unclear whether and how TSD affects the processing of visual selective attention. In the current study, 24 volunteers performed a visual search task before and after TSD over a period of 36 h while undergoing spontaneous electroencephalography. Paired-sample t-tests of behavioral performance revealed that, compared with baseline values, the participants showed lower accuracy and higher variance in response time in visual search tasks performed after TSD. Analysis of the event-related potentials (ERPs) showed that the mean amplitude of the N2-posterior-contralateral (N2pc) difference wave after TSD was less negative than that at baseline and the mean amplitude of P3 after TSD was more positive than that at baseline. Our findings suggest that TSD significantly attenuates attentional direction/orientation processing and triggers a compensatory effect in the parietal brain to partially offset the impairments. These findings provide new evidence and improve our understanding of the effects of sleep loss.
Keywords: Sleep deprivation, Selective attention, Event-related potentials, N1, N2pc, P3
Introduction
In the current digital age, smart devices have changed entertainment styles and work schedules to an unprecedented level. As a result, an increasing number of people experience shortened sleep, which has been shown to increase the risk of cardiovascular disease (St-Onge & Zuraikat, 2019). Workers in several professional fields are highly affected by shortened sleep, which puts them at higher risk when working. For instance, shortened sleep is an important cause of industrial and transport-related accidents (Philip & Akerstedt, 2006). Therefore, to reduce the harm caused by shortened sleep, it is essential to ascertain how it impairs cognitive function. Total sleep deprivation (TSD)—a comprehensive representation of the status of shortened sleep—is a common metric used to thoroughly examine how shortened sleep affects cognition (Lowe et al., 2017). Experimental studies on TSD have provided a large amount of information regarding the effects of shortened sleep on neurocognitive functions.
There is increasing evidence of TSD-induced damage to attention performance. Posner and Rafal (1987) proposed that attention can be divided into three categories: alertness, selective attention, and sustained attention. Most previous studies on TSD-induced alterations in attention have focused on sustained attention or vigilance, which is often measured as vigilant attention using the psychomotor vigilance task (PVT, see review: Lim and Dinges 2008). Numerous recent studies have also drawn the conclusion that TSD reduces PVT performance, which is accompanied by longer reaction time and decreased composite scores of speed and accuracy (Cai et al. 2021; Gibbings et al. 2020; Mao et al. 2021; McMahon et al. 2018; Qi et al. 2021a; Shenfield et al. 2020; Yamazaki et al. 2021). Surprisingly, only a few studies have explored whether shortened sleep, especially TSD, affects selective attention or elucidated the underlying mechanism of this process. According to an integrated study (Burke et al. 2015), sleep inertia strongly modulates visual selective attention. Various other studies have reported weakened selective attention upon sleep restriction and circadian misalignment (e.g. Sprecher et al. 2019; Pomplun et al. 2012). Poh et al. (2016) carried out a visual search task experiment and revealed that sleep-deprived participants performed significantly worse than well-rested participants, with lower task accuracy, indicating that TSD impairs visual selective attention. However, the underlying mechanism of the effect of TSD on visual selective attention remains unclear. Therefore, we designed the present study to fill this knowledge gap.
Numerous studies have shown that there is a compensatory mechanism that offsets the deterioration induced by TSD. Drummond et al. (2000) first discovered that this effect is located in the prefrontal cortex and parietal lobes during verbal learning processing. The follow-up studies support the notion that compensatory adaptation can enable the partial recovery of working memory performance (Chen et al. 2018; Deantoni et al. 2021; Li et al. 2016; Muto et al. 2012; Yoo et al. 2007; Zhu et al. 2016). Evidence from EEG studies also indicate the existence of compensatory neural activity. For example, the small-world property significantly increases under TSD conditions, indicating a possible compensatory activity of the human brain (Liu et al. 2014; Song et al. 2022) found that the amplitude of P3 components in the parietal brain regions increased significantly during visual working memory updating processes, suggesting that TSD triggers compensatory neural activity in the parietal brain. However, it remains unclear whether TSD induces a compensatory effect in lower-order cognitive functions, as opposed to higher-order cognitive functions (such as working memory). In the present study, we aimed to answer this question.
Because of its outstanding temporal resolution, EEG—and especially the event-related potentials (ERPs) technique—is often utilized to clarify which sub-stages of a cognitive function are altered by TSD (Gumenyuk et al. 2011; Zerouali et al. 2010). Among the approved ERP components evoked by an event, the N1, the N2-posterior-contralateral (N2pc), and the P3 components were considered suitable for the current study to assess the time course of visual selective attention. The extensive literature on attention, sleep, and insomnia suggests that ERPs efficiently observe the time course of visual selective attention. The lateral occipital N1 component occurs at approximately 150 ms after stimulus onset and is generally considered to reflect early visual processing when discrimination is completed within the focus of attention (Coull 1998; Vogel and Luck 2000; Hopf et al. 2002; Luck and Kappenman 2012; Wiggins et al. 2018) employed a dichotic listening paradigm to measure the TSD-induced changes in auditory selective attention and found that following TSD, the participants exhibited a decreased amplitude of the N1 component, suggesting that TSD attenuates auditory selective attention. Further, Turcotte et al. (2009) indicated that the sleep quality was related to the N1 in individuals with chronic psychophysiological insomnia. Yang and Lo (2007) suggested that higher auditory N1 was associated with enhanced information processing in patients with primary insomnia. The N2pc component, which occurs at 200–300 ms after stimulus onset, is related to implicit selective attention processing, which determines whether attention has been directed/oriented to a given target (Luck, 2012). Gossard et al. (2019) conducted a partial sleep deprivation experiment and found that covert attentional shifting, with the N2pc as the indicator, remained intact during sleep loss. Wienke et al. (2021) studied the relationship between mind-wandering and local sleep. They showed that visual selective attention was enhanced during mind wandering, with the N2pc amplitude being directly linked to behavioral performance. The parietal P3 component that occurs 300 ms after stimulus onset is often used as an electrophysiological marker of the downstream context updating process (Donchin, 1981; Donchin and Coles 1988; Verleger 1988). This is accompanied by a series of processes to ensure accurate execution, such as cognitive control (Polich 2007). Muller-Gass & Campbell (2019) revealed that TSD moderates neural processes associated with passive auditory capture, indexed by P3 components. Choudhary et al. (2016) showed that partial sleep deprivation might disrupt physiological attention and reaction time by impairing P3 components. In summary, the N1, N2pc, and P3 components efficiently observed the time course of visual selective attention after TSD.
According to the classification proposed by Posner and Rafal (1987), selective attention facilitates specific information processing for special treatment and simultaneously tuning out other available signals. The visual search paradigm is widely used to measure visual selective attention processing (e.g., Matusz et al. 2019; Su et al. 2020; Turoman et al. 2021). In the current study, we employed a visual search task with simultaneous EEG recordings to explore whether TSD alters selective attention processes. We hypothesized the following: (i) TSD damages early visual processing (discrimination), and this would be reflected by the decreased amplitude of the N1 component; (ii) TSD impairs attentional direction/orientation processing, which would be indicated by the weakened N2pc component; (iii) TSD triggers compensatory neural activity during the context updating process, which would be represented by an enhanced P3 component.
Methods
Participants
We enrolled 24 healthy university students in Beijing as participants in the study. All participants were young male volunteers (age: 22.91 ± 2.26 years) who were right-handed and had normal or corrected vision and no history of neurological or mental disorders. The participants were instructed to ensure adequate sleep (7–9 h daily) and maintain healthy sleep habits (Pittsburgh Sleep Quality Index score < 5; Buysse et al. 1989) for half a month before the beginning of the TSD experiment. All participants declared that they did not have a habit of smoking cigarettes or of drinking alcohol or coffee, and that they had not taken any medications within 48 h before the experiment. Each participant signed an informed consent form, and the study design was approved by the Ethics Committee of Beihang University.
Experimental Tasks
The stimulus sequence for the visual search task is illustrated in Fig. 1. The design of the visual search task has been described in previous studies (Sun et al. 2018; Wang et al. 2016). A circular search array was composed of 12 items (1.7° × 1.7°; 50% contrast; 13.5 cd/m2)—including 11 diamonds and one circle (target)—on a black background. The target was randomly located at either 2/4 o’clock (right) or 8/10 o’clock (left) with equal probability. All participants were instructed to maintain their attention on the screen, respond to the position (upper or lower) of the target, and ignore other extraneous items. The odd-numbered participants pressed the F key with their left hand for the upper stimulus and the J key with their right hand for the lower stimulus, whereas the even-numbered participants followed these rules in the reverse combination. Each trial started with a fixation cross displayed for 900–1100 ms randomly, followed by the stimulus array displayed for 200 ms and a blank screen displayed for 2300 ms. Participants responded during the blank screen interval. The experiment consisted of two 120-trial blocks and lasted approximately 10 min. Between the two blocks, the participants were allowed to rest for 1 min. All participants completed the task using the same computer.
Fig. 1.

Sequence of the visual search task. The target was randomly located at either 2/4 o’clock or 8/10 o’clock with equal probability. All participants were instructed to maintain their attention on the screen, respond to the target’s position (upper or lower), and ignore other extraneous items. The participants pressed the F key with their left hand for the upper/lower stimulus and the J key with their right hand for the lower/upper stimulus
Experimental Procedures
The experimental procedure is illustrated in Fig. 2. Two participants performed the experiment simultaneously. The participants arrived at the laboratory on the day before the experiment and slept there overnight to ensure adequate sleep for more than 8 h. Before commencing the experiment, each participant was trained on 20 trials of the visual search task to ensure that they had understood the requirements of the task. The following day, the participants completed the visual search task with simultaneous EEG recordings (baseline recording) at 8:00 a.m. During the sleep deprivation period, participants were offered refreshments and allowed to play games and watch movies. After 36 h of TSD, they completed the same task with simultaneous EEG recordings (TSD recording). The participants were prohibited from taking any drugs or stimulating agents during the experimental procedures. At least two paramedics accompanied and observed the participants and reminded them to remain awake throughout the TSD period. We measured two indicators for manipulation checks of TSD before and after the 36 h TSD period. The Stanford Sleepiness Scale (SSS, Hoddes et al., 1972), a seven-point scale of equal intervals varying from very alert (1) to excessively sleepy (7) quantified subjective sleepiness, whereas the PVT quantified objective attention performance. Participants were asked to respond when a red dot with a 0.8 mm diameter appeared on the screen. At the end of each response, participants received feedback on their response times, and the task lasted 5 min. Participants completed the SSS and the PVT before each visual search task.
Fig. 2.

Timelines of the total sleep deprivation experiments. EEG, electroencephalography
Behavioral Data Analysis
Behavioral performance measures during the visual search task—including accuracy, response time (RT), and variance in response time (RTSD)—were recorded under both baseline and TSD conditions. The accuracy is the rate of correct responses that meet the time criteria in all trials. RTSD is an effective supplement to RT, indicating the stability of RT in all correct trials. A larger RTSD means more variability and less stability. RTSD was calculated as the standard deviation of RT across all trials. Incorrect responses, lack of response, and responses with a RT of < 200 ms or > 2000 ms were considered error responses and excluded. Following trial exclusion, the number of TSD trails (213.09 ± 17.25) was significantly smaller than the normal sleep condition trails (223.43 ± 12.62), with t22 = 3.61, p = 0.001, and Cohen’s d = 0.68. One participant’s behavioral performance was poorly negative (accuracy = 14.58%), therefore, his data were excluded from the analysis. Descriptive statistics are presented as the mean ± standard deviation. To test the study hypotheses, we used a one-tailed paired-sample t-test to evaluate the accuracy, RT, and RTSD. The estimates of effect size were reported as Cohen’s d indices. All analyses were performed using SPSS Statistics for Windows (version 22.0; IBM Corp., Armonk, NY, USA).
EEG Recordings and Preprocessing
While participants performed each visual search task, continuous EEG was recorded using a SynAmps2 amplifier (Compumedics Neuroscan, Victoria, Australia). An elastic cap with 30 electrodes was mounted according to the standard positions of the 10–20 system. The impedance of each electrode was reduced and maintained at below 5 kΩ. The online sampling rate was 1000 Hz, and the online reference was the average of the bilateral mastoids. The vertical eye movements were monitored with two electrodes placed 10 mm above and below the left eye, and horizontal eye movements were monitored with two electrodes placed on the bilateral temples.
The raw EEG data were preprocessed offline using the EEGLAB2020_0 toolbox (Delorme and Makeig 2004) in MATLAB R2017a (The MathWorks, Inc., Natick, MA, United States, https://www.mathworks.com/products/matlab.html). The offline sampling rate was reduced to 250 Hz, and the average reference was used as a reference. A band-pass filter of 0.1–30 Hz was used through a 6th order Butterworth filter (frequency slope = 36 dB/oct) in the ERPLAB plugin (https://github.com/lucklab/erplab; Lopez-Calderon and Luck 2014). Following independent component analysis, the components representing eye movement and inordinate muscle activity were identified and removed using the ICLabel plugin (https://github.com/sccn/ICLabel; Pion-Tonachini et al. 2019). Epochs with a length of 700 ms (range: -200–500 ms with respect to the onset of the stimuli) were extracted from the continuous EEG data to determine the ERPs. The baseline correction was performed by subtracting the mean activity during the − 200 to 0 period from each time point along with the segmented data. The trials with voltage exceeding ± 100 µV in any channel were excluded from grand average ERPs. According to Luck (2005), the signal-to-noise ratios of ERPs under the two sleep conditions were comparable. Therefore, the difference in signal-to-noise ratio caused by the difference in the number of included trials between the two sleep conditions did not affect the stability of our study results.
ERPs Data Analysis
The characteristics of the ERP components were extracted using the ERPLAB plugin (https://github.com/lucklab/erplab; Lopez-Calderon and Luck 2014). The analysis of the N1 component collapsed across O1 and O2 electrodes, given that no interaction with electrode location was identified for early visual processing components. The amplitude of the N1 component was measured from 100 ms to 200 ms with respect to the onset of the stimuli. The P7 and P8 electrodes were used to calculate the N2pc components. These two electrodes were located in the posterior brain, where the N2 component was too intermingled with other components to be extracted. Therefore, we calculated the N2pc difference wave to eliminate any interference by irrelevant ERP components. The difference wave was calculated using the following formula: N2pc difference = (mean [P8-P7]left stimulus + mean [P7-P8]right stimulus)/2 (Luck, 2012). The amplitude of the N2pc difference wave was measured for the period of 200–300 ms after the onset of the stimuli. The Pz electrode represented the P3 component for which the time window was from 300 ms to 450 ms. To improve the signal-to-noise ratio of ERP characteristics, we calculated the mean amplitude of all ERP components instead of the peak amplitude. Consistent with the behavioral data analysis, we used a one-tailed paired-sample t-test to evaluate the peak amplitude and peak latency of the ERPs. The estimates of effect size were reported as Cohen’s d indices. All analyses were performed using the SPSS software.
Results
Manipulation checks
The statistical analysis showed that the SSS score after TSD (4.48 ± 1.41) was greater than that at baseline (2.04 ± 0.82), with t22 = 7.48, p < 0.001, and Cohen’s d = 2.11. The RT of PVT after TSD (339.78 ± 48.00 ms) was longer than that at baseline (310.64 ± 29.60 ms), with t22 = 3.25, p = 0.002, and Cohen’s d = 0.73. The higher levels of sleepiness measured with the SSS and the lower performance in the PVT indicated that the manipulation of TSD in the current study was effective.
Behavioral results
Accuracy
As shown in Fig. 3 A, sleep conditions significantly affected accuracy (t22=-3.61, p = 0.001, Cohen’s d=-0.69). The results indicated that accuracy was lower after TSD (0.89 ± 0.07) than at baseline (0.93 ± 0.05).
Fig. 3.

Behavioral results for accuracy (A), response time (B), and variance in response time (C) in visual search tasks under two sleep conditions. RT, response time; RTSD, variance in response time; BS, at baseline; SD, after total sleep deprivation; *,p < 0.05; ***, p < 0.001
RT
As shown in Fig. 3B, RT was not significantly different between sleep conditions (t22 = 1.02, p = 0.160, Cohen’s d = 0.18), indicating that the RT after TSD (510.22 ± 79.54 ms) was statistically comparable to that at baseline (495.96 ± 82.20 ms).
RTSD
As shown in Fig. 3 C, sleep conditions significantly affected RTSD (t22 = 2.51, p = 0.010, Cohen’s d = 0.61). The results suggested that the RTSD values after TSD (135.42 ± 51.38 ms) were higher than those at baseline (108.91 ± 33.76 ms), indicating that the RT between trials was less consistent under TSD.
ERPs results
The ERP waves are displayed in Figs. 4, 5 and 6. Topographic maps corresponding to the ERP components are also shown.
Fig. 4.

Grand average of the N1 component (100–200 ms) induced by the target stimulus of the visual search task under two sleep conditions. The average of the O1 and O2 electrodes was used to represent the N1 component. The mean amplitude of the N1 component was more negative after total sleep deprivation than that at baseline. The topographic distribution represented in colored topographic maps was averaged across all time points in the time window. BS, at baseline; SD, after total sleep deprivation
Fig. 5.

Grand average of the N2pc difference wave (200–350 ms) induced by the target stimulus of the visual search task under two sleep conditions. The P7 and P8 electrodes were used to calculate the N2pc difference wave. The mean amplitude of the N2pc difference wave after total sleep deprivation was less negative than that at baseline. The topographic distribution represented in colored topographic maps was averaged across all time points in the time window. BS, at baseline; SD, after total sleep deprivation
Fig. 6.

Grand average of the P3 component (300–450 ms) induced by the target stimulus of the visual search task under two sleep conditions. The Pz electrode was used to represent the P3 component. The mean amplitude of the P3 components after total sleep deprivation was more positive than that at baseline. The topographic distribution represented in colored topographic maps was averaged across all time points in the time window. BS, at baseline; SD, after total sleep deprivation
N1
As shown in Fig. 4, sleep conditions significantly affected the mean amplitude of the N1 component (t22=-2.33, p = 0.015, Cohen’s d=-0.36), which was more negative after TSD (-0.45 ± 2.5 µV) compared to that at baseline (0.47 ± 2.65 µV).
N2pc difference wave
As shown in Fig. 5, sleep conditions significantly affected the mean amplitude of the N2pc difference wave (t22 = 2.28, p = 0.016, Cohen’s d = 0.36). The results indicated that the mean amplitude of the N2pc difference wave after TSD (-2.01 ± 1.64 µV) was less negative than that at baseline (-2.71 ± 2.24 µV).
P3
As shown in Fig. 6, sleep conditions significantly affected the mean amplitude of the P3 components (t22 = 1.96, p = 0.031, Cohen’s d = 0.39). The results indicated that the mean amplitude of the P3 components after TSD (2.63 ± 3.1 µV) was more positive than that at baseline (1.36 ± 3.33 µV).
Correlation analysis
Furthermore, we employed Pearson correlation analyses to address the relationship between the change in various ERP characteristics and change in behavioral performance under two sleep conditions (see Table 1). Only the variation in accuracy (Δaccuracy) was correlated with the variation in the mean amplitude of the N2pc difference wave (ΔN2pc), r = 0.46, p = 0.029, suggesting that a larger variation in accuracy affected by TSD corresponds to a larger variation in the mean amplitude of the N2pc difference wave (Fig. 7). Finally, we employed Pearson correlation analysis to address the relationship between the change in various ERP characteristics under two sleep conditions (see Table 1). There was no significant correlation among ΔN1, ΔN2pc, and ΔP3, indicating that the TSD independently affected cognitive processes: early visual processing (discrimination), attentional direction/orientation, and context updating process.
Table 1.
The Pearson correlation coefficient (r) between the change in ERP characteristics and the change in behavioral performance or the change in ERP characteristics under two sleep conditions
| ∆N1 | ∆N2pc | ∆P3 | |
|---|---|---|---|
| ∆accuracy | 0.05 | 0.46* | -0.07 |
| ∆RT | -0.12 | 0 | 0.09 |
| ∆RTSD | -0.18 | -0.14 | 0.02 |
| ∆N1 | - | - | - |
| ∆N2pc | 0.15 | - | - |
| ∆P3 | 0.07 | 0.02 | - |
Note, the calculation of the difference (∆) is the corresponding index after total sleep deprivation minus the index at baseline. RT, response time; RTSD, variance in response time; *, p < 0.05
Fig. 7.
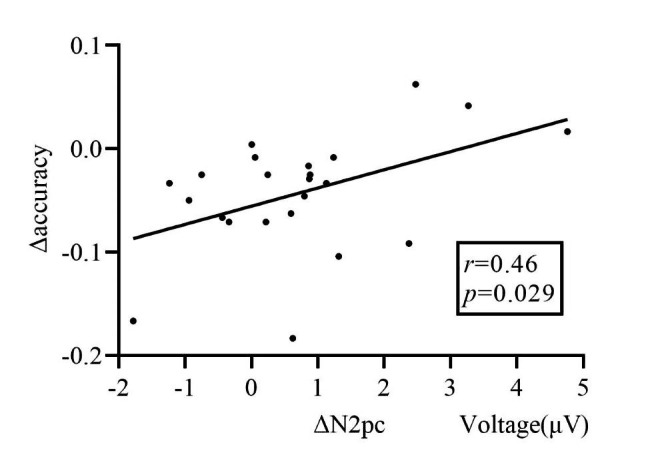
The correlation between the variation in accuracy (Δaccuracy) and in the mean amplitude of the N2pc difference wave (ΔN2pc) indicates that a larger Δaccuracy affected by total sleep deprivation corresponds to a larger ΔN2pc
Discussion
In the current study, participants performed a visual search task while undergoing spontaneous EEG under two sleep conditions: before and after TSD. Our findings expand the scope of research on TSD-induced alterations in attention. The most important finding was the selective changes in selective attention following TSD. Our results confirmed the aforementioned hypotheses as follows: TSD impaired attentional direction/orientation, as indicated by the weakened amplitude of the N2pc difference wave; and TSD triggered compensatory neural activity during the context updating process, as represented by the increased amplitude of the P3 component.
TSD decreased the accuracy and increased the RTSD, suggesting that participants completed the visual search task less accurately and with less stability after TSD. These behavioral results echoed those of Poh et al. (2016) study. They found that following TSD, participants performed visual search task with lower accuracy, which showed visual selective attention deficit. Moreover, a cross-modal study based on a dichotic-listening paradigm found that TSD attenuated auditory selective attention (Wiggins et al. 2018). Our current study suggested visual selective attention was also impaired by TSD. Additionally, as discussed in the Introduction, selective attention and sustained attention are different categories of attention (Posner & Rafal, 1987), and numerous studies have shown that TSD impairs the latter (Cai et al. 2021; Gibbings et al. 2020; Lim and Dinges 2008; Mao et al. 2021; McMahon et al. 2018; Qi et al. 2021a; Shenfield et al. 2020; Yamazaki et al. 2021), the behavioral results of our study also corresponded with those of previous studies on sustained attention to some extent. To our knowledge, the current study is the first to bring to light the underlying mechanism of the detrimental effects of TSD on visual selective attention.
The increased amplitude of the N1 component showed that stimulus could evoke stronger activity in early visual processing (discrimination) after TSD, which contrasts our hypothesis. Training effect is a reasonable interpretation of the increased N1 component after TSD. Vogel and Luck (2000) showed that the peak amplitude of N1 was equally large for easy and difficult discrimination, indicating that this processing was not based on top-down factors such as cognitive resources. In summary, the evidence to date indicates that the N1 component is an obligatory, exogenous sensory response (Luck and Kappenman 2012). Therefore, TSD-induced attention divergence may not change the amplitude of the N1 component. Previous studies focusing on training effects in visual search revealed that increased amplitude of the N1 component is one of the learning-related changes (Clark et al., 2015; Hamamé et al., 2011). Hence, we speculated that the increased amplitude of the N1 component was due to training on a visual search task.
Following discrimination, attentional direction/orientation processing was also damaged by TSD. This result was different from that reported by Gossard et al. (2019) and showed that a greater degree of sleep loss, TSD, affected attentional direction/orientation processing, consistent with our hypothesis. The mean amplitude of the N2pc difference wave was weakened by TSD, which could be attributable to the decreased degree of brain activity during this sub-stage. It may be responsible for the divergence of attention following TSD. The significant correlation between Δaccuracy and ΔN2pc supports the explanation that the decreased brain activity is associated with the impaired behavioral performance of visual search task.
However, we could not determine the source of this decrease in brain activity within the time window of N2pc, which could be caused by a defect in the N2pc component. The N2pc component is a mixture of multiple components, including P2, N2, and P3 in the posterior brain (Luck, 2012). Therefore, it is difficult to clarify which specific component(s) weakened the mean amplitude of the N2pc difference wave. Regardless of this defect, the N2pc component is a sensitive neural signature of the attentional direction/orientation in visual selective attention processes (Luck and Kappenman 2012). According to the previous source analysis, the topography of the N2pc component is consistent with a generator source in area V4 and the lateral occipital complex (Hopf et al. 2000, 2006), which is in line with the topography in Fig. 4. In addition, various other studies found that TSD-induced impairments of central executive functions were accompanied by diminished frontal lobe activity (see review: Krause et al. 2017). The study showed that although attentional processes are closely related to central executive functions, the mechanism of damaged visual selective attention following TSD may be different from that of higher-level central executive functions. Further studies using complicated paradigms to integrate more cognitive processes in a single paradigm are needed to explore the relationship between impaired attentional processes and impaired central executive functions at the level of brain mechanisms.
The changes in the P3 component indicated the existence of compensatory neural activity in the parietal brain which allowed the completion of the processing following attentional direction/orientation. The larger mean amplitude of the P3 component reflected stronger activity triggered by TSD. The Pearson correlation analysis showed that this alteration was not correlated with alterations during former sub-stages, indicating that this alteration was independent of the other two alterations. We reasoned that the increased P3 amplitude provided evidence of a compensatory effect from the perspective of top-down cognitive control. Drummond et al. (2000) first reported this compensatory adaptation using a verbal learning task. Since then, several studies have shown that this compensatory effect can enable the partial recovery of damaged cognitive functions, such as working memory (Chen et al. 2018; Li et al. 2016; Muto et al. 2012; Song et al. 2022; Yoo et al. 2007; Zhu et al. 2016) and spatial navigation learning (Deantoni et al. 2021). The current study suggests that TSD also induces a compensatory effect during visual selective attention. The parietal P3 component is thought to represent the downstream stage of context-updating processes (Donchin et al., 1981; Donchin and Coles 1988; Verleger 1988). Polich et al. (2007) suggested that the allocation of attentional resources is associated with P3 components. In this stage, a series of higher-order processes (e.g., cognitive control and response execution) need to be operated accurately. After TSD, the participants were so distracted that their cognitive resources were insufficient to conduct these higher-order processes; therefore, they had to pay attention to combating sleepiness and completing cognitive tasks by extra top-down cognitive control processing.
The compensatory neural activity would offset the TSD-induced dysfunction partially rather than completely. In other words, top-down cognitive control is an extra strategy to reduce damages to a certain extent. There are two explanations regarding why the behavioral performance (accuracy, RTSD) would not be significantly affected due to this compensation. First, in all mechanisms underlying the TSD-induced deficits in visual selective attention, impairment was predominant, and compensation was secondary. Thus, although a compensatory effect existed in a sub-stage, the impairments of the entire visual selective attention processing would not be completely offset. Moreover, Δaccuracy was only correlated with ΔN2pc and not ΔP3, which supports this notion. Second, EEG/ERP, but not behavioral performance, is more sensitive to specific effects on a certain sub-stage of visual selective attention. Therefore, we reason that TSD triggers a compensatory effect in the parietal brain to offset the impairments partially.
This study has some limitations that need to be considered. First, all the participants were young adult males, which influences the generalizability of the findings. Future studies should include a broader variety of participants and account for other demographic characteristics, including sex and age. Second, the number of electrodes used was insufficient, and high-density EEG would be more effective for acquiring the brain activation signals and tracing the source of the TSD-induced alterations. Third, selective attention is always accompanied by more complicated disturbances in real life; for example, different types of stimuli or colors can easily distract the participant. The current study aimed to explore how TSD influences the most basic selective attention processes, and the types of stimuli should be further considered in future research. Finally, partial sleep deprivation is more common than TSD and reflects more typical experiences of shortened sleep in everyday life; therefore, its chronic effects should be investigated in future studies.
We employed a visual search task before and after TSD to provide electrophysiological evidence and reveal the core mechanisms of the TSD-induced selective attention impairments. Behavioral performance was impaired by TSD, and this impairment was reflected by the decreased accuracy and increased RTSD in the visual search task. The ERP results clarified the time course of these alterations: TSD attenuates attentional direction/orientation processing, and triggers compensatory neural activity during the context updating process. Taken together, our findings provide new evidence for alterations in attention caused by shortened sleep.
Footnotes
Publisher’s Note
Springer Nature remains neutral with regard to jurisdictional claims in published maps and institutional affiliations.
Contributor Information
Yongcong Shao, Email: budeshao@bsu.edu.cn.
Yi Wang, Email: 520520520lulu@163.com.
Shijun Li, Email: shijunli07@yeah.net.
References
- Burke TM, Scheer FA, Ronda JM, Czeisler CA, Wright KP., Jr Sleep inertia, sleep homeostatic and circadian influences on higher-order cognitive functions. J Sleep Res. 2015;24(4):364–371. doi: 10.1111/jsr.12291. [DOI] [PMC free article] [PubMed] [Google Scholar]
- Buysse DJ, Reynolds CF, III., Monk TH, Berman SR, Kupfer DJ. The Pittsburgh sleep quality index: a new instrument for psychiatric practice and research. Psychiatry Res. 1989;28(2):193–213. doi: 10.1016/0165-1781(89)90047-4. [DOI] [PubMed] [Google Scholar]
- Cai Y, Mai Z, Li M, Zhou X, Ma N. Altered frontal connectivity after sleep deprivation predicts sustained attentional impairment: A resting-state functional magnetic resonance imaging study. J Sleep Res. 2021;30(5):e13329. doi: 10.1111/jsr.13329. [DOI] [PubMed] [Google Scholar]
- Chen W, Chen J, Lin X, Li P, Shi L, Liu J, Sun H, Lu L, Shi J. Dissociable effects of sleep deprivation on functional connectivity in the dorsal and ventral default mode networks. Sleep Med. 2018;50:137–144. doi: 10.1016/j.sleep.2018.05.040. [DOI] [PubMed] [Google Scholar]
- Clark K, Appelbaum LG, van den Berg B, Mitroff SR, Woldorff MG. Improvement in visual search with practice: mapping learning-related changes in neurocognitive stages of processing. J Neurosci. 2015;35(13):5351–5359. doi: 10.1523/JNEUROSCI.1152-14.2015. [DOI] [PMC free article] [PubMed] [Google Scholar]
- Coull JT. Neural correlates of attention and arousal: insights from electrophysiology, functional neuroimaging and psychopharmacology. Prog Neurobiol. 1998;55(4):343–361. doi: 10.1016/S0301-0082(98)00011-2. [DOI] [PubMed] [Google Scholar]
- Deantoni M, Villemonteix T, Balteau E, Schmidt C, Peigneux P (2021) Post-training sleep modulates topographical relearning-dependent resting state activity. Brain Sci 11(4). 10.3390/brainsci11040476 [DOI] [PMC free article] [PubMed]
- Delorme A, Makeig S. EEGLAB: an open source toolbox for analysis of single-trial EEG dynamics including independent component analysis. J Neurosci Methods. 2004;134(1):9–21. doi: 10.1016/j.jneumeth.2003.10.009. [DOI] [PubMed] [Google Scholar]
- Donchin E. Surprise!… Surprise? Psychophysiology. 1981;18(5):493–513. doi: 10.1111/j.1469-8986.1981.tb01815.x. [DOI] [PubMed] [Google Scholar]
- Donchin E, Coles M. Is the P300 component a manifestation of context updating? Behav Brain Sci. 1988;11(3):357–374. doi: 10.1017/S0140525X00058027. [DOI] [Google Scholar]
- Drummond SPA, Brown GG, Gillin JC, Stricker JL, Wong EC, Buxton RB. Altered brain response to verbal learning following sleep deprivation. Nature. 2000;403:655–657. doi: 10.1038/35001068. [DOI] [PubMed] [Google Scholar]
- Gossard TR, Westerland SM, Linn-Evans M, Timm PC, Sandness DJ, Dueffert L, Louis St. 0142 The cumulative effect of partial chronic sleep restriction on the neural processing stream in neurologically normal individuals. Sleep. 2019;42(Supplement1):A58–A59. doi: 10.1093/sleep/zsz067.141. [DOI] [Google Scholar]
- Gibbings A, Ray LB, Berberian N, Nguyen T, Zandi Shahidi A, Owen AM, Comeau FJE, Fogel SM. EEG and behavioural correlates of mild sleep deprivation and vigilance. Clin Neurophysiol. 2020;132(1):45–55. doi: 10.1016/j.clinph.2020.10.010. [DOI] [PubMed] [Google Scholar]
- Gumenyuk V, Roth T, Korzyukov O, Jefferson C, Bowyer S, Drake CL. Habitual Short Sleep Impacts Frontal Switch Mechanism in Attention to Novelty. Sleep. 2011;34(12):1659–1670. doi: 10.5665/sleep.1430. [DOI] [PMC free article] [PubMed] [Google Scholar]
- Hamamé CM, Cosmelli D, Henriquez R, Aboitiz F. Neural mechanisms of human perceptual learning: electrophysiological evidence for a two-stage process. PLoS ONE. 2011;6(4):e19221. doi: 10.1371/journal.pone.0019221. [DOI] [PMC free article] [PubMed] [Google Scholar]
- Hopf JM, Luck SJ, Boelmans K, Schoenfeld MA, Boehler CN, Rieger J, Heinze HJ. The neural site of attention matches the spatial scale of perception. J Neurosci. 2006;26(13):3532–3540. doi: 10.1523/JNEUROSCI.4510-05.2006. [DOI] [PMC free article] [PubMed] [Google Scholar]
- Hopf JM, Luck SJ, Girelli M, Hagner T, Mangun GR, Scheich H, Heinze HJ. Neural sources of focused attention in visual search. Cereb Cortex. 2000;10(12):1233–1241. doi: 10.1093/cercor/10.12.1233. [DOI] [PubMed] [Google Scholar]
- Hopf J, Vogel E, Woodman G, Heinze H, Luck SJ. Localizing visual discrimination processes in time and space. J Neurophysiol. 2002;88(4):2088–2095. doi: 10.1152/jn.2002.88.4.2088. [DOI] [PubMed] [Google Scholar]
- Krause AJ, Simon EB, Mander BA, Greer SM, Saletin JM, Goldstein-Piekarski AN, Walker MP. The sleep-deprived human brain. Nat Rev Neurosci. 2017;18(7):404–418. doi: 10.1038/nrn.2017.55. [DOI] [PMC free article] [PubMed] [Google Scholar]
- Li C, Huang D, Qi J, Chang H, Meng Q, Wang J, Liu J, Ye E, Shao Y, Zhang X. Short-term memory deficits correlate with hippocampal-thalamic functional connectivity alterations following acute sleep restriction. Brain Imaging and Behavior. 2016;11(4):954–963. doi: 10.1007/s11682-016-9570-1. [DOI] [PubMed] [Google Scholar]
- Lim J, Dinges DF. Sleep deprivation and vigilant attention. Ann N Y Acad Sci. 2008;1129:305–322. doi: 10.1196/annals.1417.002. [DOI] [PubMed] [Google Scholar]
- Liu H, Li H, Wang Y, Lei X. Enhanced brain small-worldness after sleep deprivation: a compensatory effect. J Sleep Res. 2014;23(5):554–563. doi: 10.1111/jsr.12147. [DOI] [PubMed] [Google Scholar]
- Lopez-Calderon J, Luck SJ. ERPLAB: An open-source toolbox for the analysis of event-related potentials. Front Hum Neurosci. 2014;8:213. doi: 10.3389/fnhum.2014.00213. [DOI] [PMC free article] [PubMed] [Google Scholar]
- Luck SJ. Ten simple rules for designing ERP experiments. In: Handy TC, editor. Event-related potentials: A methods handbook. Cambridge, MA: MIT Press; 2005. pp. 17–32. [Google Scholar]
- Luck SJ. Electrophysiological correlates of the focusing of attention within complex visual scenes: N2pc and related ERP components. In: Kappenman ES, Luck SJ, editors. The Oxford Handbook of Event-Related Potential Components. New York: Oxford University Press, Inc.; 2012. [Google Scholar]
- Luck SJ, Kappenman ES. ERP components and selective attention. In: Kappenman ES, Luck SJ, editors. The Oxford Handbook of Event-Related Potential Components. New York: Oxford University Press, Inc.; 2012. [Google Scholar]
- Mao T, Dinges D, Deng Y, Zhao K, Yang Z, Lei H, Fang Z, Yang FN, Galli O, Goel N, Basner M, Rao H. Impaired vigilant attention partly accounts for inhibition control deficits after total sleep deprivation and partial sleep restriction. Nat Sci Sleep. 2021;13:1545–1560. doi: 10.2147/nss.s314769. [DOI] [PMC free article] [PubMed] [Google Scholar]
- Matusz PJ, Turoman N, Tivadar RI, Retsa C, Murray MM. Brain and Cognitive Mechanisms of Top-Down Attentional Control in a Multisensory World: Benefits of Electrical Neuroimaging. J Cogn Neurosci. 2019;31(3):412–430. doi: 10.1162/jocn_a_01360. [DOI] [PubMed] [Google Scholar]
- McMahon WR, Ftouni S, Drummond SPA, Maruff P, Lockley SW, Rajaratnam SMW, Anderson C. The wake maintenance zone shows task dependent changes in cognitive function following one night without sleep. Sleep. 2018;41(10):zsy148. doi: 10.1093/sleep/zsy148. [DOI] [PubMed] [Google Scholar]
- Muller-Gass A, Campbell K. Sleep deprivation moderates neural processes associated with passive auditory capture. Brain Cogn. 2019;132:89–97. doi: 10.1016/j.bandc.2019.03.004. [DOI] [PubMed] [Google Scholar]
- Muto V, Bourdiec S-L, Matarazzo A, Foret L, Mascetti A, Jaspar L, Vandewalle M, Phillips G, Degueldre C, Balteau C, Luxen E, Collette A, Maquet P. Influence of acute sleep loss on the neural correlates of alerting, orientating and executive attention components. J Sleep Res. 2012;21:648–658. doi: 10.1111/j.1365-2869.2012.01020.x. [DOI] [PubMed] [Google Scholar]
- Pion-Tonachini L, Kreutz-Delgado K, Makeig S. ICLabel: An automated electroencephalographic independent component classifier, dataset, and website. NeuroImage. 2019;198:181–197. doi: 10.1016/j.neuroimage.2019.05.026. [DOI] [PMC free article] [PubMed] [Google Scholar]
- Poh JH, Chong PL, Chee MW. Sleepless night, restless mind: Effects of sleep deprivation on mind wandering. J Exp Psychol Gen. 2016;145(10):1312–1318. doi: 10.1037/xge0000207. [DOI] [PubMed] [Google Scholar]
- Qi J, Li B, Zhang Y, Pan B, Gao Y, Zhan H, Liu Y, Shao Y, Weng X, Zhang X. Disrupted small-world networks are associated with decreased vigilant attention after total sleep deprivation. Neuroscience. 2021;471:51–60. doi: 10.1016/j.neuroscience.2021.07.010. [DOI] [PubMed] [Google Scholar]
- Qi J, Li B, Zhang Y, Pan B, Gao Y, Zhan H, Liu Y, Shao Y, Zhang X. Altered functional connectivity between the nucleus basalis of Meynert and anterior cingulate cortex is associated with declined attentional performance after total sleep deprivation. Behav Brain Res. 2021;409:113321. doi: 10.1016/j.bbr.2021.113321. [DOI] [PubMed] [Google Scholar]
- Qi J, Li B, Zhang Y, Pan B, Gao Y, Zhan H, Liu Y, Shao Y, Zhang X. Altered insula-prefrontal functional connectivity correlates to decreased vigilant attention after total sleep deprivation. Sleep Med. 2021;84:187–194. doi: 10.1016/j.sleep.2021.05.037. [DOI] [PubMed] [Google Scholar]
- Polich J. Updating P300: An integrative theory of P3a and P3b. Clin Neurophysiol. 2007;118(10):2128–2148. doi: 10.1016/j.clinph.2007.04.019. [DOI] [PMC free article] [PubMed] [Google Scholar]
- Pomplun M, Silva EJ, Ronda JM, Cain SW, Münch MY, Czeisler CA, Duffy JF. The effects of circadian phase, time awake, and imposed sleep restriction on performing complex visual tasks: Evidence from comparative visual search. J Vis. 2012;12(7):14–14. doi: 10.1167/12.7.14. [DOI] [PMC free article] [PubMed] [Google Scholar]
- Shenfield L, Beanland V, Filtness A, Apthorp D. The impact of sleep loss on sustained and transient attention: an EEG study. Peerj. 2020;8:e8960. doi: 10.7717/peerj.8960. [DOI] [PMC free article] [PubMed] [Google Scholar]
- Song T, Yu K, Wang L, Xu L, Xu M, Peng Z, Dai C, Wang H, Yang T, Shao Y, Wang X, Lv J. Total sleep deprivation triggers greater activation in the parietal brain in the visual working memory updating processes: An event-related potentials study. Front NeuroSci. 2022;16:736437. doi: 10.3389/fnins.2022.736437. [DOI] [PMC free article] [PubMed] [Google Scholar]
- Sprecher KE, Ritchie HK, Burke TM, Depner CM, Smits AN, Dorrestein PC, Wright KP., Jr Trait-like vulnerability of higher-order cognition and ability to maintain wakefulness during combined sleep restriction and circadian misalignment. Sleep. 2019;42(8):zsz113. doi: 10.1093/sleep/zsz113. [DOI] [PMC free article] [PubMed] [Google Scholar]
- Su Y, Huang W, Yang N, Yan K, Ding Y, Qu Z. Attentional capture by a color singleton is stronger at spatially relevant than irrelevant locations: Evidence from an ERP study. Psychophysiology. 2020;57(10):e13640. doi: 10.1111/psyp.13640. [DOI] [PubMed] [Google Scholar]
- Sun M, Wang E, Huang J, Zhao C, Guo J, Li D, Sun L, Du B, Ding Y, Song Y. Attentional selection and suppression in children and adults. Dev Sci. 2018;21(6):e12684. doi: 10.1111/desc.12684. [DOI] [PubMed] [Google Scholar]
- Turcotte I, Bastien CH. Is quality of sleep related to the N1 and P2 ERPs in chronic psychophysiological insomnia sufferers? Int J Psychophysiol. 2009;72(3):314–322. doi: 10.1016/j.ijpsycho.2009.02.001. [DOI] [PubMed] [Google Scholar]
- Turoman N, Tivadar RI, Retsa C, Murray MM, Matusz PJ (2021) Towards understanding how we pay attention in naturalistic visual search settings, NeuroImage. 244:118556. 10.1016/j.neuroimage.2021.118556 [DOI] [PubMed]
- Verleger R. Event-related potentials and cognition: A critique of the context updating hypothesis and an alternative interpretation of P3. Behav Brain Sci. 1988;11(3):343–356. doi: 10.1017/S0140525X00058015. [DOI] [Google Scholar]
- Vogel E, Luck SJ. The visual N1 component as an index of a discrimination process. Psychophysiology. 2000;37(2):190–203. doi: 10.1111/1469-8986.3720190. [DOI] [PubMed] [Google Scholar]
- Wang E, Sun L, Sun M, Huang J, Tao Y, Zhao X, Wu Z, Ding Y, Newman DP, Bellgrove MA, Wang Y, Song Y. Attentional selection and suppression in children with attention-deficit/hyperactivity disorder. Biol Psychiatry: Cogn Neurosci Neuroimaging. 2016;1(4):372–380. doi: 10.1016/j.bpsc.2016.01.004. [DOI] [PubMed] [Google Scholar]
- Wienke C, Bartsch MV, Vogelgesang L, Reichert C, Hinrichs H, Heinze HJ, Dürschmid S. Mind-wandering is accompanied by both local sleep and enhanced processes of spatial attention allocation. Cereb cortex Commun. 2021;2(1):tgab001. doi: 10.1093/texcom/tgab001. [DOI] [PMC free article] [PubMed] [Google Scholar]
- Wiggins E, Mottarella M, Good K, Eggleston S, Stevens C. 24-h sleep deprivation impairs early attentional modulation of neural processing: An event-related brain potential study. Neurosci Lett. 2018;677:32–36. doi: 10.1016/j.neulet.2018.04.022. [DOI] [PubMed] [Google Scholar]
- Yamazaki EM, Antler CA, Lasek CR, Goel N. Residual, differential neurobehavioral deficits linger after multiple recovery nights following chronic sleep restriction or acute total sleep deprivation. Sleep. 2021;44(4):zsaa224. doi: 10.1093/sleep/zsaa224. [DOI] [PMC free article] [PubMed] [Google Scholar]
- Yang CM, Lo HS. ERP evidence of enhanced excitatory and reduced inhibitory processes of auditory stimuli during sleep in patients with primary insomnia. Sleep. 2007;30(5):585–592. doi: 10.1093/sleep/30.5.585. [DOI] [PubMed] [Google Scholar]
- Yoo S, Hu P, Gujar N, Jolesz F, Walker M. A deficit in the ability to form new human memories without sleep. Nat Neurosci. 2007;10(3):385–392. doi: 10.1038/nn1851. [DOI] [PubMed] [Google Scholar]
- Zerouali Y, Jemel B, Godbout R. The effects of early and late night partial sleep deprivation on automatic and selective attention: An ERP study. Brain Res. 2010;1308:87–99. doi: 10.1016/j.brainres.2009.09.090. [DOI] [PubMed] [Google Scholar]
- Zhu Y, Feng Z, Xu J, Fu C, Sun J, Yang X, Shi D, Qin W. Increased interhemispheric resting-state functional connectivity after sleep deprivation: a resting-state fMRI study. Brain Imaging and Behavior. 2016;10(3):911–919. doi: 10.1007/s11682-015-9490-5. [DOI] [PubMed] [Google Scholar]