

Abstract
Objectives
We aim to quantify shifts in hospitalisation and mortality and how those were related to the first three phases of the epidemic and individuals’ demographics and health profile among those with a positive test for SARS-CoV-2 treated at the Mexican Social Security Institute’s facilities from March 2020 to October 2021.
Design
Retrospective observational study using interrupted time series analysis to identify changes in hospitalisation rate and case fatality rate (CFR) by epidemic wave.
Setting
Data from the Mexican Institute of Social Security’s (IMSS) Online Influenza Epidemiological Surveillance System (SINOLAVE) that include all individuals that sought care at IMSS facilities all over Mexico.
Participants
All individuals included in the SINOLAVE with a positive PCR or rapid test for SARS-CoV-2.
Primary and secondary outcome measures
Monthly test positivity rates, hospitalisation rates, CFRs and prevalence of relevant comorbidities by age group.
Results
From March 2020 to October 2021, the CFR declined between 1% and 3.5%; the declines were significant for those 0–9, 20–29, 30–39, 40–49 and 70 and older. The decline was steep during the first wave and was less steep or was temporarily reversed at the beginning of the second and third waves (changes in the trend of about 0.3% and 3.8%, and between 0.7% and 3.8%, respectively, for some age groups), but then continued to the end of the analytical period. Prevalence of diabetes, hypertension and obesity among patients testing positive also declined—two for most age groups (reductions of up to 10 percentage points for diabetes, 12 percentage points for hypertension and 19 percentage points for obesity).
Conclusion
Data suggest that the decrease in COVID-19 fatality rate is at least partially explained by a change in the profile of those contracting the disease, that is, a falling proportion of individuals with comorbidities across all age groups.
Keywords: COVID-19, Health policy, PUBLIC HEALTH
STRENGTHS AND LIMITATIONS OF THIS STUDY.
The study analyses a very large data set (1.5 million) that included all individuals with a positive test for SARS-CoV-2 at the Mexican Institute of Social Security from March 2020 to October 2021, capturing three different epidemic waves.
The data comprise about 40% of all confirmed COVID-19 reported in Mexico during the time frame.
Interrupted time series analysis permits comparison of discrete time periods to examine the significance of the association of changes with different epidemic waves.
Data quality was variable and could not be verified; the comorbidity data were self-reported and could not be validated against the patients’ medical record. Administrative data were provided for analysis as it is, without control on what variables are included and how those were defined.
Introduction
By 31 October 2021, there have been 3.72 million officially reported cases of COVID-19 in Mexico, and 282 000 deaths, with three peaks in number of cases: July 2020, January 2021 and August 2021. Excess mortality estimates suggest a total of 326 000 additional deaths, a 45.1% excess.1 In keeping with the trends in other countries, these three waves of the pandemic in Mexico have had very different case mortality rates.
The burden of the pandemic in the country has been of a magnitude such that COVID-19 was the second most common cause of death in Mexico in 2020, representing 18% of all deaths.2 For 2021, preliminary estimates for January to June indicate that COVID-19 was the leading cause of mortality, representing 25% of all deaths.3
During 2020, the crude rate of excess mortality for all causes in Mexico was 340.6 per hundred thousand males and 181.6 per hundred thousand females,1 4 that is, higher for males than 29 other countries that were included in a recent analysis by Islam et al where the highest rate was 285; for females Mexico was second highest.5
Previous analysis based on data from the first wave indicated an increase in hospitalisation and risk of death for individuals with comorbidities (diabetes, hypertension and obesity), as well as for individuals living in municipalities with a high proportion of the population living in poverty.6–8
The reported number of cases peaked first during the summer of 2020 (first wave), then in winter of 2020–2021 (second wave), and then in the summer of 2021 (third wave) which reached a level higher than the two previous waves. The fourth wave during the winter of 2021–2022 set another record for daily cases. The number of daily deaths reached its highest point during the second wave.9
We examine the evolution of cases, deaths and the case fatality rate (CFR) and the evolution of vaccination and comorbidity patterns among diagnosed cases. Countries have reported declining CFRs associated with improved clinical management of severe cases as well as with vaccination. By analysing the mortality and comorbidity trends, we describe changes in the profile of the affected population during the period analysed.
This study analyses the patterns of the COVID-19 pandemic in Mexico over time, specifically the evolution of the profile of infected individuals, aiming to quantify shifts in hospitalisation and mortality and how these changes were related to the epidemic curve and individuals’ demographics and health profiles.
Methods
This is an observational retrospective study based on data collected by the Mexican Institute of Social Security (IMSS, its acronym in Spanish) of all suspected COVID-19 cases screened at its facilities from March 2020 to October 2021. While the IMSS provides health services for individuals working in the formal private sector and their relatives, during the pandemic, IMSS facilities were opened to all individuals seeking care for COVID-like symptoms. Overall, about half of individuals with COVID-like symptoms who sought care in the country attended IMSS facilities, the remainder attended other public or private facilities.
We analysed data from the Online Influenza Epidemiological Surveillance System (SINOLAVE), an electronic platform developed at the IMSS for influenza surveillance and adapted for SARS-CoV-2 surveillance in early 2020. A detailed description of the data is available elsewhere.10 The SINOLAVE platform includes all individuals for whom the IMSS provided healthcare, including IMSS beneficiaries and non-beneficiaries who also sometimes received care related to COVID-19 at IMSS healthcare facilities.
SINOLAVE includes basic sociodemographic characteristics of each individual, self-reported comorbidities, date of symptoms onset, reported symptoms, date of testing (if any), test result and outcome (never hospitalised survived, never hospitalised death, hospitalised survived, hospitalised death, admitted to intensive care unit). For this analysis, we included all individuals with a positive SARS-CoV-2 test result from either a PCR or a rapid test.
We have no way to estimate how many patients were suspected of COVID-19 but were not entered into the SINOLAVE system. For those patients for whom we have records, there are virtually no missing data regarding general demographics and signs and symptoms at presentation. Similarly, because of our ability to link to the mortality database, we believe that the data have almost no missing data on mortality. The data on comorbidities (diabetes, hypertension and obesity) have missing data for less than 0.5% of the population and thus we do not believe it is significantly affecting our estimates of the prevalence of each condition by age group/month. We have no estimate of the degree of under-reporting of comorbidities. Hospitalisation and death rates grouped by month and age group were used to characterise the pandemic. Each age group represents a 10-year interval between 0 and 80, with a ninth group of everyone older than 80. In addition, self-reported prevalence of diabetes, hypertension and obesity was also calculated by month and age group.
To categorise the distinct waves of the pandemic, we defined September 2020 as the start of the second wave and May 2021 as the start of the third wave.
Statistical analysis
The SINOLAVE data for sex, age, hospitalisation, death, diabetes, hypertension, obesity and vaccination among those with a positive PCR or rapid test, and positivity among suspected cases with PCR or rapid test result, were aggregated with listwise deletion by age group and month (March 2020 to October 2021) to describe the pattern of these variables over time.
In addition, we implemented interrupted time series analysis (ITSA) to estimate changes in levels and trends related to the three pandemic waves in the country, adjusting by average age, sex, vaccination status, comorbidities and positivity rate for each age group.
We implemented the ITSA using the generalised least squares method under the assumption of a first-order autoregressive process. We report Newey-West standard errors assuming heteroscedasticity. We also tested the serial correlation to verify this assumption using the Cumby-Huizinga general test for autocorrelation with the actest command with six lags in Stata with robust errors,11 which holds for all age groups.
We implemented the analysis using the ITSA command in Stata V.16.1.12 13
Patient and public involvement
No patients and no members of the public were involved in the research.
Results
Overall (all age groups weighted by the number of individuals), from March 2020 to September 2020, the percentage of males among individuals with COVID-19 decreased from 57% to 50% and remained around 50% up to the end of the analytical period (October 2021). It was below 50% for those 40–49, 50–59 and 60–69 and those age groups also experienced a more pronounced decrease on the share of males over the period (figure 1). The average age of those with COVID-19 decreased from 45 years in March 2020 to 35 years in July 2021, when it increased again to almost 38 years by October 2021 (see online supplemental table 1). As shown in figure 1, the share of individuals in the younger groups increased over time and this is particularly pronounced during the third peak of the pandemic in Mexico in the summer of 2021.
Figure 1.
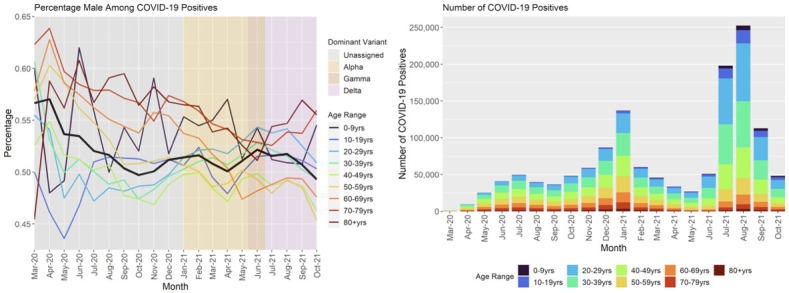
COVID-19-positive individuals treated at Mexican Institute of Social Security (IMSS): percentage of males and share by age group and month. Source: authors’ analysis of IMSS Online Influenza Epidemiological Surveillance System (SINOLAVE).
bmjopen-2022-063211supp001.pdf (289.3KB, pdf)
The positivity rate (percentage of individuals with a positive result in either a PCR or a rapid test)—excluding March 2020—ranged from a high 60% in July 2020 to a low 21% in April 2021. During the 20 months of the period of analysis, positivity was above 50% in 8 months. In all months, the rate was above the 5% that WHO14 recommends as the benchmark indicating an adequate level of testing (figure 2).
Figure 2.

COVID-19-positive individuals treated at Mexican Institute of Social Security (IMSS): (A) positivity rate, (B) hospitalisation rate and (C) case fatality rate by age group and month. Source: authors’ analysis of IMSS Online Influenza Epidemiological Surveillance System (SINOLAVE).
The positivity rate in figure 2A shows that there is a common pattern across the age groups: relatively stable from March 2020 to January 2021 followed by a rapid decrease until May 2021, a resurgence from June 2021 to September 2021 with sharply falling levels through October. Positivity also seems related to age, as older groups have higher levels across the period.
In figure 2B, the hospitalisation rate has a decreasing pattern in the analytical period, going from 49.7% of all positives in April 2020 to 9.0% in August 2021, and then increased in September 2021 to 9.8%, with the same rate in October 2021 (figure 2; online supplemental table 1).
By age group, the decline in hospitalisation rates is more pronounced for those 50 and younger, while for older individuals the rates remained relatively high until early 2021. For those 80 and older, the hospitalisation rate started at about 80% and it was about 70% by the end of the period (figure 2B).
The CFR decreased overall from 21.8% in March 2020 or 24.9% in April 2020 to 12.8% in September 2020. The overall trend then increases to a second peak in December (16.7%), which declines to its nadir in June 2021, 4.2%. Since then, rates have increased to 6.9% in October 2021 (figure 2C; online supplemental table 1).
The CFR in figure 2C also indicates a similar pattern for all age groups, with higher levels at the start of the pandemic that then went down to peak again in December 2020—although at lower levels than in the initial months—reaching a plateau between May 2021 and September 2021 when it starts to increase again. As with the positivity, CFR is higher for older individuals, with a large difference beginning at 50 years compared with younger individuals. The CFR in figure 2C shows a common pattern across ages but with attenuated resurgences at younger ages to the point that there is no second resurgence but rather stabilisation at the youngest ages.
The prevalence of the three analysed comorbidities (figure 3) among newly diagnosed cases also decreased significantly over the period of observation but without any resurgence between September and December 2020 (unlike the CFR). By October 2021, the levels were about half of those observed at the initial months of the pandemic. There appears to be a new increase among the older age groups from August 2021 through October 2021.
Figure 3.

COVID-19-positive individuals treated at Mexican Institute of Social Security (IMSS): prevalence of comorbidities by age group and month. Source: authors’ analysis of IMSS Online Influenza Epidemiological Surveillance System (SINOLAVE).
The prevalence of diabetes among those less than 20 years of age with COVID-19 is close to zero throughout the months of observation. Prevalence increases dramatically with age, peaking among 70–79 year-olds, before falling again among the 80+ year-olds. There is a common trend for all groups 20+, with decreasing prevalence until June to July 2021 followed by plateauing among the younger groups and a resurgence among older ones.
The decline in the prevalence of obesity among those individuals with COVID-19 is striking, with the later levels being almost half of the initial levels (even discarding the first month of observation). As with diabetes, prevalence increases with age, but less so. While the ratio between the groups with the highest to lowest prevalence among adults is as high as eightfold, for obesity it is closer to twofold. Also similar to diabetes, the last 3–4 months show a plateauing among the younger groups and an increase among the older groups, but less of a change that with diabetes.
The pattern for hypertension mirrors that for diabetes with an even greater increase by age group. Prevalence among the highest prevalence groups is almost 15-fold that of the 20–29 year-olds.
By October 2021, 25% of those individuals who tested positive for COVID-19 were fully vaccinated (had completed doses at least 15 days before the onset of symptoms) (online supplemental figure 1; online supplemental table 1).
Interrupted time series analysis
As shown in figure 4, controlling for comorbidities (diabetes, hypertension and obesity), age, sex, positivity rate and vaccination status (at least one dose of a COVID-19 vaccine), the hospitalisation rate has declined comparing wave 1 with the end of the analytical period for all age groups. The negative trend was significant (0.05) for those 20–29 (2.45 percentage points), 30–39 (2.37 percentage points), 40–49 (4.69 percentage points), 70–79 (3.63 percentage points) and 80+ years (2.48 percentage points) (online supplemental table 2).
Figure 4.

Interrupted times series for COVID-19 hospitalisation rate in Mexico from March 2020 to October 2021 by age group. Source: authors’ analysis of Mexican Institute of Social Security (IMSS) Online Influenza Epidemiological Surveillance System (SINOLAVE).
The rate increased at the beginning of waves 2 and 3, particularly for those aged 40 years and more so for older individuals.
The transition from wave 1 to wave 2 is associated with a positive change in level for all age groups but the coefficients are only statistically significant for those 80+ (5.41 percentage points). The change in trend is also positive for most age groups and significant for those 20–29 (2.27 percentage points), 30–39 (2.86 percentage points), 70–79 (4.93 percentage points) and 80+ years (2.49 percentage points) (online supplemental table 2).
Finally, the transition from wave 2 to wave 3 is associated with a negative change in level for most age groups but the coefficients are only significant for those 60–69 (12.58 percentage points) and 70–79 years (15.26 percentage points). There are no significant changes in the trends at the start of wave 3 (online supplemental table 2).
In figure 5, the results for the ITSA models with the CFR are shown. As with hospitalisation, there is a negative trend for all age groups across the analytical period, with increases at the beginning of waves 2 and 3. The negative trend in the CFR starting at wave 1 is significant for those 0–9 (2.6 percentage points), 20–29 (0.34 percentage points), 30–39 (0.86 percentage points), 40–49 (2.77 percentage points), 70–79 (4.75 percentage points) and 80+ years (4.08 percentage points) (online supplemental table 3).
Figure 5.

Interrupted times series for COVID-19 case fatality rate in Mexico from March 2020 to October 2021 by age group. Source: authors’ analysis of Mexican Institute of Social Security (IMSS) Online Influenza Epidemiological Surveillance System (SINOLAVE).
At the start of wave 2, there is an increase in level for the CFR for most age groups, which is significant only for those 0–9 (2.93 percentage points), 70–79 (6.68 percentage points) and 80+ years (8.37 percentage points). There is a positive change in the trend in all age groups, which is significant for those 0–9 (2.77 percentage points), 20–29 (3.5 percentage points), 30–39 (1.1 percentage points), 40–49 (2.91 percentage points), 70–79 (6.88 percentage points) and 80+ years (4.63 percentage points) (online supplemental table 3).
At the start of wave 3, there is a negative and significant change in the level of CFR for those 70–79 of −12.08 percentage points. There is a positive and significant change in the trend for those 70–79 (−3.14 percentage points) (online supplemental table 3).
Vaccination started late in the period of observation, with only adults over 60 reaching 30% vaccinated by the end of the period. Even among the elderly, vaccination was only available for the third wave, rendering the question of changes in level and slope at the wave transitions moot. Among those 30–39, vaccination was significantly associated with reduced lethality but not hospitalisation (online supplemental table 3).
The prevalence of hypertension was positively related to hospitalisation among those 20–29 and 80+ (online supplemental table 3).
The positivity rate was positively related to lethality among those 70–79 and those 80 and above (online supplemental table 3).
Discussion
The overall pattern of the COVID-19 pandemic in Mexico shows a negative trend in hospitalisation and mortality rates among those infected for all age groups comparing March 2020 with October 2021. That overall decline, however, conceals an increase and then decrease in both hospitalisation and mortality rates in the second wave and another increase at the start of the third wave that had yet to peak as of October 2021. This pattern is not especially surprising—and it is consistent with patterns in other countries both in terms of decreasing CFR over time and seasonal peaks15—and could be explained by a combination of limitations in both availability of testing (biasing testing towards more severe cases during surges) and limitations in availability of health services (reducing access to care and/or quality of care for those infected during surges). Far more surprising, the prevalence of the principal comorbidities—diabetes, hypertension and obesity—among those hospitalised or dying from COVID-19 also declined significantly during the period of observation without a clear relationship to changes in waves, suggesting that the presence of these comorbidities was not driving the increases in hospitalisations or mortality rate during the surges as others have suggested.16
Mexico had one of the lowest testing rates and highest test positivity rates in the world for the first wave. Increased availability of testing, increased testing rates and decreased test positivity (with temporary increases at the start of the second and third waves) occurred over time as testing capacity increased and rapid tests entered the market.17 This change over time in the proportion of suspected cases tested, if the probability of being tested was associated with presence of comorbidities, might help explain the declining prevalence of comorbidities, especially from the first to the second wave.
The observed parallel trends on mortality and comorbidities suggest that the decrease in the severity of the disease is likely to be at least partially due to the fact that the profile of those affected by COVID-19 has evolved over time with those being infected having a progressively lower prevalence of comorbidities (as opposed to just because more people without comorbidities are being tested). This trend is seen across almost all age groups for the three conditions and thus is not due to a change in the age profile of infection over time.
It is not apparent why individuals affected by COVID-19 during the latest waves appear to be healthier than those affected in the initial waves. As in other countries, people who work in front-line jobs with limited access to personal protection equipment18 or who live in high-density housing19 20 and are more likely to be exposed to SARS-CoV-2 may also be more likely to be living with one of these three comorbidities. If true, the observed trend could be related to saturation of the most susceptible individuals over time. An alternative hypothesis is that people with comorbidities were more susceptible to infection and thus were more likely to be infected earlier in the pandemic. Both hypotheses warrant further analyses, and have been previously proposed as a harvesting effect, that is, a reduction in mortality because those at greatest risk of severe disease were more likely to be infected early. However, it is not obvious that this was an important factor. Other work suggests that age is the most important risk factor (and is correlated with the most important comorbidities) and significant efforts were made in Mexico to reduce exposure for older adults. They were not the most likely to be working in the highest risk front-line jobs (such as working in the central market).21
A potential harvesting effect could also be socially determined; previous studies of the IMSS population have proposed a link between income and lethality, suggesting that once controlling for several factors—including comorbidities—those in the lowest income decile are more likely to die if they are COVID-19 positive compared with those in the top income decile.22 To the extent that lower income deciles were less able to protect themselves from infection and are more likely to be affected by comorbidities18–20 23 then a shift in the socioeconomic profile of those infected over time could help explain the shift in comorbidities and the shift in CFR (the latter both because of the direct effect of poverty and the indirect effect mediated through comorbidities).
The majority of the decline in severity occurred prior to the initiation of vaccination, which occurred in Mexico for non-health professionals in February 2021 for those 60 years and older.24 Once vaccination began, it seems to have contributed to further reduction in severity among those vaccinated.
The main limitation of our observational analysis is that by using an administrative data set, we had no control over the procedures to collect, integrate or validate the included variables. We were not able to validate the quality of the data against other data sets in the IMSS. Also, because our results only reflect individuals in Mexico who sought care for COVID-like symptoms at IMSS facilities, they may not reflect the patterns in the rest of the Mexican population or similar populations in other countries. Finally, comorbidities among individuals with SARS-CoV-2 were self-reported and would not include individuals without previous knowledge of their condition (or who chose not to report). However, there is no indication that such under-reporting would change over time and thus change the relative results.
Conclusion
In Mexico, in a similar trend to other countries, the CFR and hospitalisation rate for COVID-19 had a negative trend from March 2021 to October 2021, an indication of decreasing severity of the condition for all age groups. During the same period, the proportion of COVID-19-positive individuals with diabetes, hypertension and obesity also decreased dramatically, suggesting ongoing changes in the impact on those infected and in the profile of who is infected.
Supplementary Material
Footnotes
Twitter: @gutierrezjp
Contributors: JPG and SMB conceptualised the study. JPG coordinated the analysis and drafted the first version of the manuscript, and is the guarantor. DL participated in the analysis. JPG, DL, IA, AJ, GO and SMB reviewed, provided comments and approved the final manuscript.
Funding: This project was partially funded by a C3.ai Digital Transformation Institute grant.
Competing interests: None declared.
Patient and public involvement: Patients and/or the public were not involved in the design, or conduct, or reporting, or dissemination plans of this research.
Provenance and peer review: Not commissioned; externally peer reviewed.
Supplemental material: This content has been supplied by the author(s). It has not been vetted by BMJ Publishing Group Limited (BMJ) and may not have been peer-reviewed. Any opinions or recommendations discussed are solely those of the author(s) and are not endorsed by BMJ. BMJ disclaims all liability and responsibility arising from any reliance placed on the content. Where the content includes any translated material, BMJ does not warrant the accuracy and reliability of the translations (including but not limited to local regulations, clinical guidelines, terminology, drug names and drug dosages), and is not responsible for any error and/or omissions arising from translation and adaptation or otherwise.
Data availability statement
Data are available upon reasonable request. Access to the administrative data used for this analysis (SINOLAVE) is legally restricted by the IMSS law; authors have been granted access by a research agreement. Sharing of deidentified aggregated data will be considered by authors upon reasonable request.
Ethics statements
Patient consent for publication
Not applicable.
References
- 1.Palacio Mejía LS, Wheatley Fernández JL, Ordoñez Hernández I, et al. Estimación del Exceso de Mortalidad Por Todas Las Causas Durante La Pandemia del COVID-19 en México. Salud Publica Mex 2021;63:211–24. 10.21149/12225 [DOI] [PubMed] [Google Scholar]
- 2.INEGI . Principales Causas de Mortalidad Por Residencia habitual, Grupos de Edad Y Sexo del Fallecido [Internet]. 2022. Available: https://www.inegi.org.mx/sistemas/olap/registros/vitales/mortalidad/tabulados/ConsultaMortalidad.asp
- 3.INEGI . press release. Estadística de Defunciones Registradas de Enero a Junio de 2021 (Preliminar). Ciudad de Mexico, 2022. [Google Scholar]
- 4.Censo Nacional de Población Y Vivienda. Presentación de resultados; Aguascalientes, México: INEGI, 2021 [Google Scholar]
- 5.Islam N, Shkolnikov VM, Acosta RJ, et al. Excess deaths associated with COVID-19 pandemic in 2020: Age and sex Disaggregated time series analysis in 29 high income countries. BMJ 2021;373:n1137. 10.1136/bmj.n1137 [DOI] [PMC free article] [PubMed] [Google Scholar]
- 6.Gutierrez JP, Bertozzi SM. Non-Communicable diseases and inequalities increase risk of death among COVID-19 patients in Mexico. PLOS ONE 2020;15:e0240394. 10.1371/journal.pone.0240394 [DOI] [PMC free article] [PubMed] [Google Scholar]
- 7.Najera H, Ortega-Avila AG. Health and institutional risk factors of COVID-19 mortality in Mexico, 2020. Am J Prev Med 2021;60:471–7. 10.1016/j.amepre.2020.10.015 [DOI] [PMC free article] [PubMed] [Google Scholar]
- 8.Peña JE la, Rascón-Pacheco RA, Ascencio-Montiel I de J, et al. Hypertension, diabetes and obesity, major risk factors for death in patients with COVID-19 in Mexico. Archives of Medical Research 2021;52:443–9. 10.1016/j.arcmed.2020.12.002 Available: 10.1016/j.arcmed.2020.12.002 [DOI] [PMC free article] [PubMed] [Google Scholar]
- 9.Coronavirus pandemic (COVID-19) [Internet]. 2021. Available: https://ourworldindata.org/coronavirus
- 10.Juárez-Flores A, Ascencio-Montiel IJ, Gutiérrez JP, et al. COVID-19 in the Mexican social security Institute (IMSS) population. prevalent symptoms. Public and Global Health [Preprint] 2022. 10.1101/2022.04.12.22273734 [DOI] [Google Scholar]
- 11.Baum CF, Schaffer ME. ACTEST: Stata module to perform Cumby-Huizinga general test for autocorrelation in time series. Statistical Software Components Boston College Department of Economics, 2013. [Google Scholar]
- 12.Linden A. Conducting interrupted time-series analysis for Single- and multiple-group comparisons. The Stata Journal 2015;15:480–500. 10.1177/1536867X1501500208 [DOI] [Google Scholar]
- 13.StataCorp . Stata Statistical Software: Release 16. College Station, TX: StataCorp LLC, 2019. [Google Scholar]
- 14.World Health Organization . Public health criteria to adjust public health and social measures in the context of COVID-19. Geneva: WHO, 2020. [Google Scholar]
- 15.Wiemken TL, Khan F, Puzniak L, et al. Seasonal trends in COVID-19 cases, hospitalizations, and mortality in the United States and Europe. Sci Rep 2023;13:3886. 10.1038/s41598-023-31057-1 [DOI] [PMC free article] [PubMed] [Google Scholar]
- 16.Ramírez-Aldana R, Gomez-Verjan JC, Bello-Chavolla OY, et al. Spatial Epidemiological study of the distribution, clustering, and risk factors associated with early COVID-19 mortality in Mexico. PLOS ONE 2021;16:e0254884. 10.1371/journal.pone.0254884 [DOI] [PMC free article] [PubMed] [Google Scholar]
- 17.Loza A, Wong-Chew RM, Jiménez-Corona M-E, et al. Two-year follow-up of the COVID-19 pandemic in Mexico. Front Public Health 2022;10:1050673. 10.3389/fpubh.2022.1050673 [DOI] [PMC free article] [PubMed] [Google Scholar]
- 18.Piccoli L, Ferrari P, Piumatti G, et al. Risk assessment and Seroprevalence of SARS-Cov-2 infection in Healthcare workers of COVID-19 and non-COVID-19 hospitals in Southern Switzerland. Lancet Reg Health Eur 2021;1:100013. 10.1016/j.lanepe.2020.100013 [DOI] [PMC free article] [PubMed] [Google Scholar]
- 19.Alam MdZ. Is population density a risk factor for Communicable diseases like COVID-19? A case of Bangladesh. Asia Pac J Public Health 2021;33:949–50. 10.1177/1010539521998858 [DOI] [PMC free article] [PubMed] [Google Scholar]
- 20.Hong B, Bonczak BJ, Gupta A, et al. Exposure density and neighborhood disparities in COVID-19 infection risk. Proc Natl Acad Sci USA 2021;118. 10.1073/pnas.2021258118 [DOI] [PMC free article] [PubMed] [Google Scholar]
- 21.Astengo M, Tassinari F, Paganino C, et al. Weight of risk factors for mortality and short-term mortality displacement during the COVID-19 pandemic. J Prev Med Hyg 2021;62:E864–70. 10.15167/2421-4248/jpmh2021.62.4.2269 [DOI] [PMC free article] [PubMed] [Google Scholar]
- 22.Arceo-Gomez EO, Campos-Vazquez RM, Esquivel G, et al. The income gradient in COVID-19 mortality and Hospitalisation: An observational study with social security administrative records in Mexico. Lancet Reg Health Am 2022;6:100115. 10.1016/j.lana.2021.100115 [DOI] [PMC free article] [PubMed] [Google Scholar]
- 23.Kua J, Patel R, Nurmi E, et al. healthcareCOVID: A national cross-sectional observational study identifying risk factors for developing suspected or confirmed COVID-19 in UK Healthcare workers. PeerJ 2021;9:e10891. 10.7717/peerj.10891 [DOI] [PMC free article] [PubMed] [Google Scholar]
- 24.Gobierno de México . Política nacional rectora de vacunación contra el SARS-CoV2 para la prevención de la COVID-19 en México. Documento rector. Ciudad de México: Secretaría de Salud, 2020. [Google Scholar]
Associated Data
This section collects any data citations, data availability statements, or supplementary materials included in this article.
Supplementary Materials
bmjopen-2022-063211supp001.pdf (289.3KB, pdf)
Data Availability Statement
Data are available upon reasonable request. Access to the administrative data used for this analysis (SINOLAVE) is legally restricted by the IMSS law; authors have been granted access by a research agreement. Sharing of deidentified aggregated data will be considered by authors upon reasonable request.