Abstract
Tyrosine kinase inhibitor therapy revolutionized chronic myeloid leukemia treatment and showed how targeted therapy and molecular monitoring could be used to substantially improve survival outcomes. We used chronic myeloid leukemia as a model to understand a critical question: why do some patients have an excellent response to therapy, while others have a poor response? We studied gene expression in whole blood samples from 112 patients from a large phase III randomized trial (clinicaltrials gov. Identifier: NCT00471497), dichotomizing cases into good responders (BCR::ABL1 ≤10% on the International Scale by 3 and 6 months and ≤0.1% by 12 months) and poor responders (failure to meet these criteria). Predictive models based on gene expression demonstrated the best performance (area under the curve =0.76, standard deviation =0.07). All of the top 20 pathways overexpressed in good responders involved immune regulation, a finding validated in an independent data set. This study emphasizes the importance of pretreatment adaptive immune response in treatment efficacy and suggests biological pathways that can be targeted to improve response.
Introduction
Tyrosine kinase inhibitor (TKI) therapy has revolutionized the treatment of chronic myeloid leukemia (CML), giving patients with chronic phase (CML-CP) a near-normal age-adjusted life span.1,2 In the ENESTnd (Evaluating Nilotinib Efficacy and Safety in Clinical Trials-Newly Diagnosed Patients, clinicaltrials gov. Identifier: NCT00471497) study, rates of complete cytogenetic response and major molecular response (MMR) for patients receiving either 300 mg nilotinib twice daily (BID), 400 mg nilotinib BID, or imatinib 400 mg once daily were 80% and 44%, 78% and 43%, and 65% and 22%, respectively, at 12 months.3 The second-generation TKI (bosutinib, dasatinib, and nilotinib) are more potent than imatinib, a first-generation TKI, and thus result in deeper molecular responses and lower rates of progression to advanced-phase disease, although overall survival rates are comparable to those of imatinib.3-8
The depth and kinetics of molecular response have clinical implications. Chronologically, the first milestone of molecular response is a BCR::ABL1 on the International Scale (IS) level of ≤10% after 3 to 6 months of therapy, denoted as early molecular response (EMR).9-13 EMR is associated with lower rates of progression to advanced-phase disease and superior long-term responses with all TKI.6,7,9,10,12,14-16 Lack of EMR (BCR::ABL1IS >10% after 3-6 months of therapy) occurs in approximately 30% of patients with CML-CP treated with imatinib and roughly 5% to 15% of patients treated with dasatinib or nilotinib and is associated with worse outcomes.6,7,10,12-17 For example, in an analysis of 282 patients with CML-CP treated with imatinib, the 8-year overall survival, progression-free survival, and event-free survival rates were 93%, 93%, and 65%, respectively, for patients with BCR::ABL1IS of ≤10% at 3 months compared with 57%, 57%, and 7%, respectively, for those with BCR::ABL1IS of >10% at 3 months.9
MMR is another important milestone because it is associated with a very low rate of progression and resistance (thus, MMR is referred to as a “safe haven”).12,13 Many patients who achieve MMR have a continued molecular response, reaching a BCR::ABL1IS level of ≤0.01%, referred to as a deep molecular response (DMR).12,13 DMR is clinically relevant because many studies have shown that, of patients who maintain DMR for several years, roughly 40% to 50% can successfully discontinue TKI therapy and achieve treatment-free remission (TFR).18-20
Thus, the two main clinical questions in CML therapy are when to change and when to stop therapy. The biological corollary of these clinical questions is: why does TKI therapy produce good responses in some patients and poor responses in others? If we understood the biology of good and poor responses, could we predict response before treatment, add new therapies for patients bound for a poor response, and change patients’ fate to that of a good responder?
A prior report by Branford et al. studied the transcriptome profiles of 46 patients with CML-CP who mostly received imatinib as their initial therapy. The study determined genetic alterations at baseline and blast crisis to determine which genetic alterations underlie disease transformation.21 We used pretreatment diagnostic samples from the ENESTnd study, which compared imatinib with nilotinib in patients with newly diagnosed CML-CP, to study the difference in RNA expression in the subsets of patients with good and poor responses, to define genetic predictors of response, and to infer the biological pathways and processes that drive response. We then validated these predictions and inferences using the previously established baseline transcriptome profiling data set from Branford et al.
Methods
Patients and samples
The randomized trial ENESTnd compared imatinib 400 mg once daily (n=283), nilotinib 300 mg twice daily (BID) (n=282), and nilotinib 400 mg BID (n=281) (Online Supplementary Figure S1). This study was approved by an Ethics Committee or Review Board at Novartis and participating institutions. All patients provided informed consent. Study procedures were conducted in accordance with the ethical standards of the Declaration of Helsinki and local laws and regulations.
Sample processing, quality control, and genomic analysis
Detailed methods are available in the Online Supplementary Appendix. In brief, RNA was extracted from baseline, pretreatment whole blood samples and used for RNA sequencing (RNA-seq) library construction. RNA libraries were sequenced using HiSeq 2500 (Illumina) in six armand response group–matched batches to a depth of 50 million reads per sample. Reads were mapped to the reference human genome (build hg19), assembled into transcripts, normalized for abundance, and counted.
Bioinformatic analysis
All statistical analyses were performed in the R programming language. Statistical comparisons between responder groups were performed using the Wilcoxon rank-sum test unless otherwise stated.
Gene expression profile analyses
The edgeR package was used to normalize the RNA-seq counts via the trimmed mean of M values method and perform a log2(counts per million [cpm] +1) transformation. Genes with insufficient expression (i.e., log2[cpm +1] <1.1 in at least 50% of samples) were removed. The log2(cpm +1) data were standardized by a z-score transformation such that the mean expression of each gene across all samples was 0 and the standard deviation was 1.
Deconvolution of cell types
Inference of relative abundance of ten cell types in each sample was performed using the MCP-counter algorithm applied to the log2(cpm +1) gene expression data.22
Bootstrapped prediction of responder status
Detailed methods can be found in the Online Supplementary Appendix. In short, penalized logistic regression models were constructed from gene expression, clinical variables, normalized enrichment scores of biological pathways, and inferred cell type compositions. Each input data set was subject to 250 iterations in which bootstrapping (i.e., random sampling with replacement) of the input samples was performed to create random subsets of data on which the model was trained and evaluated via area under the curve (AUC). A final predictive model was trained on all the ENESTnd samples using logistic ridge regression.
Prediction of responder status in validation cohort
A final logistic ridge regression model was trained on the gene expression data of all 112 ENESTnd samples and validated using the Branford et al. validation data by AUC as described on page 5 of the Online Supplementary Appendix (Online Supplementary Table S1).
Interpretation of predictive models
Gene set enrichment analysis using the fGSEA package was used to interpret the gene expression–based predictor by using the model coefficients assigned to each gene.23 The databases for canonical pathways and gene ontology biological processes were downloaded from MSigDb and used as references for these tests. For models not based on gene expression, interpretation centered on the relative importance of individual features as ranked by their model coefficients.
Results
Differences in patient response observed by 12 months persisted up to 10 years
Patients were dichotomized into good and poor responder groups. Good responders were defined as those who achieved BCR::ABL1IS ≤10% by 3 and 6 months and MMR by 12 months. Patients who did not meet both criteria were labeled as poor responders. One patient could not be labeled by these definitions after exhibiting BCR::ABL1IS <10% by 3 and 6 months but was lost to follow-up after 9 months without achieving BCR::ABL1IS ≤0.1%. As this patient exhibited a trajectory consistent with good responders, including early molecular response and BCR::ABL1IS=0.12% by 9 months, we labeled this patient as a good responder. In total, there were 40 good responders and 72 poor responders (Table 1). The BCR::ABL1IS levels of good and poor responders remained significantly different at 10 years (Figure 1; P<0.001). In our cohort, 95% of good responders achieved a DMR by 5 years, compared to 17% of poor responders (Online Supplementary Figure S1), consistent with published literature.12,13
Baseline gene expression predicted tyrosine kinase inhibitor response
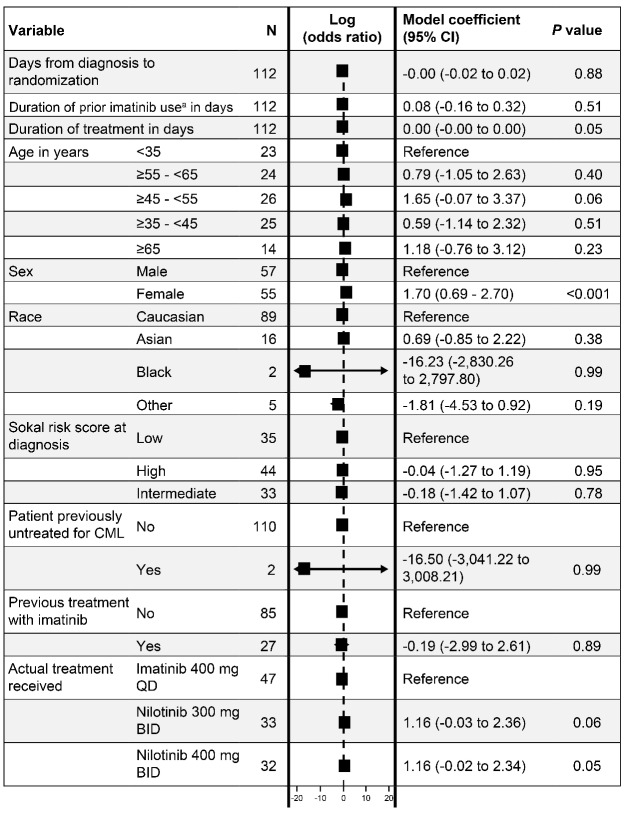
We next studied how clinical features and gene expression signatures related to responder status. For clinical features, only female sex was associated with response in a multivariate analysis of clinical variables (P<0.001), although duration of treatment (P=0.05), age between 45 and 55 years (P=0.06), and treatment with either 300 mg (P=0.06) or 400 mg (P=0.06) of nilotinib trended with response (Figure 2).
We next examined the differential gene expression across the two responder groups. We developed a logistic ridge regression model to predict responder status based on baseline gene expression (13,575 genes; see Methods). The principal component analysis (PCA) plots based on response criteria, which demonstrate the distribution of good and poor responders predicted in the logistic ridge model across the two variables most influencing their distribution, are shown in the Online Supplementary Figure S2A. The performance of the model (AUC=0.76; standard deviation [SD] =0.07) was significantly better than that of a null model (P=7.7×10⁻⁵) at a 95% confidence interval (CI) (Table 2; Online Supplementary Figure S3). Incorporating clinical variables into the model did not significantly improve prediction performance (AUC=0.75; SD=0.07; P=1.5×10⁻⁴).
Table 1.
Distribution of responders versus poor responders split by treatment type.

Figure 1.
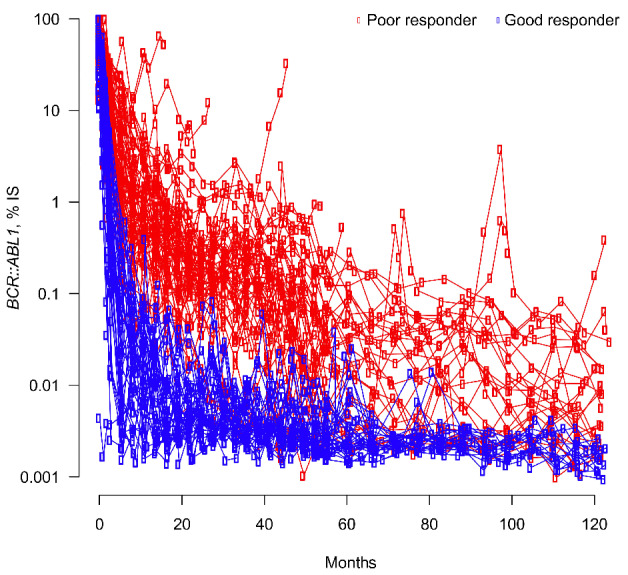
Early differences in patient tyrosine kinase inhibitor response persisted up to 10 years. BCR::ABL1IS (log10 scale) over time for good (blue) and poor (red) responders. IS: International Scale. Calculations of BCR::ABL1IS levels >10% are less accurate than those ≤10%.45
We validated the model on an independent data set of 46 patients with CP-CML reported by Branford and colleagues.21 These 46 patients underwent transcriptome sequencing at diagnosis and mostly received imatinib as their initial therapy. In the study, 19 good responders achieved durable MMR, whereas the remaining 25 poor responders progressed to blast phase (n=24) or did not respond to four TKI (n=1). A total of 41 patients received imatinib, including all the good responders, and three patients received nilotinib. The model developed on the ENESTnd data set predicted the responder status of the Branford validation data significantly better than a random model (AUC=0.67; P=0.02). Taken together, these results demonstrated that baseline gene expression was strongly associated with response to TKI therapy and that it provided more predictive power than clinical variables alone.
Figure 2.
Multivariate analysis of clinical variables vs responder status.
The most influential variable was sex, with women responding best. An odds ratio >1 indicated an association with good responders whereas those <1 indicated association with poor responders. BID: twice daily; CI: confidence interval. aIn the ENESTnd trial, prior tyrosine kinase inhibitor treatment was not allowed except for ≤2 weeks’ duration of imatinib.
Tyrosine kinase inhibitor response was associated with increased immune response and cytotoxic lymphocyte activity at baseline
We next interrogated the differential gene expression set for genes and pathways associated with the two response groups. In order to identify correlates of response, we performed gene- and pathway-level analysis. A total of 458 genes were differentially expressed (false discovery rate
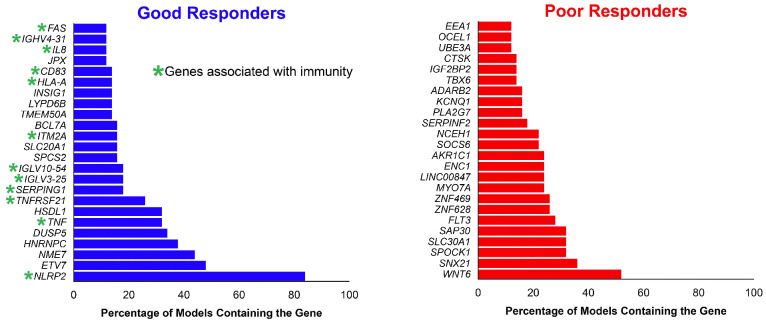
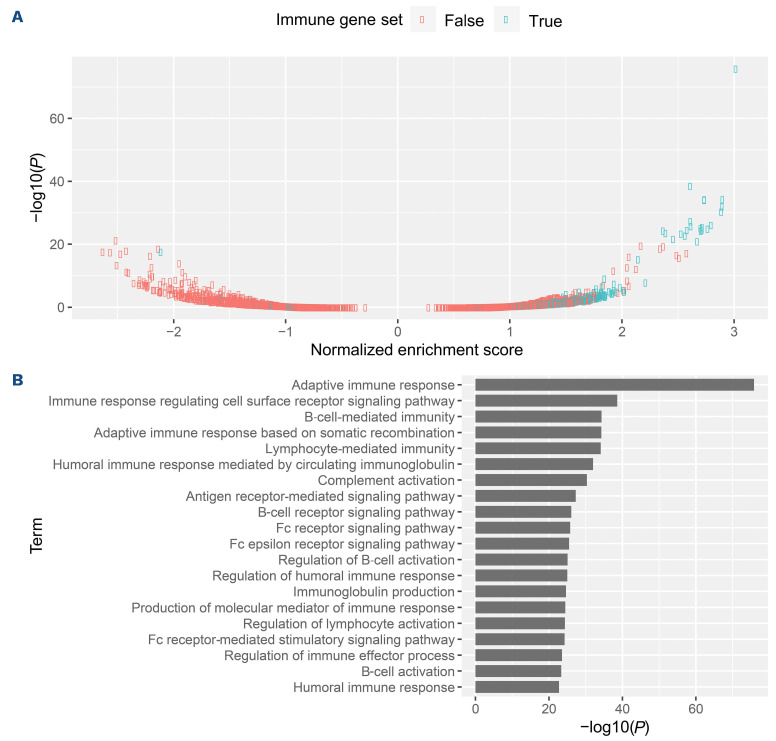
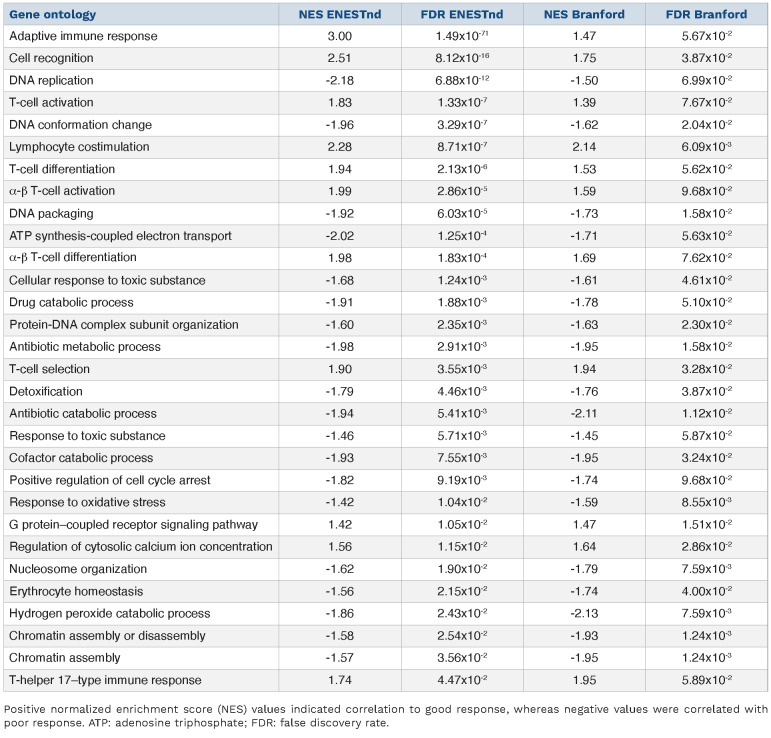
[FDR] <5%) between good and poor responders (Online Supplementary Figure S3; Online Supplementary Table S2). The top differentially upregulated genes in the good responder group were enriched for genes associated with the immune system, whereas genes upregulated in poor responders were enriched for genes associated with cell cycle and metabolism (Figure 3). Among the genes upregulated in good responders were programmed death-ligand 1 (PD-L1) programmed cell death protein 1 (PD-1) death 1 ligand 1 (PD-L1) (Online Supplementary Figure S4). In the Branford data set, PD-L1 was also upregulated in the good clinical response group. We then performed gene enrichment analyses to infer functional differences between good and poor responders. Good responders exhibited strong positive enrichment for expression of immune-related genes. Indeed, all 20 of the most significantly enriched gene sets were related to immunity (Figure 4; Online Supplementary Table S3). Immune-related pathways were likewise positively associated with good response in the Branford data set (Table 3). Additionally, drug catabolism was associated with poor response in both data sets. As an alternative approach for a pathway-based predictor, we next used the normalized enrichment scores of biological pathways instead of gene expression, and this different approach was also successful in predicting response (AUC=0.73; SD=0.09; P=3.9×10⁻³) and showed results that were consistent with the expression-based predictor.
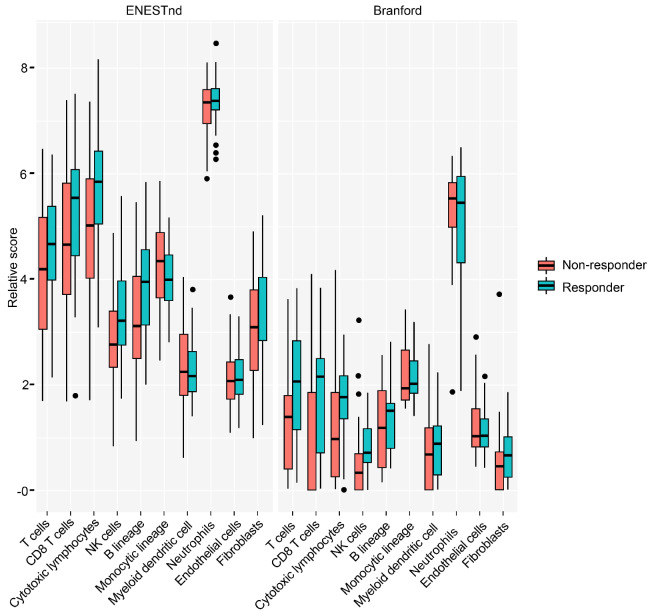
We next examined which specific immune-cell types were participating in the response, using the MCP-counter algorithm to infer cell types from the gene expression data. We deconvolved the bulk expression data into ten immune compartments. We found that a good response was associated with increased activity of natural killer (NK) (P=0.01) and CD8+ T cells (P=0.02) (Figure 5; Online Supplementary Table S4). Consistently, response was also associated with populations of cytotoxic lymphocytes (i.e., NK cells and CD8+ T cells; P=0.0037) and T cells (P=0.02). These associations also held true in the Branford data set (NK cells, P=0.04; CD8+ T cells, P=0.04; cytotoxic lymphocytes, P=0.08; T cells, P=0.06) (Figure 5; Online Supplementary Table S4). The immune concordance across data sets was especially striking given that only 17 genes were differentially expressed (FDR <5%) between optimal and poor responders in the Branford data set, and only one of these (USP6) was differentially expressed in both the ENESTnd and Branford data sets (Online Supplementary Table S2).
We also explored if peripheral blood lymphocyte counts at baseline could influence the gene expression signature. Overall, there was no difference in the total white blood cell count between response groups. There were no significant differences between absolute and percentage lymphocytes across response groups (Online Supplementary Table S5). Taken together, the data suggest that good response, compared to poor response, is strongly influenced by immune processes governed largely through cytotoxic lymphocytes.
Chronic myeloid leukemia regulatory network analysis
We then asked how gene expression programs were being controlled at the transcription factor level. We inferred a CML gene regulatory network (GRN) from the ENESTnd expression data using MINER.24 The CML GRN comprises 304 transcription factors regulating 8,827 genes partitioned into 2,479 regulons (Online Supplementary Table S6). Eighty-eight genetic programs were identified and their activity status in each sample was determined using MINER.
Table 2.
Expression-based models predicted tyrosine kinase inhibitor response.
Figure 3.
Genes upregulated in good and poor responders. Genes listed are those that were found in over 10% of the gene expression models (see Methods). The top upregulated genes in the good responder group were enriched in genes associated with immunity, in agreement with the immune pathway enrichment in good-responders (below, Figure 4).
We evaluated the CML responder status with respect to the activity of the GRN programs using the Fisher exact test. There were several programs whose activity was significantly different (P<0.05) between good and poor responders (Online Supplementary Table S7). The program whose activity was most significantly associated with good response was program Pr-9 (P=9.2x10⁻⁴). The genes of this program were regulated by interferon regulatory factors (IRF1-IRF5, IRF7 and IRF8), and were enriched for the hallmark pathways of interferon α response (adjusted P=4.9x10⁻³⁴), interferon γ response (adjusted P=2.0x10⁻³³), and immune system (Reactome; adjusted P=5.3x10⁻¹⁵). Moreover, these genes were significantly enriched for the experimental targets of IRF1 overexpression, consistent with the inferred regulation mechanism.
Several genetic programs were overactive in the poor responders of ENESTnd. A decision tree predictor trained on the genetic program activities of ENESTnd was predictive of poor response in both ENESTnd (AUC=0.75±0.06) and the Branford validation data set (AUC=0.70). The decision tree predictor could be further pruned to require only three genetic programs to achieve optimal performance (Online Supplementary Figure S5). These three genetic programs tended to be active in distinct subsets of patients. Thus, they may represent three alternative transcriptional pathways to therapy resistance.24
Figure 4.
Figure 4. Immune-related pathways were enriched in good responders. (A) Normalized enrichment score (NES) and associated P value of 3,478 gene ontology gene sets. Immune-related gene sets are indicated in blue. Other gene ontology gene sets are in red. Positive NES indicates positive association with good response. (B) P values of the 20 most significantly dysregulated gene sets; all are immune-related.
Table 3.
Gene ontology terms that were enriched (false discovery rate <10%) in both the ENESTnd and Branford data sets.
Tyrosine kinase inhibitor response remained associated with cytotoxic lymphocyte activity when deep molecular response was used as a clinical endpoint
In order to determine whether our results were sensitive to a later clinical endpoint, we repeated our analysis after redefining good responders as those patients who reached DMR by 5 years and poor responders as those who did not. Not surprisingly, this definition partitioned patients somewhat differently than the original response definitions applied above (Online Supplementary Table S8). Nonetheless, immune-related genes (Online Supplementary Table S9; AUC=0.76; SD=0.07; P=9.5×10⁻⁵) and pathways (Online Supplementary Table S10; AUC=0.73; SD=0.07; P=4.6×10⁻⁴) remained the strongest predictors of good response (Online Supplementary Table S11), and drug catabolism (FDR <5%) was still significantly correlated with poor response. Increased activity of B cells (P=0.04), NK cells (P=0.03), and aggregate cytotoxic lymphocytes (P=0.01) were also still significantly associated with achieving DMR (Online Supplementary Table S12). Thus, the finding of a strong immune influence on responder status is robust across at least two different definitions of clinical response.
Discussion
We found that pretreatment immunologic features, including upregulation of genes related to the immune system, pathways, and immune regulatory cells such as NK cells and cytotoxic lymphocytes, were associated with good response after initiation of TKI therapy. The adaptive immune response was the most influential biological process in predicting response of the ENESTnd patients, as determined by gene-set enrichment analysis of the expression-based predictor. Further evaluation of gene networks controlled by the expression of transcription factors differentially expressed in good and poor responders also pointed to activation of interferon and immune regulatory networks in good responders. The predictive importance of immunologic features was validated in an independent data set, a remarkable finding given the small size of the validation study and the fact that patient features, treatments, and sample handling were undoubtedly not uniform across both studies.
The pathway-based predictor offered valuable complementary information to the gene expression-based predictor. Specifically, if a pathway was predictive of response but the specific genes that are overexpressed in that pathway varied between patients, a pathway-based predictor would capture the pathway’s importance, but an expression-based predictor might not. While upregulated pathways in good responders were predominantly involved in immunity, an important pathway in predicting good response by this approach was downregulation of transforming growth factor b (TGF-b) receptor signaling. TGF-b signaling has been shown to promote leukemic stem cell survival in CML.25 Consistent with this finding, we observed that lower TGF-b activity correlated with better response (Online Supplementary Table S2). Thus, it is intuitive that downregulation of TGF-b receptor signaling correlates with good response. Among the pathways most predictive of poor response in the pathway-based predictor was disassembly of the b-catenin destruction complex and recruitment of axin to the membrane. This pathway is activated in response to Wnt signaling and results in b-catenin accumulation.26,27 This finding agrees with the observation that WNT6 was among the genes most predictive of poor response in the gene expression models (Online Supplementary Table S2). Of note, Wnt and b-catenin upregulation has been shown to be associated with progression from CP to blast-phase CML and cell-intrinsic TKI resistance, strengthening the association of poor response in CP with future progression.28,29-
Figure 5.
Cytotoxic lymphocytes were enriched in responders. Comparison of immune cell infiltration (inferred by MCP-counter) in the ENESTnd and Branford data sets. NK: natural killer.
CML is among the most immunogenic malignancies. Prior to the advent of TKI, the clinical evidence of the importance of the immune system in CML was as apparent by responses to interferon, allogeneic transplantation, and donor lymphocyte infusions. The use of TKI has further illuminated the importance of the immune system during disease pathogenesis and after the initiation of TKI therapy. A series of murine clinical and in vitro studies, largely based on sophisticated isolation of immune cells and accessing immune factor levels in blood, have demonstrated the role of immune exhaustion in CML pathogenesis, with an activation of the immune system after the initiation of TKI therapy30-33 and (reviewed34,35). Several lines of in vitro data suggest a fluid immunologic state in CML, whereby during disease progression, an expansion of myeloid-derived suppressor cells occurs that downmodulates NK and other T-cell activities, allowing the CML clone to expand.32,36-38 Additionally, it has previously been shown that PD-1 and PD-L1 are upregulated in CML at the time of diagnosis.39 Under therapy, TKI stimulate immune function, certainly by direct killing of CML cells but also perhaps indirectly by other TKI effects on the immune system.32,40 Our gene expression data support and complement these findings of the importance of the immune system in CML response (including the aforementioned PD-1 and PD-L1) and show that these differences in immune pathway use (and, by inference, biology in the actual patient) strongly segregate with good or poor response status. Moreover, using gene expression data has the added advantage of being unbiased in discerning gene and pathway involvement, and may uncover targetable pathways that can potentially move a patient from poor to good response.
NK cell biology has been of particular interest in studying TKI response in CML.36 Some studies have reported that prior to therapy, patients with CML had decreased numbers of NK cells compared with healthy controls,41 and increased numbers of NK cells during DMR seemed to correlate with improved odds of remaining in TFR after TKI discontinuation.42-44 Our data, derived by inferring cell type by gene expression, support and complement these findings, as well as show the potential importance of other types of immune cells (e.g., cytotoxic T cells). The interpretation of patterns in bulk gene expression data from unfractionated blood samples is complicated by the possibility of significant differences in cell type distribution between samples. However, pretreatment cell counts showed little differences in cell type proportions as a function of responder status (i.e., no significant differences at FDR <10%; Online Supplementary Table S5). Although we do not have data on the cell counts of cytotoxic lymphocytes, we applied a deconvolution algorithm (MCP-counter) to the gene expression data that was designed to estimate the abundance of different cell types, including cytotoxic lymphocytes, from complex mixtures. Thus, we expect that the significant differences in the inferred abundance of cytotoxic lymphocytes such as T cells and NK cells versus response status reflects a true difference in these populations, rather than an artifact of the varying composition of other cell types in the unfractionated samples.
Thus, predictive models based on multiple lines of analysis appear to converge on signatures of T-cell, NK-cell, and B-cell activation as predictive of good response, whereas Wnt signaling, TGF-b signaling, and cell-cycle progression predict poor response. The observation that patients with signatures of cytotoxic lymphocytes at baseline tend to respond best to TKI therapy suggests that the state of the immune system prior to therapy is predictive of response. These observations have two important implications. First, a panel of genes and quantification of cell types at diagnosis could be used to predict the likelihood of poor and good responses, and this prediction could be used to shape expectations, inform monitoring, and direct patients to clinical trials to improve response or to TFR strategies. Secondly, further understanding the role of the immune pathways involved in response might allow the pharmacological alteration of these pathways, potentially turning poor responders into good responders. The results of this work lead to several interesting and testable questions for the biology and treatment of CML, and we encourage our readers to explore the data sets provided and pursue these issues.
Supplementary Material
Acknowledgments
We thank Michelle Chadwick, PhD and Chris Hofmann, PhD (ScientificPathways, Inc) for medical editorial assistance with this manuscript. We thank Yumeng Wang for assistance with the mutation analysis.
Funding Statement
Funding: This study was supported by funding from Novartis. Financial support for medical editorial assistance was provided by Novartis.
References
- 1.Bower H, Bjorkholm M, Dickman PW, Hoglund M, Lambert PC, Andersson TM. Life expectancy of patients with chronic myeloid leukemia approaches the life expectancy of the general population. J Clin Oncol. 2016;34(24):2851-2857. [DOI] [PubMed] [Google Scholar]
- 2.Jabbour E. Chronic myeloid leukemia: first-line drug of choice. Am J Hematol. 2016;91(1):59-66. [DOI] [PubMed] [Google Scholar]
- 3.Saglio G, Kim DW, Issaragrisil S, et al. Nilotinib versus imatinib for newly diagnosed chronic myeloid leukemia. N Engl J Med. 2010;362(24):2251-2259. [DOI] [PubMed] [Google Scholar]
- 4.Kantarjian H, Shah NP, Hochhaus A, et al. Dasatinib versus imatinib in newly diagnosed chronic-phase chronic myeloid leukemia. N Engl J Med. 2010;362(24):2260-2270. [DOI] [PubMed] [Google Scholar]
- 5.Cortes JE, Saglio G, Kantarjian HM, et al. Final 5-year study results of DASISION: the dasatinib versus imatinib study in treatment-naive chronic myeloid leukemia patients trial. J Clin Oncol. 2016;34(20):2333-2340. [DOI] [PMC free article] [PubMed] [Google Scholar]
- 6.Hochhaus A, Saglio G, Hughes TP, et al. Long-term benefits and risks of frontline nilotinib vs imatinib for chronic myeloid leukemia in chronic phase: 5-year update of the randomized ENESTnd trial. Leukemia. 2016;30(5):1044-1054. [DOI] [PMC free article] [PubMed] [Google Scholar]
- 7.Kantarjian HM, Hughes TP, Larson RA, et al. Long-term outcomes with frontline nilotinib versus imatinib in newly diagnosed chronic myeloid leukemia in chronic phase: ENESTnd 10-year analysis. Leukemia. 2021;35(7):2142-2143. [DOI] [PMC free article] [PubMed] [Google Scholar]
- 8.Brummendorf TH, Cortes JE, Milojkovic D, et al. Bosutinib versus imatinib for newly diagnosed chronic phase chronic myeloid leukemia: final results from the BFORE trial. Leukemia. 2022;36(7):1825-1833. [DOI] [PMC free article] [PubMed] [Google Scholar]
- 9.Marin D, Ibrahim AR, Lucas C, et al. Assessment of BCR-ABL1 transcript levels at 3 months is the only requirement for predicting outcome for patients with chronic myeloid leukemia treated with tyrosine kinase inhibitors. J Clin Oncol. 2012;30(3):232-238. [DOI] [PMC free article] [PubMed] [Google Scholar]
- 10.Hanfstein B, Muller MC, Hehlmann R, et al. Early molecular and cytogenetic response is predictive for long-term progression-free and overall survival in chronic myeloid leukemia (CML). Leukemia. 2012;26(9):2096-2102. [DOI] [PubMed] [Google Scholar]
- 11.Neelakantan P, Gerrard G, Lucas C, et al. Combining BCR-ABL1 transcript levels at 3 and 6 months in chronic myeloid leukemia: implications for early intervention strategies. Blood. 2013;121(14):2739-2742. [DOI] [PMC free article] [PubMed] [Google Scholar]
- 12.NCCN Clinical Practice Guidelines in Oncology. Chronic Myeloid Leukemia. V1.2021. [Google Scholar]
- 13.Hochhaus A, Baccarani M, Silver RT, et al. European LeukemiaNet 2020 recommendations for treating chronic myeloid leukemia. Leukemia. 2020;34(4):966-984. [DOI] [PMC free article] [PubMed] [Google Scholar]
- 14.Hughes TP, Saglio G, Kantarjian HM, et al. Early molecular response predicts outcomes in patients with chronic myeloid leukemia in chronic phase treated with frontline nilotinib or imatinib. Blood. 2014;123(9):1353-1360. [DOI] [PMC free article] [PubMed] [Google Scholar]
- 15.Jain P, Kantarjian H, Nazha A, et al. Early responses predict better outcomes in patients with newly diagnosed chronic myeloid leukemia: results with four tyrosine kinase inhibitor modalities. Blood. 2013;121(24):4867-4874. [DOI] [PMC free article] [PubMed] [Google Scholar]
- 16.Jabbour E, Kantarjian HM, Saglio G, et al. Early response with dasatinib or imatinib in chronic myeloid leukemia: 3-year follow-up from a randomized phase 3 trial (DASISION). Blood. 2014;123(4):494-500. [DOI] [PMC free article] [PubMed] [Google Scholar]
- 17.Hochhaus A, Rosti G, Cross NC, et al. Frontline nilotinib in patients with chronic myeloid leukemia in chronic phase: results from the European ENEST1st study. Leukemia. 2016;30(1):57-64. [DOI] [PMC free article] [PubMed] [Google Scholar]
- 18.Mahon FX, Nicolini FE, Noël MP, et al. Preliminary report of the STIM2 study: a multicenter stop imatinib trial for chronic phase chronic myeloid leukemia de novo patients on imatinib. Blood. 2013;122(21):654. [Google Scholar]
- 19.Mahon FX, Rea D, Guilhot J, et al. Discontinuation of imatinib in patients with chronic myeloid leukaemia who have maintained complete molecular remission for at least 2 years: the prospective, multicentre Stop Imatinib (STIM) trial. Lancet Oncol. 2010;11(11):1029-1035. [DOI] [PubMed] [Google Scholar]
- 20.Ross DM, Branford S, Seymour JF, et al. Safety and efficacy of imatinib cessation for CML patients with stable undetectable minimal residual disease: results from the TWISTER study. Blood. 2013;122(4):515-522. [DOI] [PubMed] [Google Scholar]
- 21.Branford S, Wang P, Yeung DT, et al. Integrative genomic analysis reveals cancer-associated mutations at diagnosis of CML in patients with high-risk disease. Blood. 2018;132(9):948-961. [DOI] [PubMed] [Google Scholar]
- 22.Becht E, Giraldo NA, Lacroix L, et al. Estimating the population abundance of tissue-infiltrating immune and stromal cell populations using gene expression. Genome Biol. 2016;17(1):218. [DOI] [PMC free article] [PubMed] [Google Scholar]
- 23.Korotkevich G, Sukhov V, Sergushichev A. Fast gene set enrichment analysis. bioRxiv. 2019. Feb 1. 10.1101/060012 [Preprint, not peer-reviewed]. [DOI] [Google Scholar]
- 24.Wall MA, Turkarslan S, Wu WJ, et al. Genetic program activity delineates risk, relapse, and therapy responsiveness in multiple myeloma. NPJ Precis Oncol. 2021;5(1):60. [DOI] [PMC free article] [PubMed] [Google Scholar]
- 25.Naka K, Hoshii T, Muraguchi T, et al. TGF-beta-FOXO signalling maintains leukaemia-initiating cells in chronic myeloid leukaemia. Nature. 2010;463(7281):676-680. [DOI] [PubMed] [Google Scholar]
- 26.Song X, Wang S, Li L. New insights into the regulation of Axin function in canonical Wnt signaling pathway. Protein Cell. 2014;5(3):186-193. [DOI] [PMC free article] [PubMed] [Google Scholar]
- 27.Gerlach JP, Emmink BL, Nojima H, Kranenburg O, Maurice MM. Wnt signalling induces accumulation of phosphorylated beta-catenin in two distinct cytosolic complexes. Open Biol. 2014;4(11):140120. [DOI] [PMC free article] [PubMed] [Google Scholar]
- 28.Radich JP, Dai H, Mao M, et al. Gene expression changes associated with progression and response in chronic myeloid leukemia. Proc Natl Acad Sci U S A. 2006;103(8):2794-2799. [DOI] [PMC free article] [PubMed] [Google Scholar]
- 29.Jamieson CH, Ailles LE, Dylla SJ, et al. Granulocyte-macrophage progenitors as candidate leukemic stem cells in blast-crisis CML. N Engl J Med. 2004;351(7):657-667. [DOI] [PubMed] [Google Scholar]
- 30.Christiansson L, Soderlund S, Svensson E, et al. Increased level of myeloid-derived suppressor cells, programmed death receptor ligand 1/programmed death receptor 1, and soluble CD25 in Sokal high risk chronic myeloid leukemia. PLoS One. 2013;8(1):e55818. [DOI] [PMC free article] [PubMed] [Google Scholar]
- 31.Christiansson L, Soderlund S, Mangsbo S, et al. The tyrosine kinase inhibitors imatinib and dasatinib reduce myeloid suppressor cells and release effector lymphocyte responses. Mol Cancer Ther. 2015;14(5):1181-1191. [DOI] [PubMed] [Google Scholar]
- 32.Hughes A, Clarson J, Tang C, et al. CML patients with deep molecular responses to TKI have restored immune effectors and decreased PD-1 and immune suppressors. Blood. 2017;129(9):1166-1176. [DOI] [PubMed] [Google Scholar]
- 33.Mumprecht S, Schurch C, Schwaller J, Solenthaler M, Ochsenbein AF. Programmed death 1 signaling on chronic myeloid leukemia-specific T cells results in T-cell exhaustion and disease progression. Blood. 2009;114(8):1528-1536. [DOI] [PubMed] [Google Scholar]
- 34.Hughes A, Yong ASM. Immune effector recovery in chronic myeloid leukemia and treatment-free remission. Front Immunol. 2017;8:469. [DOI] [PMC free article] [PubMed] [Google Scholar]
- 35.Hsieh YC, Kirschner K, Copland M. Improving outcomes in chronic myeloid leukemia through harnessing the immunological landscape. Leukemia. 2021;35(5):1229-1242. [DOI] [PMC free article] [PubMed] [Google Scholar]
- 36.Carlsten M, Järås M. Natural killer cells in myeloid malignancies: immune surveillance, NK cell dysfunction, and pharmacological opportunities to bolster the endogenous NK cells. Front Immunol. 2019;10:2357. [DOI] [PMC free article] [PubMed] [Google Scholar]
- 37.Giallongo C, Parrinello N, Brundo MV, et al. Myeloid derived suppressor cells in chronic myeloid leukemia. Front Oncol. 2015;5:107. [DOI] [PMC free article] [PubMed] [Google Scholar]
- 38.Bizymi N, Bjelica S, Kittang AO, et al. Myeloid-derived suppressor cells in hematologic diseases: promising biomarkers and treatment targets. Hemasphere. 2019;3(1):e168. [DOI] [PMC free article] [PubMed] [Google Scholar]
- 39.Norde WJ, Maas F, Hobo W, et al. PD-1/PD-L1 interactions contribute to functional T-cell impairment in patients who relapse with cancer after allogeneic stem cell transplantation. Cancer Res. 2011;71(15):5111-5122. [DOI] [PubMed] [Google Scholar]
- 40.Giallongo C, Parrinello N, Tibullo D, et al. Myeloid derived suppressor cells (MDSCs) are increased and exert immunosuppressive activity together with polymorphonuclear leukocytes (PMNs) in chronic myeloid leukemia patients. PLoS One. 2014;9(7):e101848. [DOI] [PMC free article] [PubMed] [Google Scholar]
- 41.Chen CI, Koschmieder S, Kerstiens L, et al. NK cells are dysfunctional in human chronic myelogenous leukemia before and on imatinib treatment and in BCR-ABL-positive mice. Leukemia. 2012;26(3):465-474. [DOI] [PubMed] [Google Scholar]
- 42.Irani YD, Hughes A, Clarson J, et al. Successful treatment-free remission in chronic myeloid leukaemia and its association with reduced immune suppressors and increased natural killer cells. Br J Haematol. 2020;191(3):433-441. [DOI] [PubMed] [Google Scholar]
- 43.Ilander M, Olsson-Stromberg U, Schlums H, et al. Increased proportion of mature NK cells is associated with successful imatinib discontinuation in chronic myeloid leukemia. Leukemia. 2017;31(5):1108-1116. [DOI] [PMC free article] [PubMed] [Google Scholar]
- 44.Rea D, Henry G, Khaznadar Z, et al. Natural killer-cell counts are associated with molecular relapse-free survival after imatinib discontinuation in chronic myeloid leukemia: the IMMUNOSTIM study. Haematologica. 2017;102(8):1368-1377. [DOI] [PMC free article] [PubMed] [Google Scholar]
- 45.Arora R, Press RD. Measurement of BCR-ABL1 transcripts on the International Scale in the United States: current status and best practices. Leuk Lymphoma. 2017;58(1):8-16. [DOI] [PubMed] [Google Scholar]
Associated Data
This section collects any data citations, data availability statements, or supplementary materials included in this article.


