Abstract
Changes in renal cellular metabolism and their contributions to human kidney disease are not well understood. Here, we show that NAD+ deficiency drives cisplatin-induced mitochondrial dysfunction and inflammation in the kidney. Using unbiased global metabolomics in healthy and diseased human kidneys, we identify nicotinamide adenine dinucleotide (NAD+) deficiency as a signature of disease. Cisplatin- or ischemia reperfusion-induced kidney injury models NAD+ depletion in male mice, and supplemental nicotinamide riboside or nicotinamide mononucleotide restores NAD+ levels and improves kidney function. We find that cisplatin causes cytosolic leakage of mitochondrial RNA (mtRNA) and activation of the cytosolic pattern recognition receptor retinoic acid-inducible gene I (RIG-I), both of which can be ameliorated by restoring NAD+. Male mice with RIG-I knock-out are protected from cisplatin-induced kidney disease. In summary, we demonstrate that the cytosolic release of mtRNA and RIG-I activation is an NAD+-sensitive mechanism contributing to kidney disease.
Introduction
Genome- and transcriptome-wide association studies have found an enrichment for expression of genes causing kidney disease in proximal tubule cells1, 2, 3. Tubule cells reabsorb essential substrates filtered from the blood and excrete waste and toxins into urine, a process that energetically intensive requiring high mitochondrial density4. As a result, kidney tubule cells are very sensitive to hypoxia- or toxin-induced injuries. Genes associated with disease risk are enriched for metabolic processes such as fatty acid oxidation and oxidative phosphorylation, suggesting that dysregulated renal tubule metabolism plays a causal role in the development of kidney disease.
Dysregulated NAD+ homeostasis has been described in humans5 and multiple animal models6, 7. Interestingly, several studies in mice have demonstrated a protective role for NAD+ precursor supplementation. Nicotinamide (NAM), nicotinamide riboside (NR), and nicotinamide mononucleotide (NMN) have been shown to protect rodents against kidney injuries8, 9, 10, 11, 12, 13. The NAD+ status and the effects of precursor supplementation are less clear in humans compared to mice, but recent data is promising. Kidney injury was reduced by NAM supplementation in patients undergoing heart surgery14 and COVID-19-related AKI15. NR treatment increased blood NAD+ levels in hospitalized patients with AKI16. Although multiple NAD+ precursors showed a protective effect on kidney disease, differences in bioavailability or effectiveness are not well understood. NMN and NR exhibit tissue- or cell- dependent pharmacokinetics and metabolic fate17, but they have rarely been compared directly, and not at all in the context of kidney injury. Moreover the downstream consequences of changing NAD+ availability remain unclear. Several mechanisms by which NAD+ supplementation might protect the kidney in rodent models have been proposed8, 18. However, comprehensive, unbiased analysis of NAD+ metabolism in human kidney disease is lacking.
Mitochondrial dysfunction plays a multifaceted role in the development of kidney disease. At late disease stages, the lack of cellular ATP might lead to cellular dedifferentiation and cell death. Single cell gene expression analysis highlighted that even at early disease stages some proximal tubules take on an injured pro-inflammatory phenotype and are likely the nidus for fibroinflammation19. It was recently discovered that the cytosolic leakage of mtRNA through the BAX pore can activate the retinoic acid-inducible gene I (RIG-I)-like receptors (RLRs)-mitochondrial antiviral-signaling protein (MAVS) cytosolic RNA sensing pathway20, 21. mtRNA binds to RIG-I (encoded by DDX58)20, or melanoma differentiation-associated protein 5 (MDA5, encoded by IFIH1)21. Some of these observations suggest that mtRNA plays a more important role in inducing inflammation than does mtDNA20. However, the role of mtRNA in renal tubule cells has not been examined.
To address these questions, we performed unbiased metabolomic studies using a mouse kidney disease model and kidneys of patients with kidney disease. Our findings revealed consistent changes in NAD+ metabolism. We also conducted mechanistic experiments to understand how NAD+ metabolism interacts with mitochondria dysfunction, cytosolic mtRNA leakage, and activation of the RIG-I cytosolic RNA sensing pathway in renal tubules. Our studies suggest that RIG-I dependent inflammation is an underappreciated consequence of renal NAD+ depletion that plays a role in human kidney disease.
Results
Altered NAD+ metabolism is prominent in diseased human kidneys.
We collected human kidney samples from healthy controls (n=25) and patients with diabetic/hypertensive kidney disease, defined as estimated glomerular filtration rate (eGFR) less than 60 mL/min/1.73 m2 and kidney fibrosis (n=25) (Fig. 1A). The mean eGFR values were 95 mL/min/1.73 m2 (healthy control) and 32 mL/min/1.73 m2 (kidney disease), respectively (p < 0.001). The demographics and clinical characteristics of the donors including eGFR, age, gender, and presence of diabetes and/or hypertension are shown in Supplementary Table 1 and 2. Using untargeted metabolomics, we identified 869 metabolites in kidney cortex lysates. Among them, 153 metabolites showed a significant (p < 0.05) difference (55 higher, 98 lower) in diseased kidneys (Fig. 1B, Supplementary Table 3). Elevated metabolites included urate, and creatinine, well-known markers of kidney dysfunction. Next, we evaluated changes using pathway-based enrichment in MetaboAnalyst (v5.0). We observed changes in nicotinate and nicotinamide, pyrimidine metabolism, glycerophospholipid metabolism, and histidine metabolism (Fig. 1C).
Figure 1. Integrated metabolomics and transcriptomics data analysis of human kidney samples.
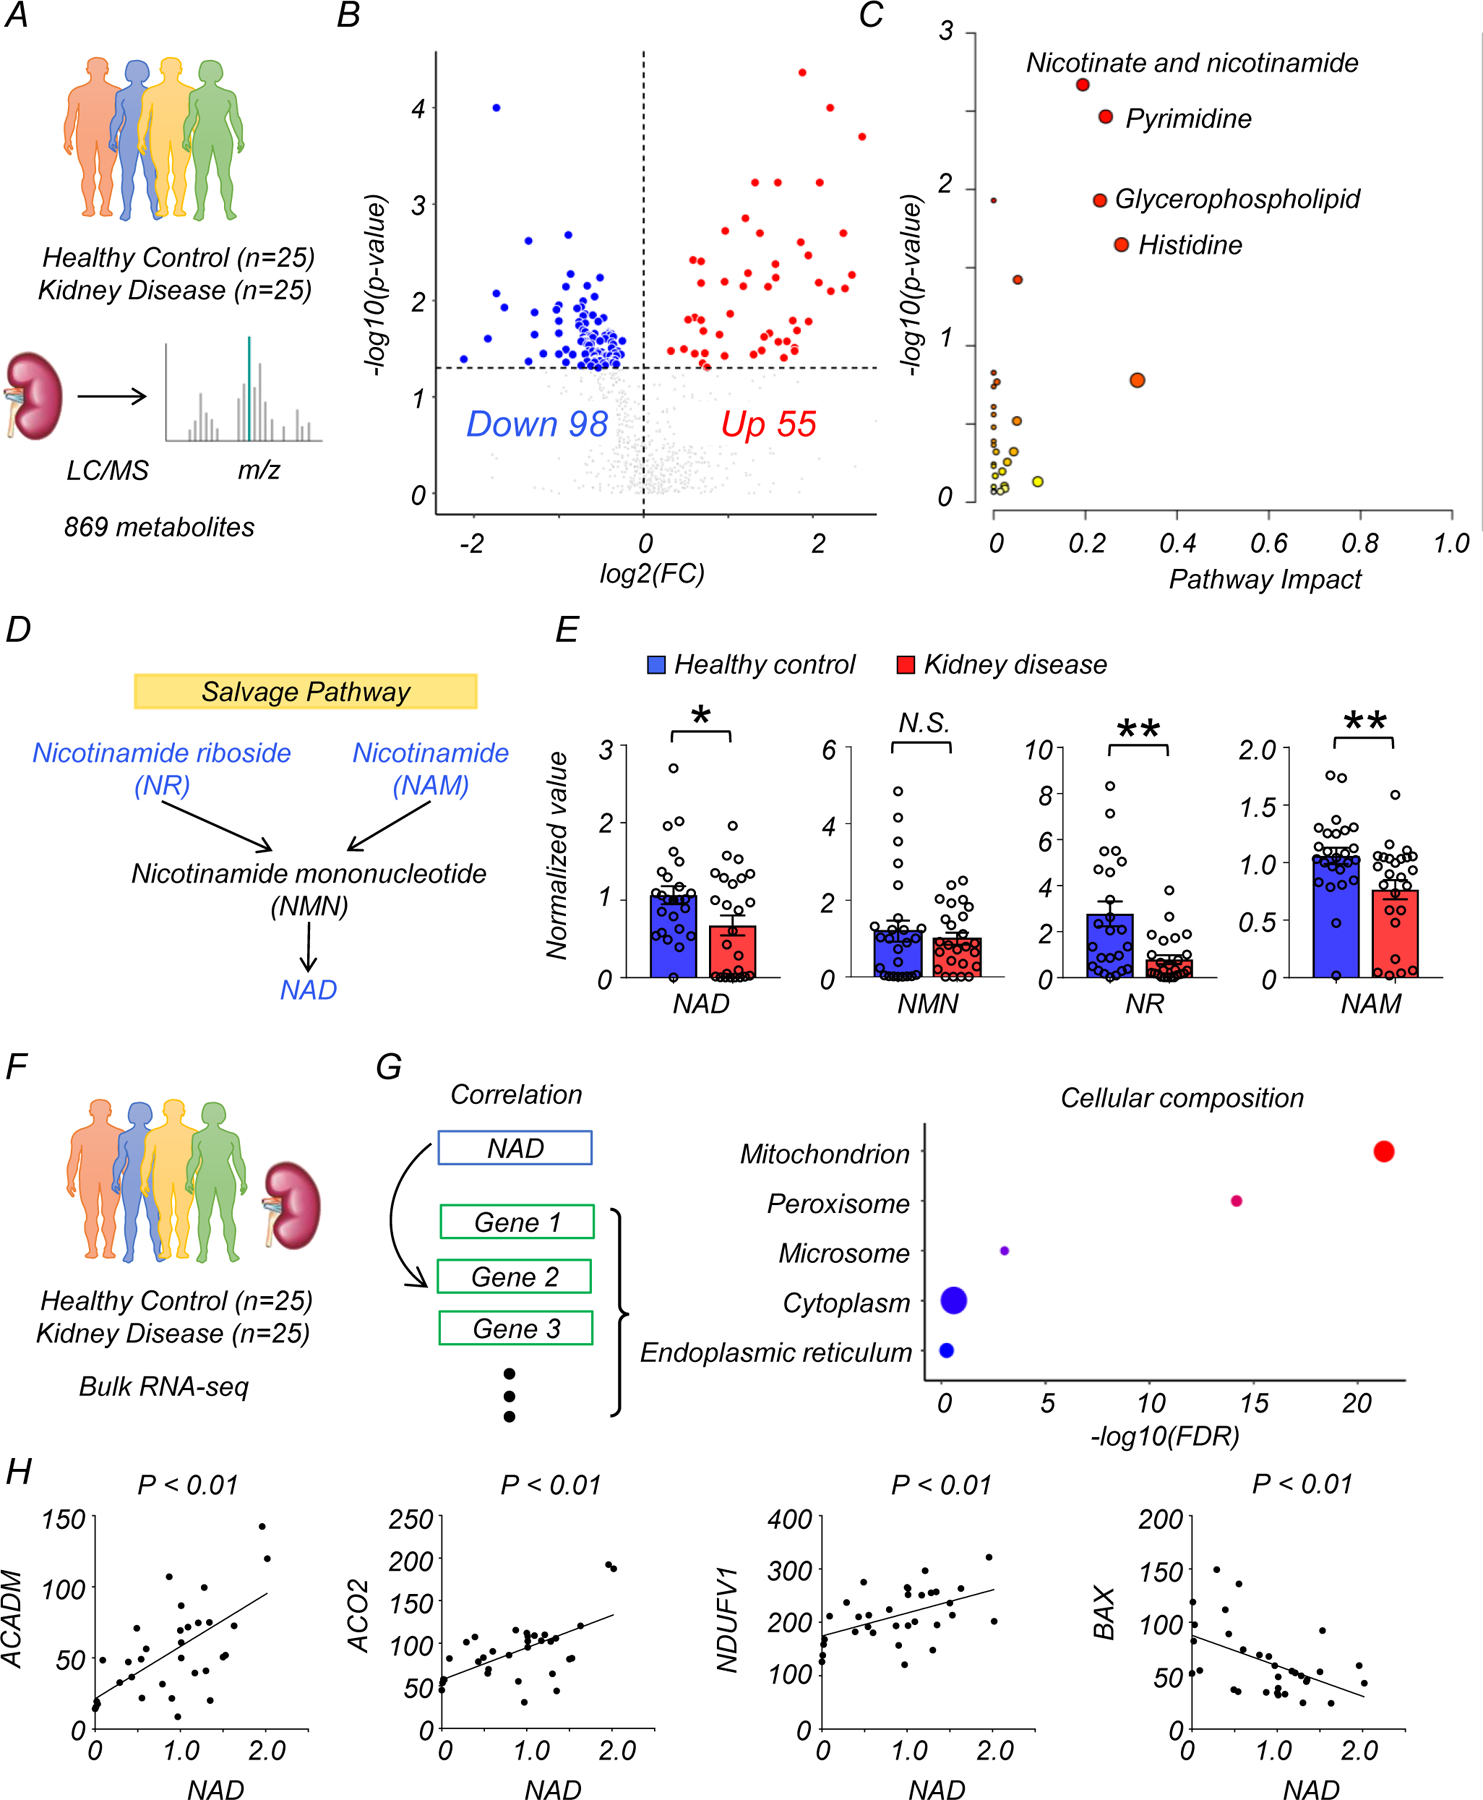
(A) Total of 50 human kidney samples were collected for metabolomics analysis; including healthy controls (n=25) and patients with kidney disease (n=25).
(B) Volcano plot of metabolites showing significant changes in human diseased kidneys. x-axis: log2 fold change (log2FC). Y-axis: -log10(p-value). Color indicates metabolites significantly higher (red) or lower (blue) in human diseased kidneys. Welch’s two-sided t-test was used to calculate p-value.
(C) Metabolic pathways showing significant changes in diseased kidneys. The dot color indicates the level of significance, the dot size indicates pathway impact. p-value was calculated from the enrichment analysis in Metaboanalyst.
(D) The simplified NAD salvage pathway. Blue indicates metabolites significantly lower in human diseased kidneys.
(E) The levels of NAD+, NMN, NR, and NAM in human kidneys (Healthy control n=25. Kidney disease n=25). * p<0.05. N.S. not significant. Data are presented as mean ± s.e.m. and were analyzed using Welch’s two-sided t-test.
(F) The bulk RNA-seq of same human kidney samples used for metabolomic studies.
(G) Gene ontology analysis of cellular composition of genes significantly correlating with kidney NAD+ levels. The dot color and size indicate significance and gene counts, respectively.
(H) The correlation between kidney NAD+ levels (x-axis) and relative genes expression (y-axis) encoding mitochondrial proteins. P-value was calculated using Pearson’s correlation.
We focused on metabolites associated with nicotinate and nicotinamide metabolism because this pathway had the highest enrichment and it was previously implicated in multiple diseases7, 8. Levels of NAD+, nicotinamide riboside (NR), and nicotinamide (NAM) were lower in diseased kidneys, while nicotinamide mononucleotide (NMN) was not significantly changed (Fig. 1D, E). Analysis of metabolites specifically related to the de novo NAD+ synthesis pathway revealed that the levels of quinolinate were higher in diseased kidneys, with no significant changes in tryptophan and kynurenine (Extended Data Fig. 1A, B). Although the average age of diseased patients was higher than that of controls, the difference in NAD+ metabolism remained significant (p<0.05) after downsampling to age-matched groups (Extended Data Fig. 2A, B).
To explore the underlying disease mechanisms, we performed RNA-sequencing on kidney tissue from the same samples (Fig. 1F, G). Expression of most genes involved in NAD+ metabolism was not consistently changed in diseased kidneys (Extended Data Fig. 1D). We next analyzed genes whose expression levels correlated with tissue NAD+ concentration. Gene ontology (GO) analysis showed enrichment for mitochondria (Fig. 1G, Supplementary Table 4). Consistently, a significant correlation with kidney NAD+ levels was observed for genes encoding mitochondrial proteins and related to mitochondrial function such as acyl-CoA dehydrogenase medium-chain (ACADM) (fatty acid oxidation), aconitase 2 (ACO2) (oxidative phosphorylation), NADH: ubiquinone oxidoreductase core subunit V1 (NDUFV1) (respiration), and BCL2 associated X, apoptosis regulator (BAX) (apoptosis) (Fig 1H).
Collectively, untargeted metabolomics and transcriptomics identified lower NAD+ levels as a key feature of human kidney disease and demonstrated a correlation between NAD+ levels and mitochondrial gene expression.
Disturbed NAD+ metabolism in injured mouse kidneys.
Because decreases in NAD+ were previously reported in the kidneys of mice treated with cisplatin, we next tested whether this model could broadly mimic the metabolic changes in human kidney disease. We performed untargeted metabolomics on kidneys of wild-type (WT) mice injected with cisplatin. Kidney samples were collected 3 days after injection with PBS (n=4) or cisplatin (n=4). Untargeted metabolomics analysis detected 984 metabolites in kidney tissue lysates. Cisplatin injection was associated with changes in the levels of 687 metabolites (p < 0.05, 398 were higher, and 289 were lower) (Fig. 2A, B, and Supplementary Table 5). Although change in arginine and pantothenate metabolism were more prominent in mice than in humans, consistent changes were observed in the nicotinate and nicotinamide pathway (Fig. 2C). Kidney NAD+ levels were dramatically lower in mice injected with cisplatin (Fig. 2D). Further mapping of the metabolites onto the NAD+ salvage pathway showed lower levels of NR, NMN, and NAM as well (Fig. 2D, E). Among metabolites in the de novo NAD+ synthesis pathway, we observed higher levels of kynurenine and quinolinate, along with lower levels of tryptophan in kidneys of mice with cisplatin injection (Extended Data Fig. 1C). Overall, changes in NAD+ metabolism in injured kidneys were conserved between humans and mice.
Figure 2. Integrated metabolomics and transcriptomics data analysis of mouse kidney disease samples.
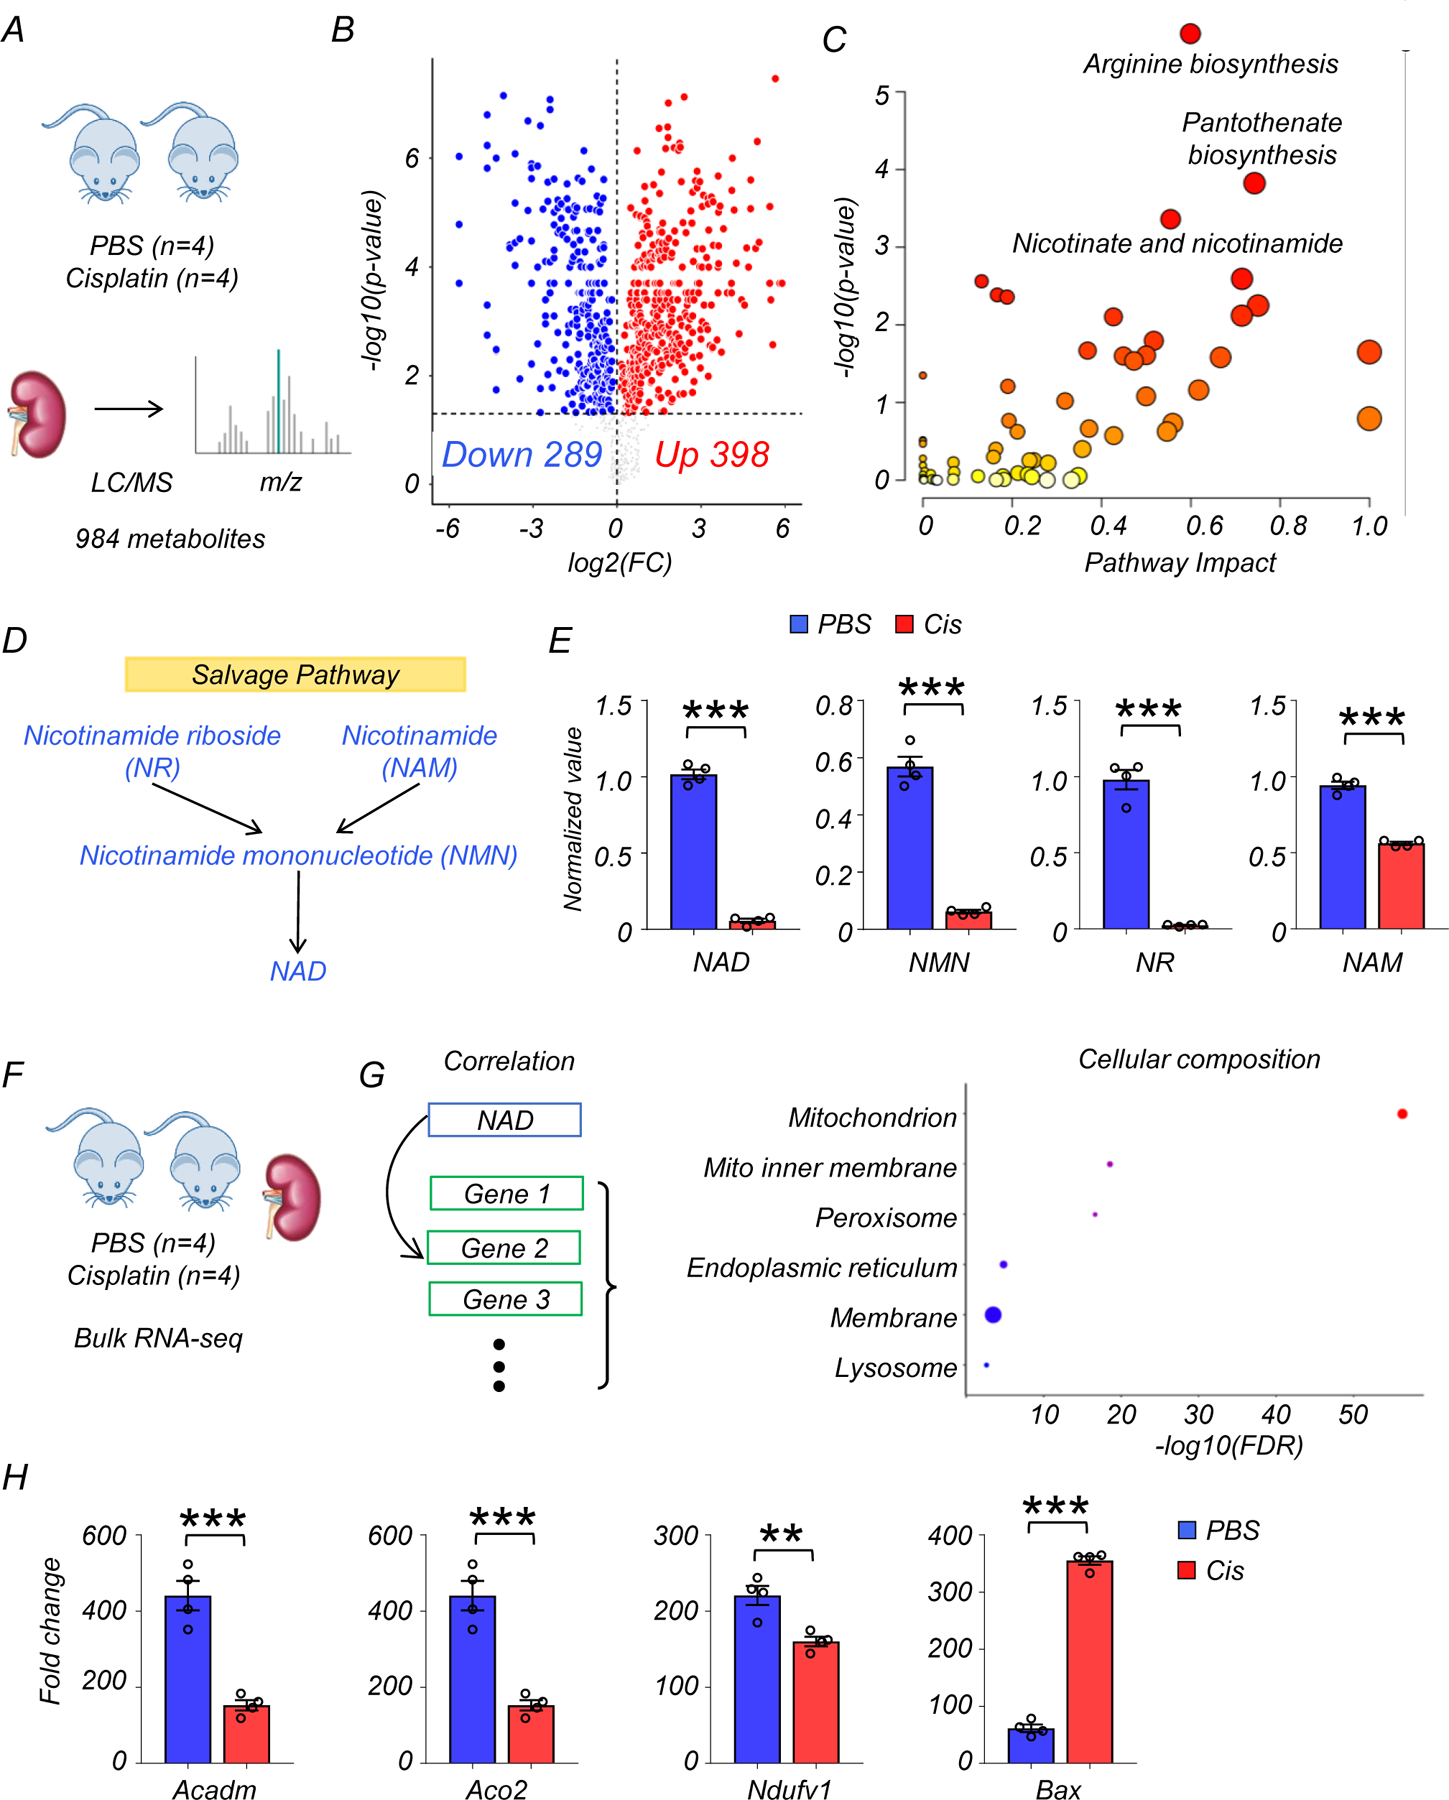
(A) Experimental set-up to collect sham (PBS, n=4) or cisplatin (n=4)-injected kidneys.
(B) Volcano plot showing significantly changed metabolites in the kidneys of mice. x-axis: log2 fold change (log2FC). Y-axis: -log10(p-value). Color indicates metabolites significantly higher (red) or lower (blue) in cisplatin-injected kidneys. Welch’s two-sided t-test was used to calculate p-value.
(C) Metabolic pathways showing significant changes in diseased kidneys. The dot color indicates significance, the dot size indicates pathway impact. p-value was calculated from the enrichment analysis in Metaboanalyst.
(D) The salvage pathway of NAD+ biosynthesis. Blue indicates the metabolites significantly lower in the kidneys of mice injected with cisplatin.
(E) The levels of NAD+, NMN, NR, and NAM in the kidneys of mice (PBS n=4. Cis n=4). *** p<0.001. Data are presented as mean ± s.e.m. and were analyzed using Welch’s two-sided t-test.
(F) The bulk RNA-seq of same mice kidney samples used for metabolomics analysis.
(G) Gene ontology analysis of cellular composition of genes significantly correlated with kidney NAD+ levels. The dot color and size indicate significance and gene counts, respectively.
(H) The levels of Acadm, Aco2, Ndufv1, and Bax in kidneys of mice (PBS n=4. Cis n=4). ***p<0.001. Data are presented as mean ± s.e.m. and were analyzed using a two-tailed Student’s t-test.
To explore the association of kidney NAD+ levels with gene expression changes in murine kidney injury, we performed RNA-sequencing from the same kidney samples (Fig. 2F, G). The expression of genes involved in de novo NAD+ synthesis, but not salvage pathway, were markedly lower in kidneys of mice receiving cisplatin injection, consistent with prior reports in injured kidneys14. In contrast, the mRNA expression of genes encoding many of the PARP family members, which consume NAD+, was higher in kidneys of mice after cisplatin injection (Extended Data Fig 1E). Similar to the human data, GO analysis showed that genes whose expression levels correlated with kidney NAD+ concentration were enriched for the mitochondrial compartment (Fig. 2G, Supplementary Table 6). In line with the human kidney data, the levels of transcripts for Acadm, Aco2, Ndufv1 were lower, and Bax were higher in the kidney of cisplatin-treated mice, suggesting an association between disturbed NAD+ metabolism and mitochondria dysfunction (Fig. 2H).
In short, integrated analysis of mouse kidney transcriptomics and metabolomics confirmed consistent changes in NAD+ metabolism and associated gene expression signatures in injured mouse and human kidneys.
NAD+ precursor treatment protects mice from kidney dysfunction after cisplatin injection.
As we observed a markedly impaired NAD+ metabolism in the kidneys of patients and cisplatin-injected mice, we tested whether NAD+ precursors (NMN or NR) would protect mice from injury. We injected mice with 500mg/kg NMN intraperitoneally for 4 consecutive days as described previousely22 or 435mg/kg NR (molar equivalent). Control mice were injected with equal volume of vehicle (PBS). To reduce heterogeneity, we only analyzed male mice in this study. The first doses of NMN and NR were given 2 hours before cisplatin injection, and kidneys or serum samples were collected 3 days later from each experimental group (PBS; n=4, Cisplatin; n=8, Cisplatin with NMN; n=8, Cisplatin with NR; n=8) (Fig. 3A). Consistent with our metabolomics analysis, NAD+ levels were lower in kidneys of mice with cisplatin injection (Fig. 3B). NMN or NR supplementation normalized kidney NAD+ levels equivalently (Fig. 3B). Semi-quantitative evaluation of kidney pathological specimens showed severe tubular injury represented by tubule dilation or atrophy, cast formation, and epithelial cell degeneration or detachment in mice injected with cisplatin. These changes were markedly attenuated to a comparable degree in mice supplemented with NMN or NR (Fig. 3C). Serum creatinine and BUN levels were elevated after cisplatin injection, and were markedly reduced in mice supplemented with NMN or NR (Fig. 3D). Transcript levels of renal tubular injury markers, Lcn2 (Lipocalin) and Havcr1 (encoding KIM-1) were higher in cisplatin kidneys and reduced after NMN or NR supplementation (Fig. 3E).
Figure 3. NAD+ precursors (NMN, NR) supplementation protected from kidney dysfunction, tubular injury, and apoptosis induced by cisplatin.
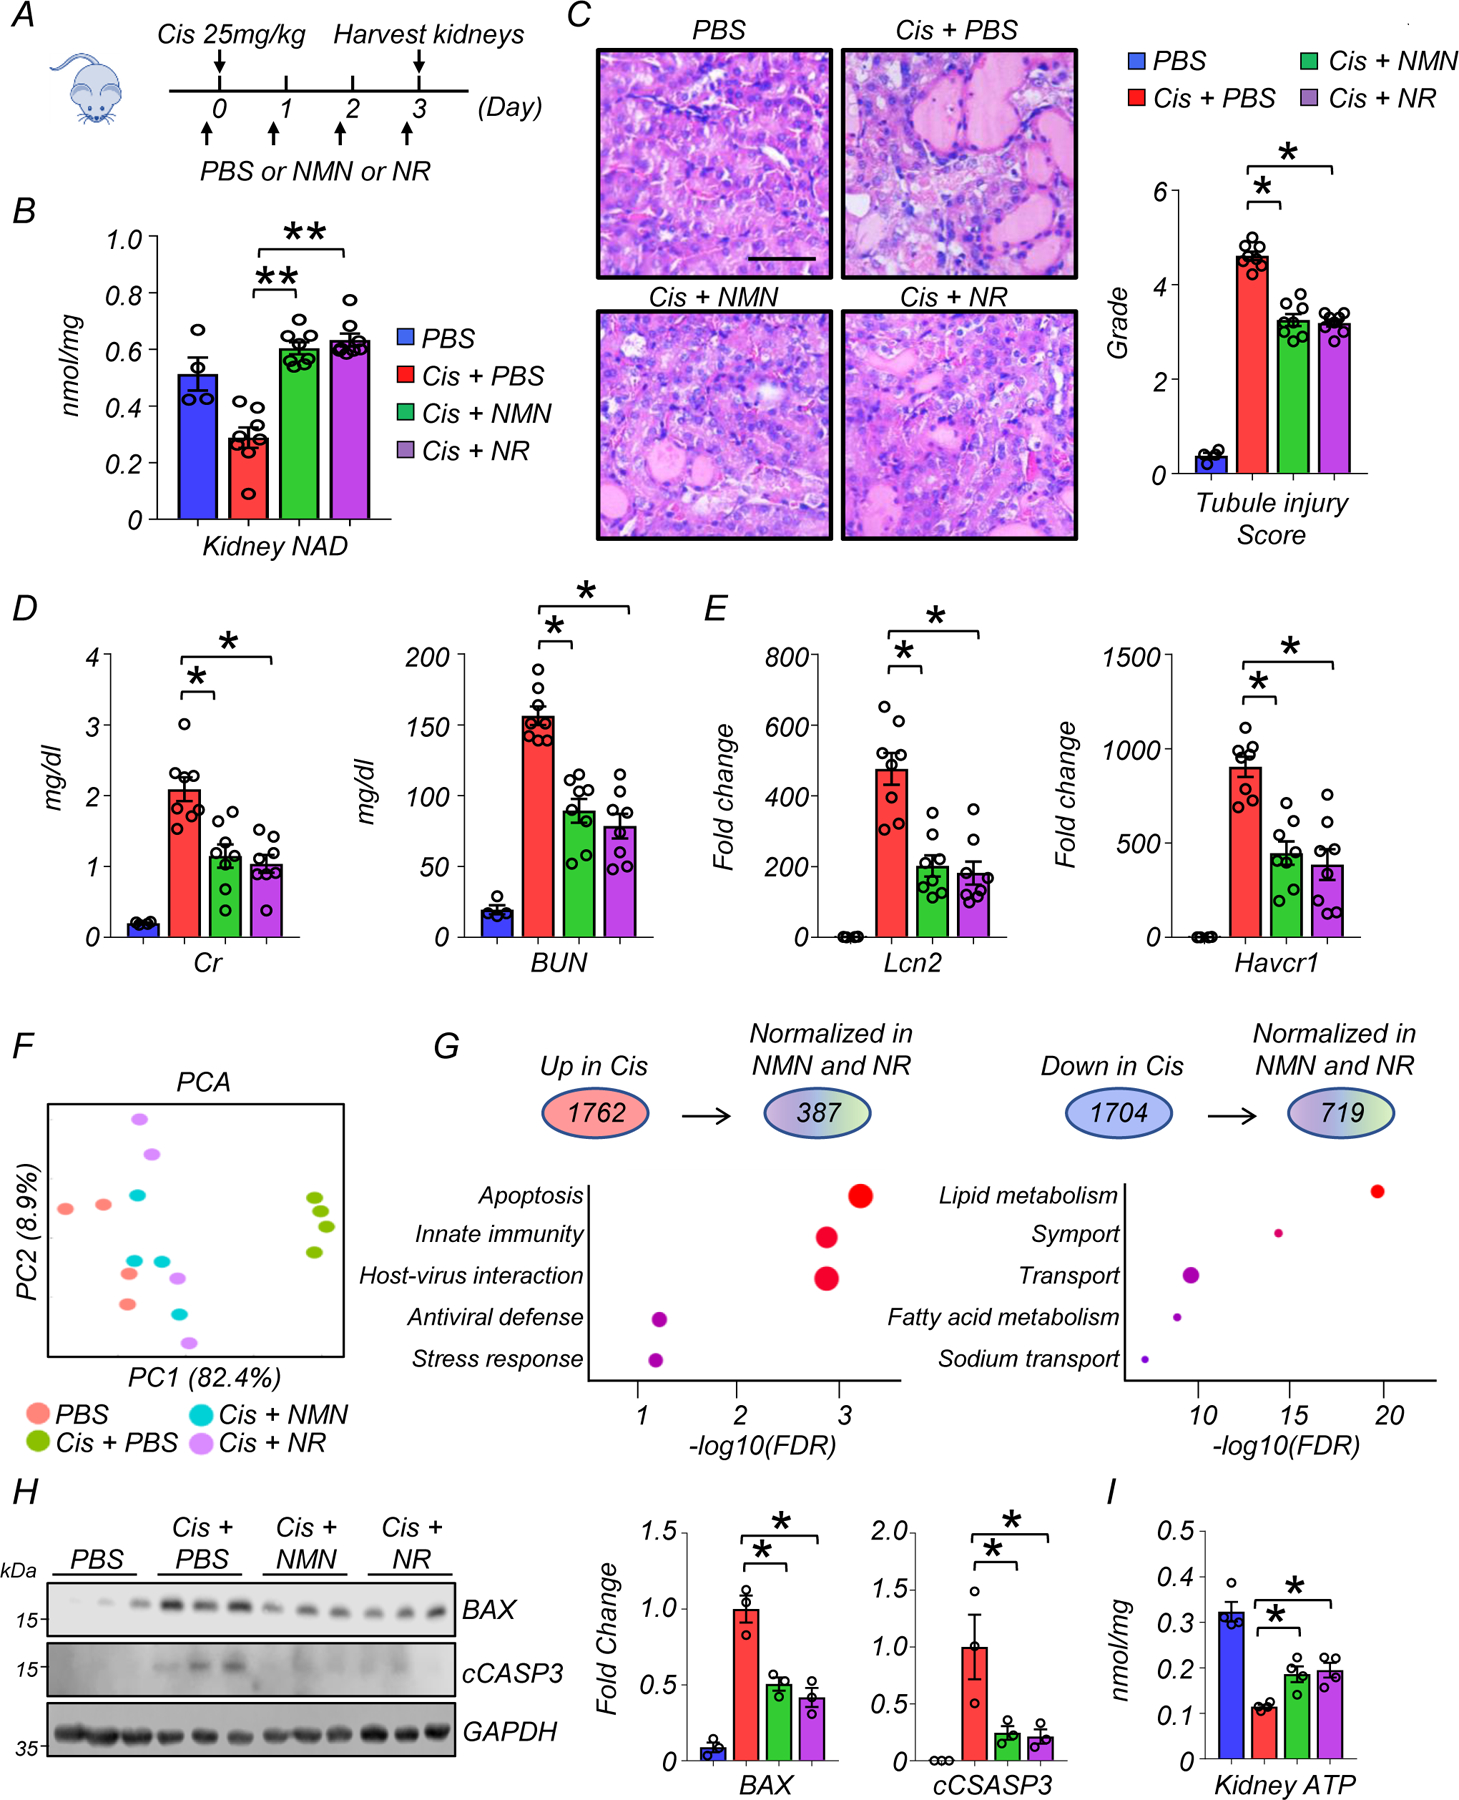
(A) The experiment designs. NAD+ precursors (NMN or NR) and vehicle control (PBS) were injected i.p. for 4 consecutive days. First dose was injected 2 hours before cisplatin injection (25mg/kg). Kidneys were collected 3 days after cisplatin injection.
(B) Kidney NAD+ levels in experimental groups. ** p<0.01.
(C) Representative images of hematoxylin and eosin staining and semi-quantitative analysis for tubule injury in experimental groups. Scale bars: 20 μm. *p<0.05.
(D) Serum creatinine and blood urea nitrogen (BUN) levels in experimental groups. *p<0.05.
(E) Relative expression levels of Lcn2 and Havcr1 in the kidneys of mice in experimental groups. *p<0.05.
(F) PCA analysis of RNA-seq in experimental groups.
(G) (Upper panel) The number of genes significantly higher or lower in kidneys of mice injected with cisplatin. The number of genes normalized by both NAD+ precursors (NMN and NR). (Lower panel) Corresponding GO analysis of normalized genes.
(H) Western blot image and quantification of BAX, cleaved caspase-3 (cCASP3) in experimental groups. The protein expression was normalized using GAPDH (n=3 in each group). *p<0.05.
(I) Quantification of kidney ATP levels in experimental groups. The values were normalized using total protein levels (n=4 in each group). *p<0.05.
(B-E) (PBS n=4. Cis + PBS n=8. Cis + NMN n=8. Cis + NR n=8). Data are presented as mean ± s.e.m. and were analyzed using a one-way ANOVA followed by Tukey post hoc test for multigroup comparison.
Next, we sought to explore the underlying molecular mechanisms or biological pathways influenced by NAD+ precursor supplementation. We performed bulk RNA-sequencing of kidneys (n=4 in each experimental group). PCA analysis showed a clear difference between groups treated with cisplatin or sham, while NMN or NR supplementation groups were more similar to the sham group (Fig. 3F). Cisplatin injection was associated with significantly higher expression of 1762 genes and lower expression of 1704 genes in kidneys when compared to sham injection (adjusted p < 0.05, Fig. 3G). A significant fraction (compared to random chance) returned to baseline following NMN or NR supplementation (adjusted p < 0.05, 387 out of 1762 higher expressed genes, 719 genes out of 1704 lower expressed genes). Genes normalized by NMN and NR supplementation showed enrichment for apoptosis, innate immunity, and lipid metabolism (Fig. 3G, Supplementary Table 7 and 8). GO analysis for cellular localization indicated enrichment for mitochondria (Supplementary Fig. 1A). Consistently, the expression levels of proteins associated with intrinsic (mitochondrial) apoptosis such as BAX and cleaved caspase-3 were higher in kidneys after cisplatin injection, and their levels were reduced in NMN- or NR-treated mice (Fig. 3H). PGC1a (encoded by Ppargc1a) is a transcriptional coactivator that plays a dominant role in mitochondrial biogenesis and has been shown to induce NAD+ biosynthesis via the de novo pathway8. NMN and NR supplementation normalized levels of Ppargc1a (Supplementary Fig. 1B). Kidney ATP levels were lower in all mice receiving cisplatin injection, but remained somewhat higher in mice that received NMN or NR treatment (Fig. 3G).
In summary, our results demonstrated a similar protective effect of NMN and NR on kidney function, tubule injury, tubule apoptosis, and energy deficiency after cisplatin injection, while highlighting a potential role for mitochondrial pathways.
NAD+ precursor supplementation attenuated the expression of genes associated with cytosolic RNA sensing and modulated immune cell infiltration in kidneys after cisplatin injection.
Inflammation plays an important role in kidney disease pathogenesis23. Gene ontology analysis showed that genes modulated by NAD+ replenishment were highly enriched for innate immunity and host-virus interactions (Fig. 3G). We observed that kidneys of mice with treated with cisplatin had higher expression of genes involved in cytosolic RNA sensing (Ddx58, Oas1a, Oas1b, Oas1g, Oasl1, Oasl2), and downstream interferon or nuclear factor-kB (NF-kB) signaling (Bst2, Cxcl10, Cxcl16, Ifit3, ifitm3, Irf7, Isg15, Isg20). The expression of these genes returned to baseline in mice treated with NMN or NR (Fig. 4A). Compared to its effect on Ddx58, cisplatin had only a modest effect on genes involved in cytosolic DNA sensing (cGAS, Aim2, Tlr9, Zbp1) (Extended Data Fig 3A). The changes in the transcript levels of Ddx58, Isg15, Irf7, and Ifitm3 were validated by real-time quantitative polymerase chain reaction (qPCR) using different internal controls (Gapdh, Actb) (Extended Data Fig. 3B). Consistently, protein expression levels of RIG-I (encoded by Ddx58) were higher in kidneys with cisplatin injection, while NMN or NR treatment reduced RIG-I expression levels (Fig. 4B, and 4C). The monomer form of MAVS did not show significant differences, however, MAVS aggregation was prominent in cisplatin-treated mice and NMN or NR supplementation alleviated this aggregation (Fig. 4B, and 4C). Because bulk RNA-seq cannot distinguish cell-type specific changes, we next isolated renal tubule cells from WT mice and incubated them with cisplatin in the presence or absence NAD+ precursors. Cultured renal tubule cells treated with cisplatin overnight at 10µM exhibited higher transcript expression of Ddx58, Isg15, Irf7, and Ifitm3, which was partially prevented by NMN or NR supplementation (400µM) (Fig. 4D). To further confirm the involvement of renal tubule cells in vivo, we employed in situ hybridization for Isg15 in mouse kidneys, demonstrating higher expression in cisplatin-treated mice that was lowered by NMN or NR supplementation (Fig. 4E).
Figure 4. NAD+ precursor (NMN, NR) supplementation protected from cytosolic RNA sensing pathway activation.
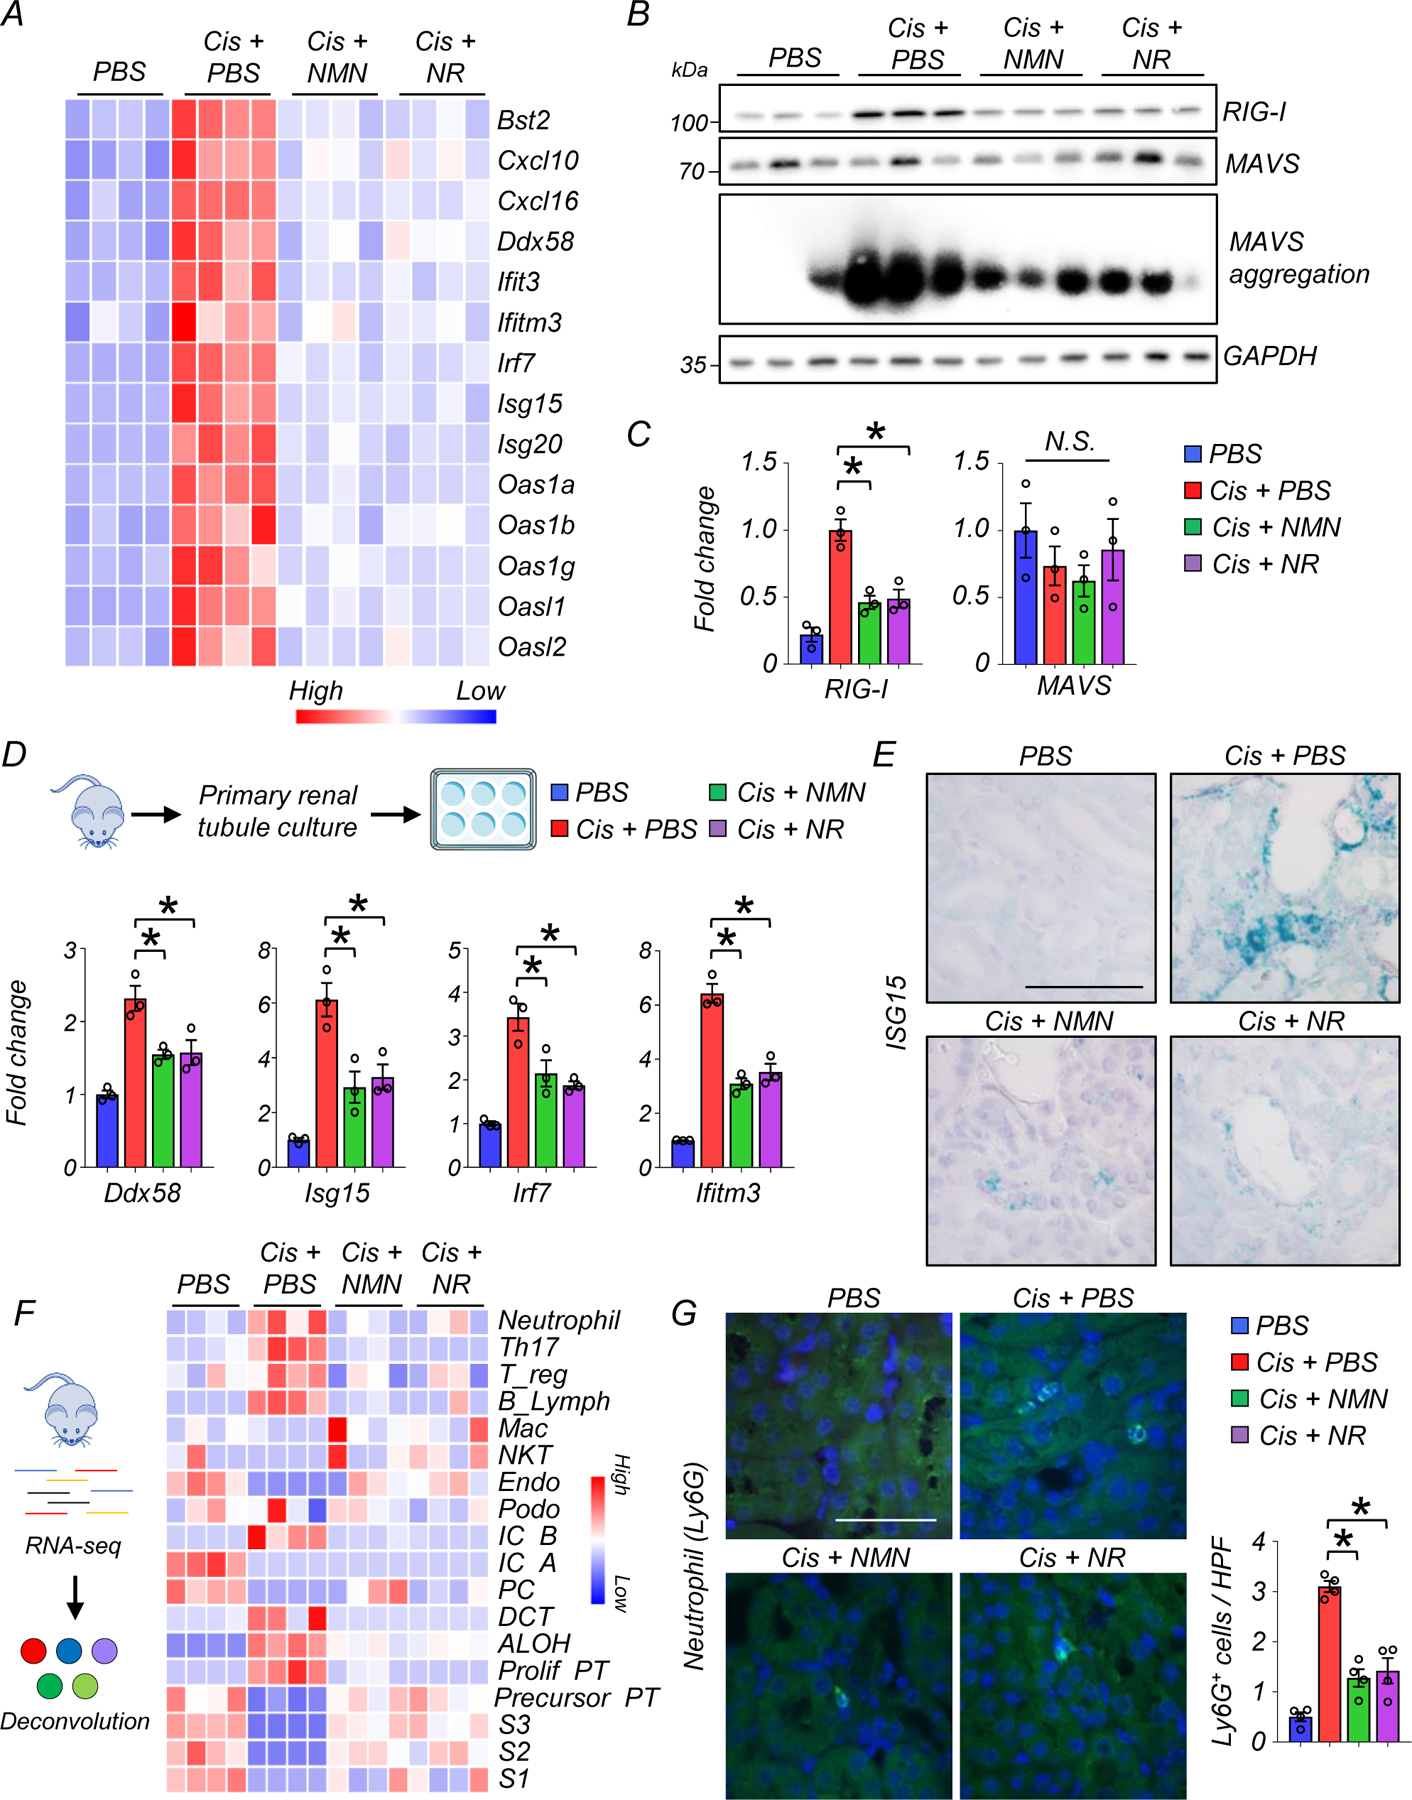
(A) Heatmap showing genes associated with cytosolic RNA sensing and downstream interferon stimulated genes (ISG) in experimental groups.
(B) Western blot image and quantification of RIG-I, MAVS, and SDD-PAGE image of MAVS aggregation in the kidneys of mice in experimental groups. *p<0.05.
(C) Quantification of RIG-I and MAVS in the kidneys of experimental groups (n=3 in each group). *p<0.05.
(D) (Upper panel) Kidney tubule cell culture from WT mice. (Lower panel) Relative transcript levels of Ddx58, Isg15, Irf7 and Ifitm3 in experimental groups (n=3 in each group). *p<0.05.
(E) The representative in situ hybridization image of Isg15 in kidneys of mice in experimental groups. 2 experiments were repeated independently. Scale bars: 20 μm.
(F) (Left) In silico cellular deconvolution analyses for the kidneys of mice in experimental groups. (Right) Each row represents cell type. Color indicates higher (red) or lower (blue) values. Mac; Macrophage, NKT; natural killer T cells, Endo; endothelial, IC; intercalated cell, PC; principal cell, DCT; distal convoluted tubule, ALOH; ascending loop of Henle, PT; proximal tubule.
(G) Representative image and quantification of neutrophil (Ly6g) staining in the kidneys of mice in experimental groups (n=4 in each group). Scale bars: 20 μm. HPF: high power field. *p<0.05.
Data are presented as mean ± s.e.m. and were analyzed using a one-way ANOVA followed by Tukey post hoc test for multigroup comparison. Gene or protein expression levels were normalized using Gapdh.
Recent single-cell analyses of mouse renal disease models indicated that expression of inflammatory cytokines by kidney tubule cells could play an important role in attracting immune cells and establishing fibroinflammation19, 24. To estimate changes in kidney immune cell populations, we employed an in-silico deconvolution analysis using bulk gene expression and single cell gene marker data (Fig. 4F)3. Among the immune cell fraction, neutrophils, Th17, Treg, and B cells were higher in kidneys after cisplatin injection, and NMN or NR supplementation reduced their numbers (Fig. 4F, Supplementary Table 9). Deconvolution analysis also showed a lower number of proximal tubule cells (including every segment; S1, S2, S3) after cisplatin treatment, which was prevented by NMN or NR (Fig. 4F). Changes in neutrophils inferred from deconvolution analysis were validated using immunofluorescent staining of Ly6g, a surface marker of neutrophils25. Ly6G positive cells were higher in kidneys injected with cisplatin, and their numbers were lower after NMN or NR treatment (Fig. 4G).
Collectively, these results indicate that restoring kidney NAD+ levels attenuated the activation of cytosolic RNA sensing and downstream inflammatory pathways and reduced immune cell infiltration in the cisplatin-induced kidney injury model.
NAD+ precursor supplementation reduced RIG-I induction and kidney damage after ischemia reperfusion injury (IRI)
To test whether effects we had observed were specific to cisplatin injury or might reflect more general mechanisms of kidney injury, we next examined the effect of NAD+ precursor supplementation in a second kidney disease model induced by ischemia and reperfusion injury (IRI) (Extended Data Fig 4A). Kidney NAD+ levels were decreased by IRI, and NMN and NR supplementation similarly improved kidney NAD+ levels (Extended Data Fig 4B). Tubule cell degeneration, detachment, tubule lumen dilation, and cast formation were observed in kidneys of IRI mice. These changes were partially ameliorated by NMN and NR treatment (Extended Data Fig 4C). Consistently, NMN and NR supplementation improved kidney function and reduced tubule injury as indicated by lower levels of Cr, BUN, and expression of Lcn, and Havcr1 (Extended Data Fig 4D and 4E). As observed in the cisplatin model, the expression of Ddx58, Isg15, Irf7, ifitm3, Cxcl10, and Cxcl16 were higher in IRI mice. These changes were mitigated in NMN and NR treatment (Extended Data Fig 4F).
Collectively, NAD+ precursor supplementation protected mice from IRI-induced kidney injury and RIG-I induction, confirming that the therapeutic benefit of NMN and NR is not limited to cisplatin-induced kidney injury.
Cisplatin induced kidney injury leads to cytosolic leakage of mitochondrial RNA and activation of RIG-I
RIG-I (encoded by Ddx58) is a cytosolic RNA sensor. RIG-I is capable of detecting viral infection and activates the type 1 interferon pathway26. Activation of Ddx58 is also triggered by cytosolic mitochondria RNA (mtRNA) release20. To examine changes in cytosolic mtRNA in renal tubules in response to cisplatin, we isolated cytosolic fractions from renal tubule cells, and further extracted RNA by DNase treatment (Fig. 5A). Cytosolic fractions were free of any apparent nuclear or mitochondrial contamination as indicated by the presence of GAPDH and absence of HSP60 (mitochondria), TIMM44 (mitochondria), and H3 (nuclear) (Fig. 5B). Real-time qPCR for mitochondria-specific genes (Co2, Nd1) showed that transcript levels in the cytosolic fraction were higher following cisplatin treatment, and lower following NMN or NR supplementation, indicating the leakage of mtRNA to the cytosol triggered by cisplatin was blocked with NAD+ precursors in renal tubule cells. (Fig. 5C). RNAse treatment eliminated expression of Co2, Nd1, Nd6, and Rnr2, excluding of mtDNA contamination (Supplementary Fig. 2A).
Figure 5. Activation of RIG-I cytosolic RNA sensing pathway in response to cytosolic mtRNA leakage.
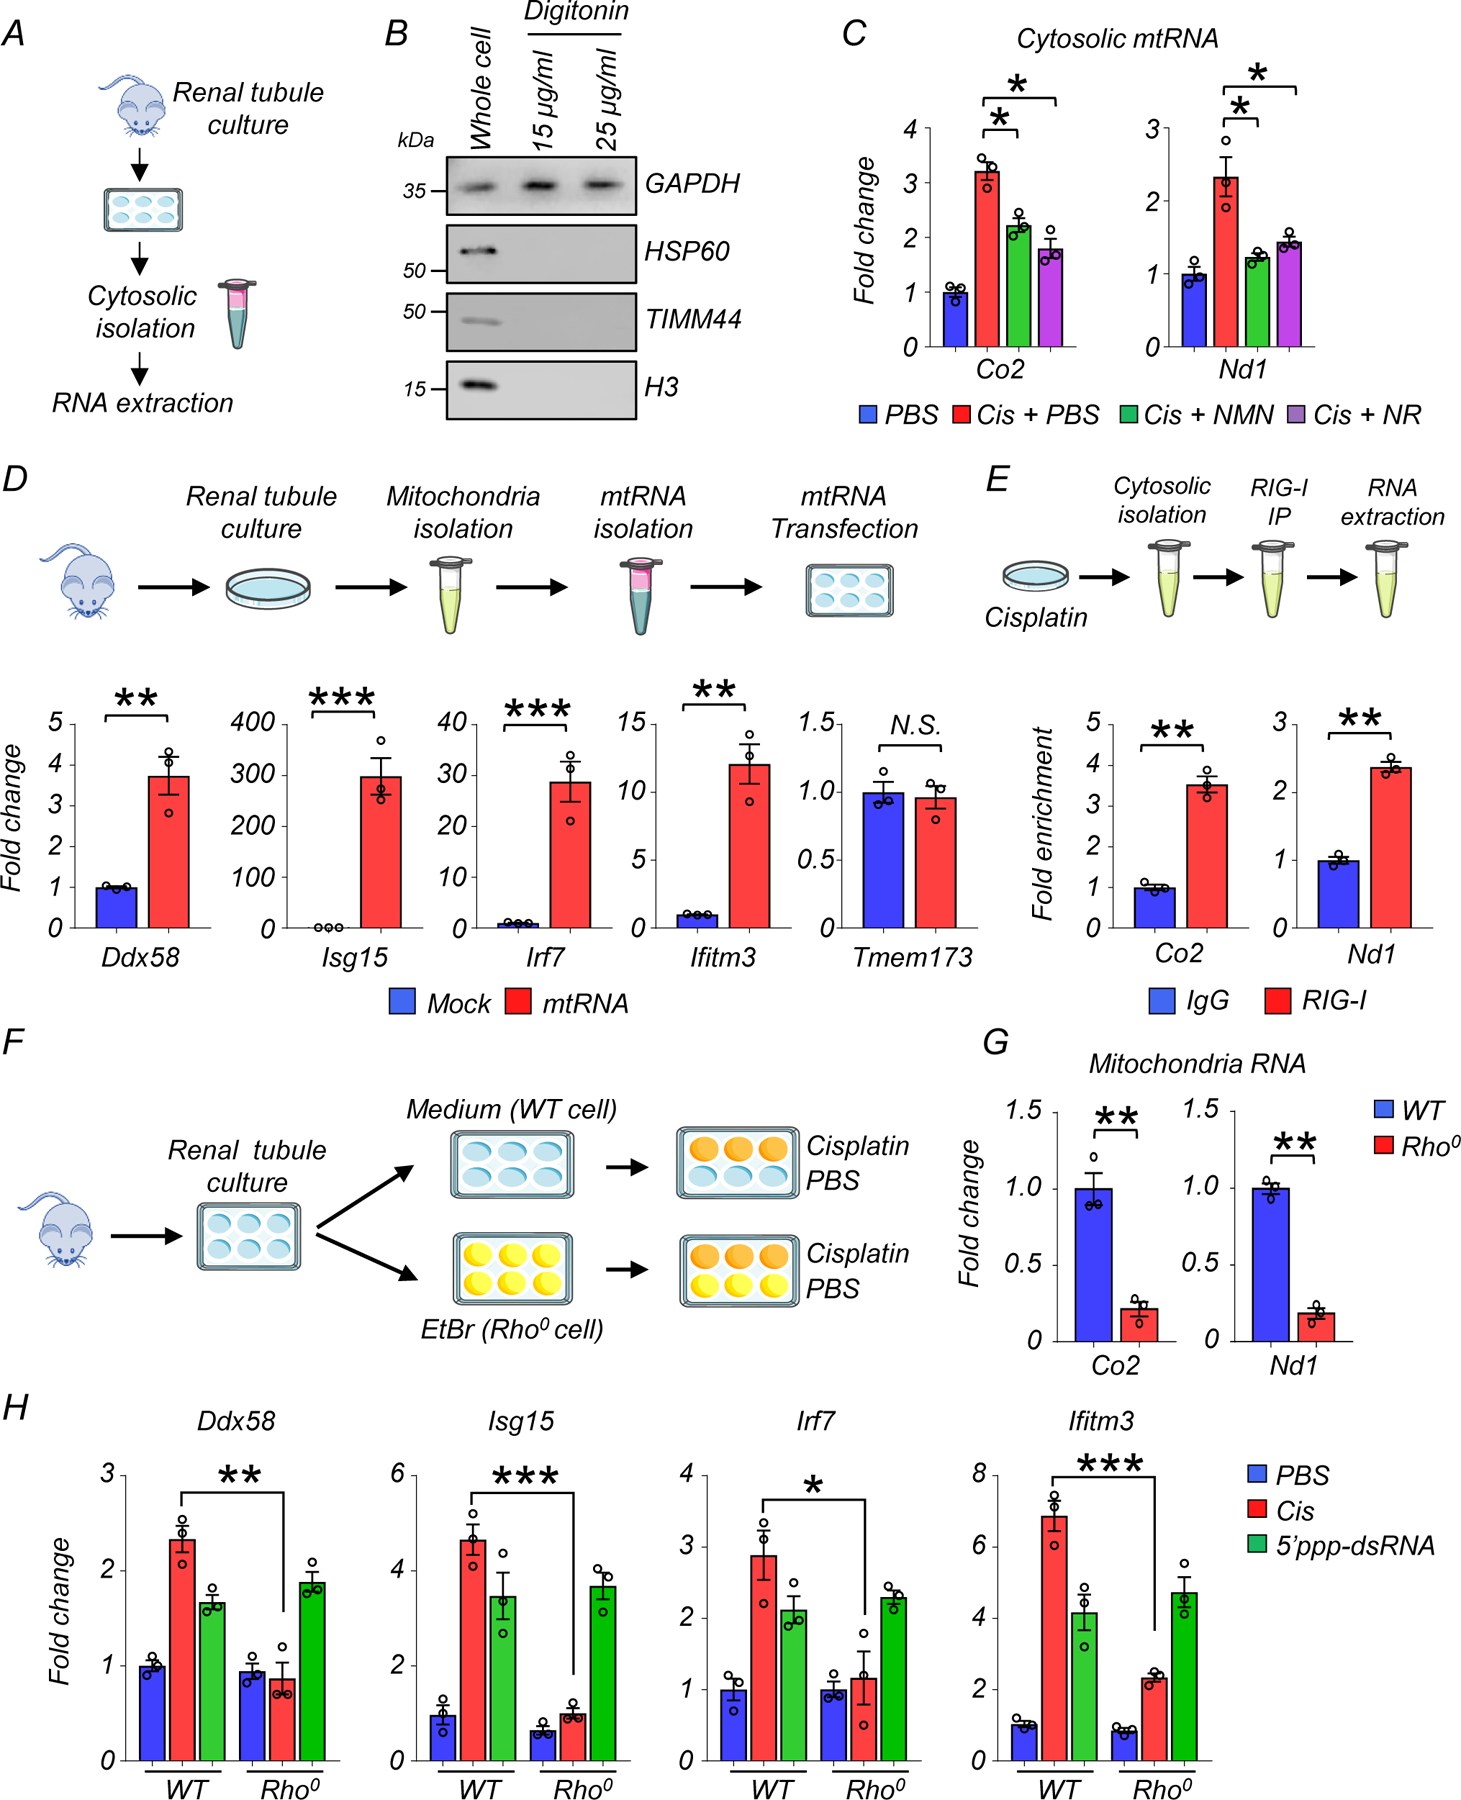
(A) Experimental design. Cytosolic RNA was isolated from cultured renal tubules of WT mice following cisplatin injury.
(B) Western blot image of GAPDH (cytosolic), HSP60 (mitochondria), TIMM44 (mitochondria), and H3 (nuclear) in whole cell or extracted cytosolic fraction using Digitonin. 3 experiments were repeated independently.
(C) Relative transcript levels of Co2, Nd1 in cytosolic fraction treated with DNase in experimental groups (n=3 in each group). *p<0.05.
(D) (Upper) Experimental design. Extracted mtRNA was transfected to renal tubule cells. (Lower) Relative transcript levels of Ddx58, Isg15, Irf7, ifitm3, and Tmem173 in renal tubule cells treated with mock or mtRNA transfection (n=3 in each group). **p<0.01, ***p<0.001, N.S. not significant.
(E) Experimental design. Cytosolic fraction from cisplatin-treated renal tubule cells were immunoprecipitated with RIG-I Ab or IgG, followed by RNA isolation. Fold enrichment of Co2 and Nd1 was calculated (n=3 in each group). **p<0.01.
(F) Experimental design. Renal tubule cells were cultured in a medium or in the presence of ethidium bromide (EtBr, Rho0 cells), and treated with PBS or cisplatin.
(G) Relative transcript levels of Co2, ND1 in WT or Rho0 renal tubule cells. **p<0.01.
(H) Relative transcript levels of Ddx58, Isg15, Irf7, and ifitm3 in WT or Rho0 renal tubule cells as indicated. *p<0.05, **p<0.01, ***p<0.001.
Gene expression levels were normalized using Gapdh. Data are presented as mean ± s.e.m. and were analyzed using a two-tailed Student’s t-test or a one-way ANOVA followed by Tukey post hoc test for multigroup comparison.
To directly show the induction of Ddx58 by cytosolic mtRNA, we next isolated mitochondria from renal tubule cells of WT mice, followed by extraction and purification of mtRNA (Fig. 5D). 400ng mtRNA was then transfected to cultured renal tubule cells. Transcript levels of Ddx58, Isg15, Irf7, and Ifitm3 were higher in renal tubule cells 2 days after transfection with mtRNA (Fig. 5D). Of note, we did not see a significant effect on the levels of Tmem173 (encoding the cytosolic DNA sensor STING), suggesting a negligible effect on the mtDNA sensing pathway (Fig. 5D).
We next examined whether RIG-I directly senses mtRNA. Cytosolic fraction from cisplatin-treated renal tubule cells were immunoprecipitated with RIG-I Ab or control IgG, followed by RNA extraction and purification (Fig. 5E, Supplementary Fig. 2B). Compared to control IgG Ab, RIG-I Ab extracts showed enrichment for mtRNA-encoded genes such as Co2, and Nd1, indicating the direct binding of mtRNA to RIG-I (Fig. 5E).
Ethidium bromide (EtBr) depletes mtDNA without affecting nuclear DNA transcription27. To determine if mtDNA/RNA-depleted cells (Rho0 cells) are resistant to cisplatin treatment, we isolated renal tubule cells and cultured them in presence of EtBr (100ng/ml) for 8 days (Fig. 5F). We confirmed the lack of mitochondrial DNA by negligible transcript levels of Co2 and Nd1 after EtBr treatment (Fig. 5G). In comparison to WT renal tubule cells, Rho0 renal tubule cells failed to induce the expression of Ddx58, Isg15, Irf7, and Ifitm3 following cisplatin treatment (Fig. 5H). However, both WT and Rho0 renal tubule cells were able to sense RNA and induce RIG-I in response to the synthetic RIG-I ligand (5’ppp-dsRNA) (Fig. 5H).
To directly evaluate the effect of low NAD+ level on RIG-I induction, we treated tubule cells with the NAMPT inhibitor FK866 (100nM). NAD+ levels were drastically lower after 1 day of FK588 treatment (Extended Data Fig 5A). Live cell number was unchanged on day 1 but decreased at later timepoints (Extended Data Fig 5A). The expression levels of Bax, Ddx58, Isg15, Irf7, Cxcl10, and Cxcl16 were higher in NAD+ depleted cells (Extended Data Fig 5B). Restoring NAD+ through NR supplementation normalized these effects (Extended Data Fig 5B).
Collectively these results indicate that cytosolic mtRNA leakage induced by cisplatin triggered RIG-I induction in renal tubule cells, which was prevented by NAD+ precursor supplementation.
NAD+ precursor supplementation prevents loss of mitochondrial activity in mouse kidneys
Cisplatin has been shown to impair mitochondrial function28. Having observed the protective effect of NMN and NR from cytosolic mtRNA leakage, we next examined their effects on mitochondria function in renal tubule cells. MitoSOX staining revealed higher levels of mtROS in renal tubule cells treated with cisplatin, which were reduced by NMN or NR supplementation (Fig. 6A). Mitochondrial membrane potential (MMP), evaluated by JC-1 staining, was lower in renal tubule cells treated with cisplatin, and NMN or NR supplementation equally improved MMP (Fig. 6B). Cisplatin treatment caused cell toxicity, increased Bax transcript levels and reduced live cell number. These changes were mitigated by NMN and NR supplementation (Fig. 6C and Extended Data Fig 6A, B). Seahorse-based analysis of mitochondrial respiration showed overall impaired oxygen consumption rate (OCR) in renal tubule cells following cisplatin treatment and marked improvement of the maximal respiration capacity with NMN or NR supplementation (Extended Data Fig 6C). Consistently, ATP contents in renal tubule cells were improved after NMN or NR supplementation to a similar degree (Extended Data Fig 6D). Live cell numbers were not affected following treatment with a SIRT1 inhibitor (EX527) or a PARP1 inhibitor (Olaparib) (Extended Data Fig 6E), suggesting that these pathways are not essential to the cisplatin-induced injury.
Figure 6. NAD+ precursors (NMN and NR) restored mitochondria function in renal tubule cells and mitochondrial metabolic activity in mice kidneys after cisplatin treatment.
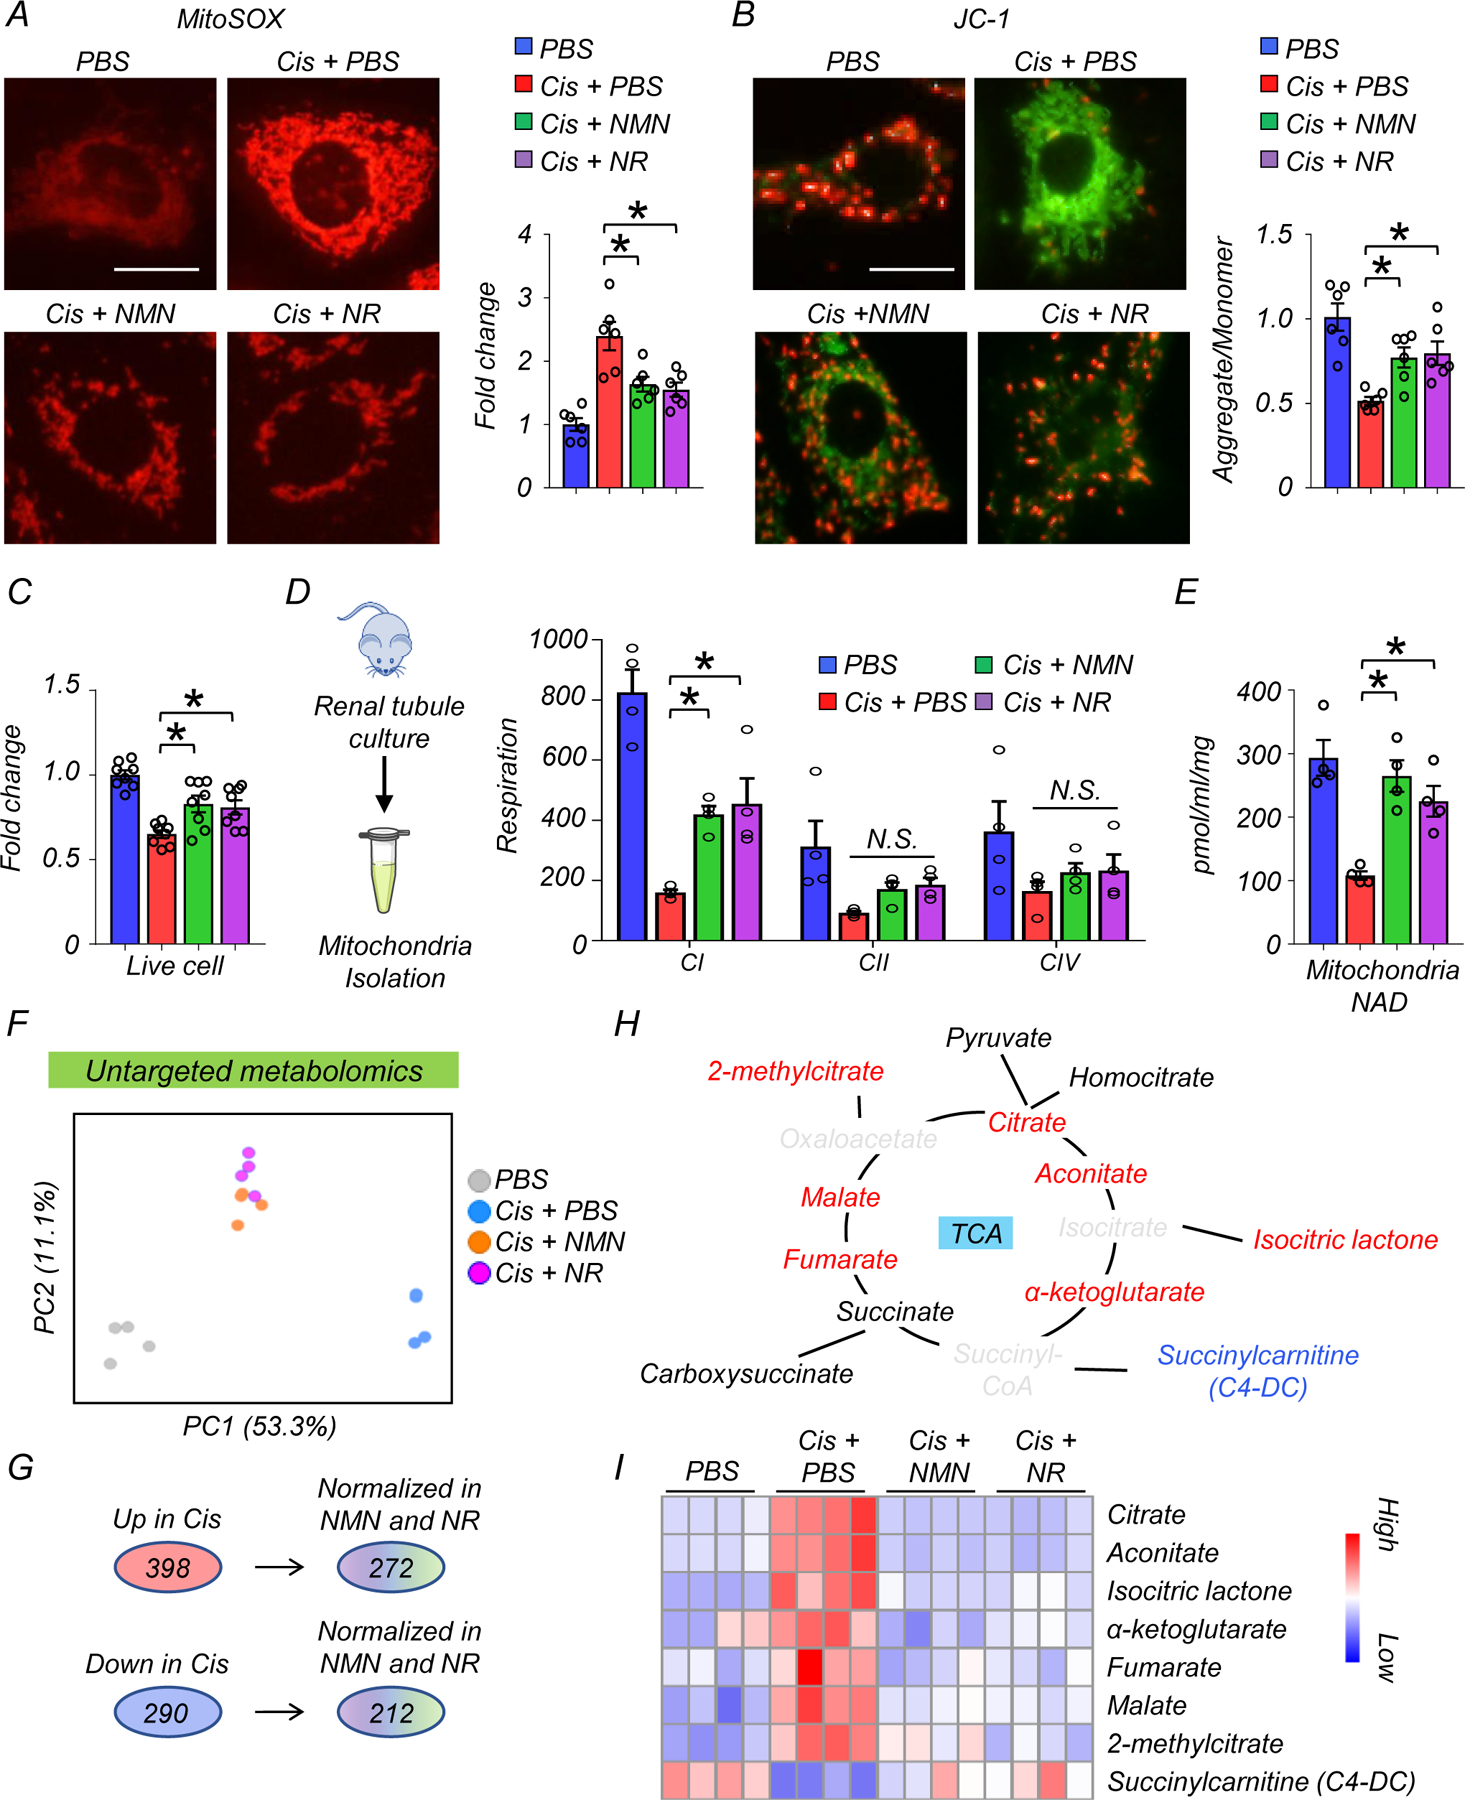
(A) Representative image and quantification of MitoSOX in renal tubules in experimental groups. Scale bars: 5 μm (n=6 in each group). *p<0.05.
(B) Representative image and quantification of JC-1 in renal tubules in experimental groups (n=3 in each group). Scale bars: 5 μm. JC-1 detect mitochondria membrane potential; aggregate form (red) and monomer form (green). *p<0.05.
(C) The relative quantification of live renal tubule cells in experimental groups (n=8 in each group). *p<0.05.
(D) Mitochondria were isolated from cultured renal tubule cells. Mitochondria respiration in each component (C1: complex1, CII: complex II, CIV: complex IV) was monitored by Oroboros in experimental groups (n=3 in each group). The values were normalized by total proteins. *p<0.05.
(E) Quantification of mitochondrial NAD+ levels in renal tubule cells from experimental groups (n=4 in each group). Values were normalized to total protein levels. *p<0.05.
(F) PCA analysis of untargeted metabolomics in kidneys of mice in experimental groups.
(G) Number of metabolites significantly higher (Up) or lower (Down) in the kidneys of mice injected with cisplatin. Number of metabolites those levels returned to normal following NAD+ precursor (NMN or NR) treatment.
(H) Graphic representation of the TCA cycle intermediates. The color indicates metabolites; significantly increased (red), decreased (blue), not changes (Black), not detected (gray) in the kidneys of mice treated with cisplatin.
(I) Heatmap showing TCA cycle intermediated and their derivative metabolites. Color indicates higher (red) or lower (blue) levels.
Data are presented as mean ± s.e.m. and were analyzed using a one-way ANOVA followed by Tukey post hoc test for multigroup comparison.
Next, to examine mitochondrial complex activities, we isolated mitochondria from cultured renal tubule cells. Cisplatin inhibited complex I, II, and IV (CI, CII, CIV)-dependent respiration. NMN or NR supplementation improved CI activity (Fig. 6D) with a trend toward improving CII and CIV activity as well (Fig. 6D). NAD+ levels in mitochondrial fractions were lower in cisplatin treated cells, and returned to normal level following NMN or NR supplementation (Fig. 6E).
Mitochondria ROS (mtROS) can cause apoptosis by releasing cytochrome c through BAX pores29, which appears to regulate cytosolic mtDNA and mtRNA leakage20. To investigate the role of mtROS and BAX in the induction of the RIG-I cytosolic RNA sensing pathway, we treated cultured renal tubule cells with mitoTEMPO (200µM), or BAX inhibitor (400µM) with or without cisplatin. Higher transcript levels of Ddx58, Isg15, and Irf7 were observed following cisplatin treatment, and these effects were attenuated in kidney tubule cells treated with mitoTEMPO or BAX inhibitor (Extended Data Fig 7A, B).
To understand the effects of NAD+ precursors on mitochondrial metabolic activity, we performed metabolomics on kidneys from the NMN- or NR-treated mice. PCA analysis showed that the NMN- and NR-treated groups clustered between sham and cisplatin groups, suggesting a partial rescue of their metabolic profiles (Fig. 6F). Among the 398 (up) and 290 (down) metabolites that showed changes in the cisplatin-injected group, 272 and 212 metabolites were normalized by NMN and NR supplementation, respectively (Fig. 6G). Interestingly, most TCA cycle intermediates (citrate, aconitate, isocitric lactone, α-ketoglutarate, fumarate, malate, 2-methylcitrate) were higher in kidneys after cisplatin injection, while succinylcarnitine (C4-DC) was lower (Fig. 6H) and NMN or NR supplementation reversed most of these changes (Fig. 6I, Supplementary Table 10).
Collectively, these results suggest that NAD+ precursor supplementation mitigates mitochondrial impairment induced by cisplatin in renal tubule cells and improves mitochondria metabolic activity in the kidney.
RIG-I and MAVS KO mice are resistant to kidney dysfunction and renal tubule injury induced by cisplatin.
Since we observed changes in mtRNA release and RIG-I activation that correlated with the beneficial effects of NAD+ precursors, we next sought to explore whether blocking RIG-I per se was protective against kidney disease development. To address this, we injected WT and RIG-I KO mice with cisplatin and collected kidneys and serum samples 3 days later (Fig. 7A). Serum Cr and BUN levels, key indicators of kidney function, were improved in RIG-I KO mice compared to WT mice after cisplatin injection (Fig. 7B). Similarly, transcript levels of Havcr1 and Lcn2, markers of renal tubule injury, were markedly lower in kidneys of RIG-I KO mice when compared to WT mice after cisplatin injection (Fig. 7C). Semi-quantitative scoring of the renal tubule injury indicated that RIG-I KO mice had lower tubule injury compared to WT mice after cisplatin injection (Fig. 7D). As expected, RIG-I levels were markedly higher in WT mice injected with cisplatin and undetectable in RIG-I KO mice (Fig. 7E, Extended Data Fig 8A). We found no observable changes in monomeric form of mitochondrial antiviral-signaling protein (MAVS), however, MAVS aggregation was lower in cisplatin-treated RIG-I KO mice30, 31 (Fig. 7E). Levels of cleaved caspase 3, a marker of the intrinsic apoptosis pathway, were lower in RIG-I KO mice compared to WT mice (Fig. 7E, Extended Data Fig 8A). The transcript levels of Isg15 and Irf7 were lower in kidneys of RIG-I KO mice treated with cisplatin (Fig. 7F) and in cisplatin-treated renal tubule cells isolated from RIG-I KO mice (Extended Data Fig 8B). There was no observable difference in expression levels of cGAS and Ifih1 in cisplatin-treated WT and RIG-I deficient renal tubule cells (Extended Data Fig 8B), suggesting that decreased inflammatory gene expression was not due to the suppression of these alternative nucleic acid sensing pathways.
Figure 7. Rig-I KO and MAVS KO mice protected from kidney dysfunction, tubule injury, apoptosis induced by cisplatin.
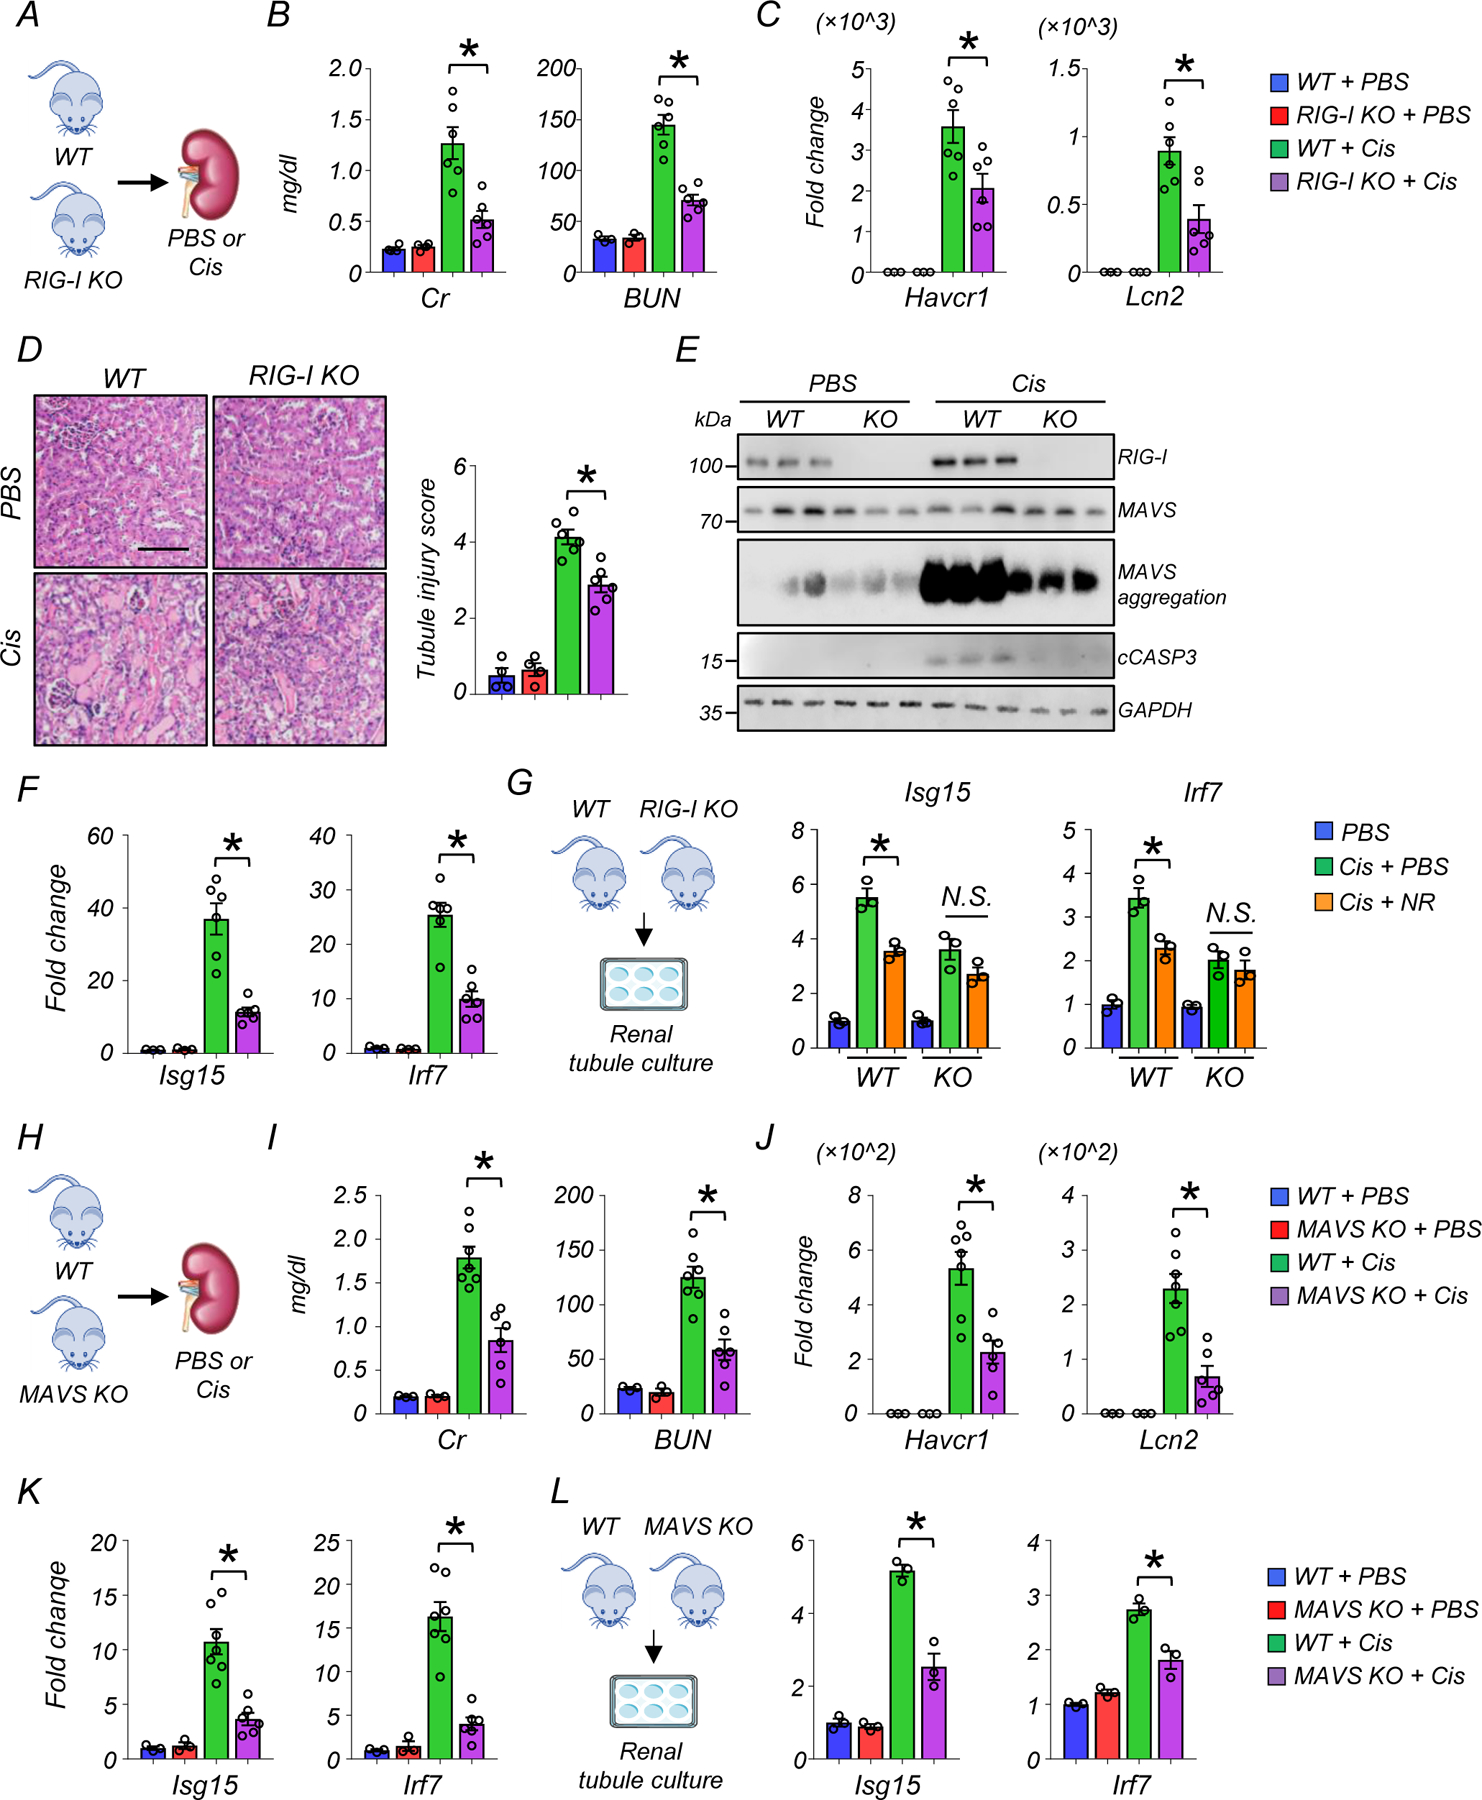
(A) Experimental design. WT or Rig-I KO mice were injected with PBS or Cisplatin (Cis).
(B) Serum creatinine (Cr) and blood urea nitrogen (BUN) levels in experimental groups. *p<0.05.
(C) Relative transcript levels of Havcr1 and Lcn2 in kidneys of experimental groups. *p<0.05.
(D) Representative images of hematoxylin and eosin staining and semi-quantitative analysis of renal tubule injury in experimental groups. Scale bars: 20 μm. *p<0.05.
(E) Western blot image and quantification of RIG-I, MAVS, cleaved caspase-3 (cCASP3), and SDD-PAGE of MAVS aggregation (n=3 in each group). *p<0.05, ***p<0.001. N.S. not significant.
(F) Relative transcript levels of Isg15, Irf7 in the kidneys of experimental groups. *p<0.05.
(G) Renal tubules were isolated from the kidneys of WT and Rig-I KO mice. Relative transcript levels of Isg15, Irf7 in experimental groups (n=3 in each group). *p<0.05.
(H) Experimental design. WT and MAVS KO mice were injected with PBS or Cisplatin (Cis).
(I) Serum creatinine and blood urea nitrogen (BUN) levels in experimental groups. *p<0.05.
(J) Relative transcript levels of Havcr1 and Lcn2 in kidneys of experimental groups. *p<0.05.
(K) Relative transcript levels of Isg15, Irf7 in the kidneys of experimental groups. *p<0.05.
(L) Renal tubules were isolated from the kidneys of WT and MAVS KO mice. Relative transcript levels of Isg15, Irf7 in experimental groups (n=3 in each group). *p<0.05.
(B-D,F) (WT + PBS n=3. RIG-I KO + PBS n=3. WT + Cis n=6. RIG-I KO + Cis n=6). (I-K) (WT + PBS n=3. MAVS KO + PBS n=3. WT + Cis n=7. MAVS KO + Cis n=6). Gene and protein expression levels were normalized using Gapdh. Data are presented as mean ± s.e.m. and were analyzed using a one-way ANOVA followed by Tukey post hoc test for multigroup comparison.
Kidney NAD+ levels were lower in cisplatin-injected RIG-I KO compared to sham-treated WT or RIG-I KO mice (Extended Data Fig 8C). NR supplementation in cisplatin-treated RIG-I deficient renal tubule cells did not further reduce the expression levels of Isg15 and Irf7, indicating that the protective effect of NAD+ on cisplatin-induced inflammation was mainly dependent on RIG-I (Fig 7G).
To further examine the role of cytosolic RNA sensing pathways in kidney disease, we analyzed MAVS KO mice following cisplatin injury (Fig 7H). MAVS KO mice had improved kidney function and lower tubular injury, as evident by lower Cr and BUN, and lower expression of Havcr1 and Lcn2 (Fig 7I and 7J) compared to cisplatin-treated wild type mice. The expression levels of Isg15 and Irf7 were lower in kidney tissue and in renal tubules isolated from MAVS KO mice treated with cisplatin (Fig 7K and 7L). In contrast, MDA5 deficiency had no effect on the expression of Ddx58, cGAS, Isg15, Irf7, and Ifitm3 in cisplatin-treated kidney tubule cells (Extended Data Fig 9A).
Leakage of mitochondrial DNA in renal tubule cells treated with cisplatin has been shown to elicit inflammation via cGAS/STING32. Consistently, cGAS-deficient cells showed lower expression of Isg15, Irf7, and Ifitm3 in cisplatin-treated renal tubule cells. However, no change in Ddx58 and Ifih1 expression was observed, suggesting an independent contribution of RIG-I and cGAS to fibroinflammation and kidney injury (Extended Data Fig 9B).
Collectively, these results confirm a role for mtRNA sensing via the RIG-I/MAVS pathway in cisplatin-induced kidney injury, as evidenced by improvement of renal function, and reduced epithelial injury and cell death in RIG-I and MAVS KO mice.
Lower NAD+ levels are associated with higher RIG-I expression in renal tubules of diseased human kidneys
Our mechanistic studies using mouse kidney injury models demonstrated that NAD+ precursors mitigated the activation of RIG-I-dependent cytosolic mtRNA sensing in renal tubules. Consistently, integrating transcriptomics and metabolomics information allowed us to detect a negative correlation of NAD+ levels with transcript levels of DDX58, ISG15, and IRF7, but not IFH1 in human kidneys (Fig. 8A, Supplementary Table. 1 and 2). To further explore the association of kidney function with RIG-I-dependent cytosolic mtRNA sensing in human kidney samples, we leveraged a previously established large-scale human kidney bulk RNAseq dataset, which included control and diseased kidneys2 (Supplementary Table. 11). Transcript levels of DDX58, ISG15, and IRF7 in human kidneys negatively correlated with estimated glomerular filtration rate (eGFR) and positively correlated with the degree of renal fibrosis (Fig. 8B, Extended Data Fig 10A). The correlation of IFIH1 expression levels with eGFR and fibrosis was weak (Fig. 8A and B). Transcript levels of DDX58 also positively associated with transcript levels of ISG15, IRF7, CXCL10, and CXCL16 in human kidneys (Extended Data Fig 10B). Consistent with the role of PGC1α in promoting NAD+ biosynthesis8, PPARGC1A expression correlated with kidney NAD+ levels and eGFR (Extended Data Fig 10C). To understand cell-type specific gene expression changes, we examined single-nuclear RNA-seq of human samples33. Interestingly, single nuclear RNA-seq of diseased human kidneys showed higher expression of DDX58, but not IFIH1 in injured renal tubules (Fig. 8C), which was validated by in situ hybridization (Fig. 8D).
Figure 8. Lower NAD+ levels are associated with higher RIG-I expression in renal tubules of human diseased kidneys.
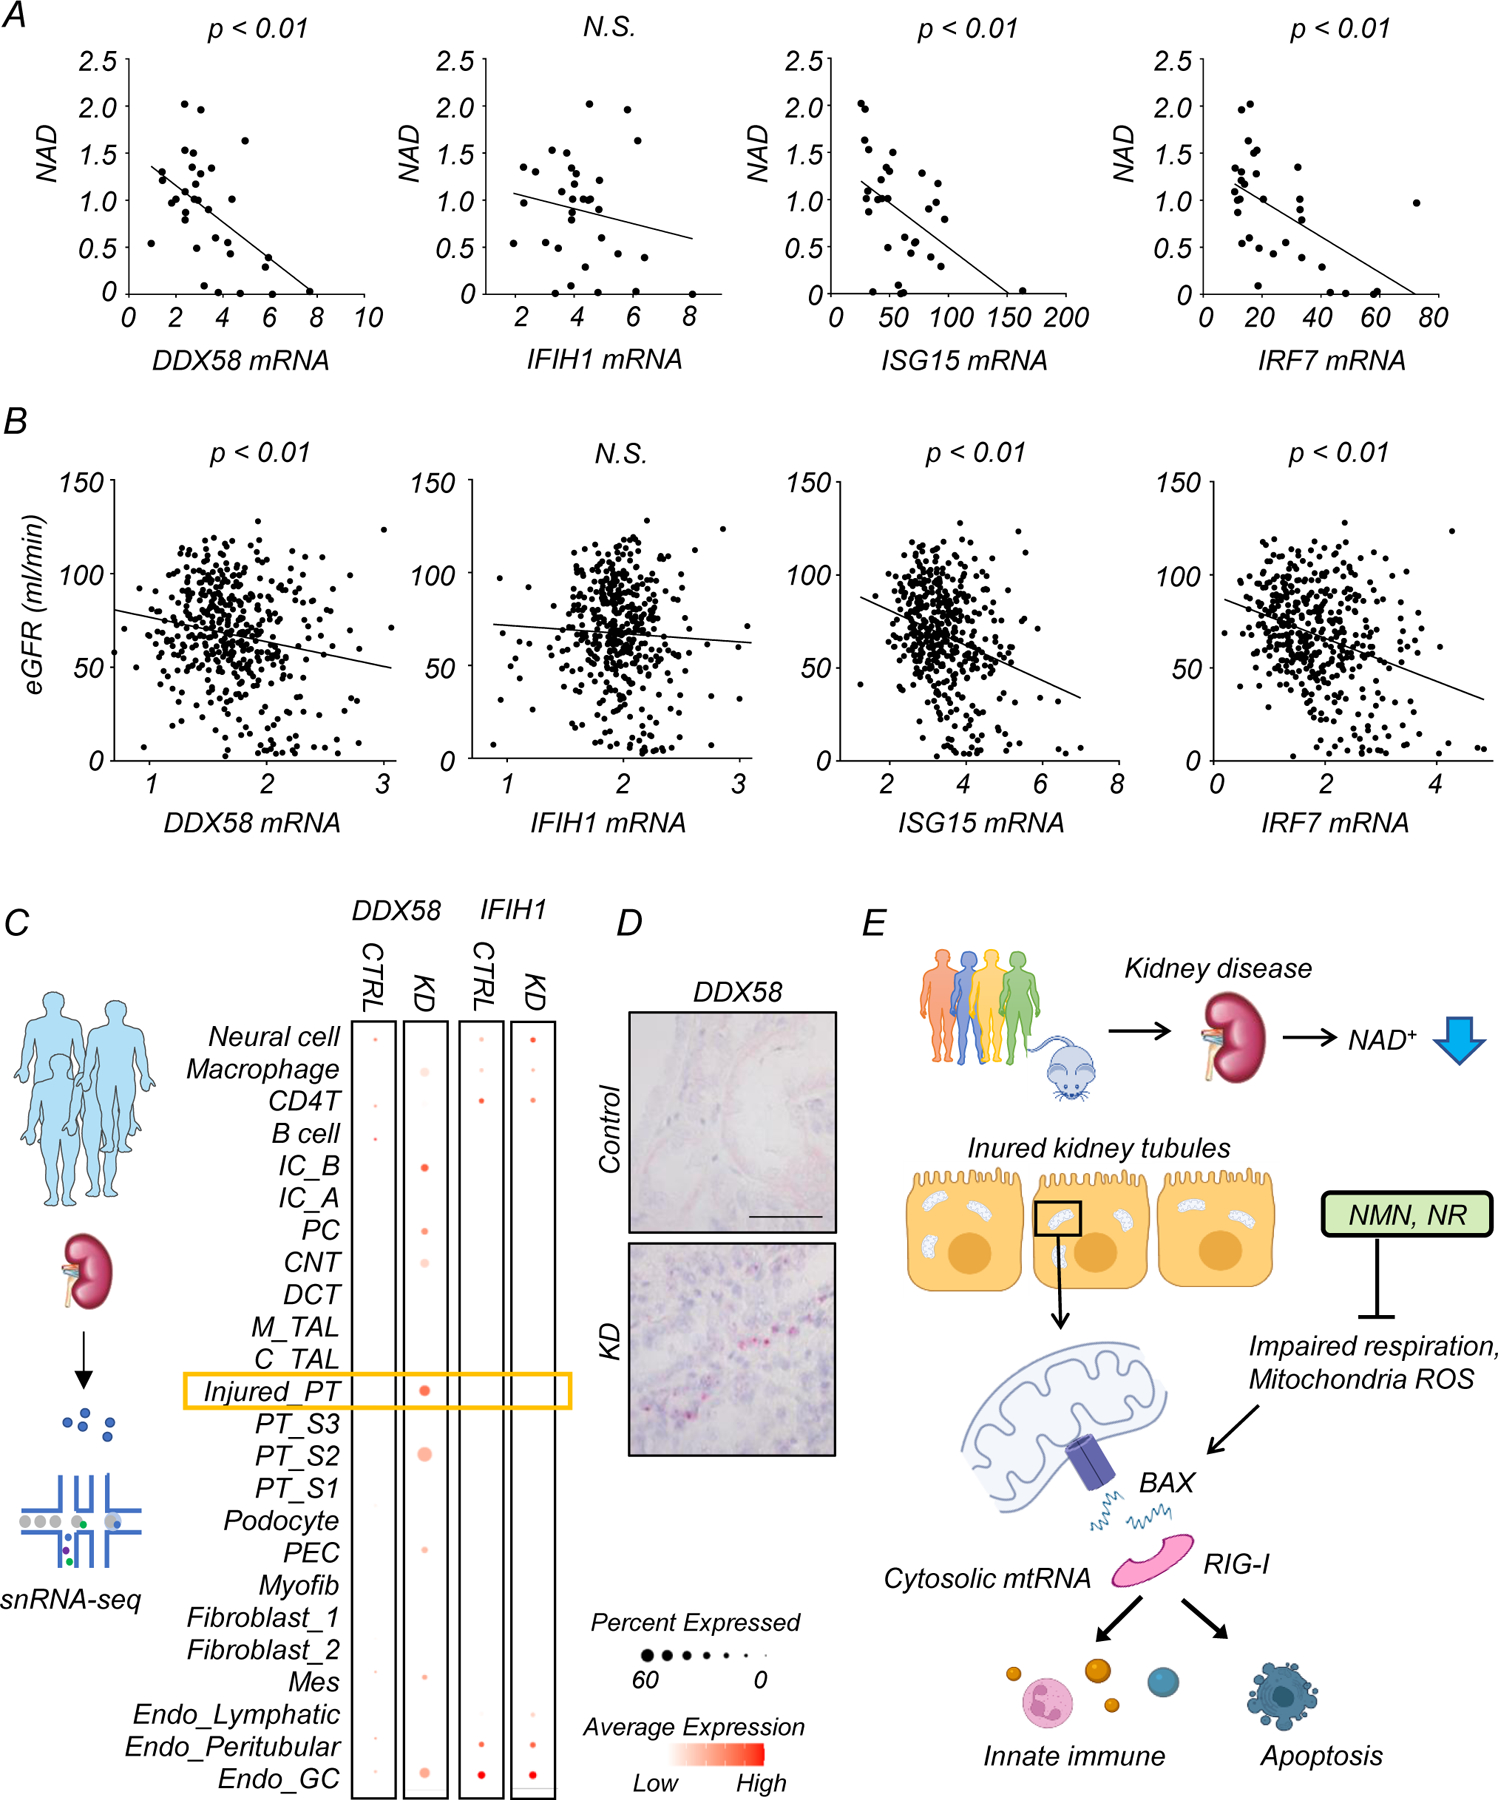
(A) Bulk RNA-seq and untargeted metabolomics were performed in the same human kidney samples. Correlation of kidney NAD+ levels and relative transcript levels of DDX58, IFIH1, ISG15, and IRF7. p-value was calculated by Person’s correlation.
(B) The correlation of eGFR with relative transcript levels of DDX58, IFIH1, ISG15, and IRF7 in 432 human kidney tissue samples. x-axis is relative gene expression y-axis is eGFR ml/min/1.72m2. p-value was calculated by Person’s correlation.
(C) snRNA-seq of human kidney samples. Each row represents cell type. Note that DDX58 expression was enriched in injured proximal tubule (PT) cells in kidney disease (KD) samples. IC; Intercalated cell, PC; principal cell, CNT; connecting tubule, DCT; distal convoluted tubule, M_TAL; thick ascending limp in the medulla, C_TAL; thick ascending limp in the cortex, PT; proximal tubule, PEC; parietal epithelial cell, MES; mesangial cell. GC; glomerular capillary
(D) Representative image of in situ hybridization of DDX58 in healthy control and kidney disease sample (KD). Scale bars: 20 μm. 2 experiments were repeated independently.
(E) Proposed mechanism of proximal tubule metabolic dysfunction
In summary, human multi-omics data demonstrated changes consistent with mouse models, suggesting that RIG-I and cytosolic RNA sensing are modulated by NAD+ status and play a conserved role in human kidney disease.
Discussion
The lack of unbiased, global human kidney metabolomics data has been a critical limitation to understanding changes in different metabolic pathways in kidney disease. Here we analyzed a mouse kidney disease model alongside patient samples, providing a critical resource for the community. Unlike the animal models, human samples were collected mostly from patients with diabetic and hypertensive chronic kidney disease. Nevertheless, several metabolites showed consistent changes in human and murine kidneys, including those related to NAD+ metabolism, suggesting a shared mechanism underpinning kidney disease development independent of time course and the type of injury. Our studies indicate that kidney NAD+ levels are regulated by both the de novo and salvage pathways, consistent with prior NAD+ flux analysis in mice34, 35. In contrast to de novo NAD+ synthesis enzymes, the mRNA expression levels of NAD+ salvage pathway enzymes were preserved in diseased kidneys from both species, suggesting that supplementation with NR or NMN is a reasonable therapeutic choice. The effectiveness of NMN and NR has rarely been compared head-to-head, but our results show that they have similar protective effects and drive comparable restoration of renal NAD+ levels in kidney disease models induced by cisplatin or IRI.
Mechanistically, our studies implicate the RIG-I dependent cytosolic RNA-sensing pathway in both the underlying pathology of kidney injury and the protective effect of NAD+ restoration. While prior studies have reported impaired NAD+ levels in kidneys of cisplatin-treated mice, there has been no widely accepted molecular mechanism for the protection afforded by NAD+ restoration. Leakage of mtDNA from dysfunctional mitochondria after cisplatin treatment was previously reported to activate the cytosolic DNA sensor; cGAS32, and consistently, we observed partial protection from cisplatin-induced inflammation in cGAS-depleted renal tubule cells. However, the induction of RIG-I did not require cGAS, implying that there are independent contributions of cytosolic mtDNA and mtRNA sensing in kidney disease20. Moreover, we demonstrate clear protection from cisplatin induced injury by genetic ablation of only the mtRNA sensing pathway (RIG-I KO and MAVS KO mice) and that direct transfection of mtRNA is sufficient to induce inflammatory gene signatures that are detected in injured kidneys. Finally, we note that a hyperactivating variant of RIG-I was recently associated with kidney failure in lupus36. Thus, integrating unbiased transcriptomics and metabolomic data from cisplatin injury allowed us to identify a mechanism in which maintenance of renal NAD+ levels prevents the release of mtRNA and activation of the RIG-I pathway, a prominent driver of inflammation that contributes to kidney disease (Fig. 8E).
In conclusion, our study provides a comprehensive unbiased metabolomics dataset and highlight changes in NAD+ metabolism in diseased human and murine kidneys. We illustrate a mechanism linking restoration of NAD+ in renal tubules to improved mitochondrial function and attenuation of RIG-I-based cytosolic RNA sensing that drives fibroinflammation in renal tubules.
Materials and Methods
Mice
Animal studies were approved by the Institutional Animal Care and Use Committee (IACUC) of the University of Pennsylvania. WT mice were injected with cisplatin (25mg/kg) (Cayman, #Cay13119) dissolved in PBS intraperitoneally. To induce bilateral Ischemia-reperfusion Injury (IRI), renal pedicles of both kidneys were exposed via dorsal incision and bilateral clamping was performed with arterial clips for 28 minutes. Core body temperature was measured via rectal probe and was maintained at 36.8–37.2 °C throughout the procedure using an automatic closed loop temperature control system (Homeothermic Monitoring System, Harvard Apparatus, Holliston, CA). NAD+ precursors (NMN or NR) and vehicle control (PBS) were injected intraperitoneally for 4 consecutive days. The first dose was injected 2 hours before cisplatin injection or IRI. The dose of NMN (500mg/kg) were based on a previous publication22. The dose of NR (435mg/kg) were calculated using the molecular ratio to generate the same amount of NAD+ as NMN. NMN and NR were freshly dissolved in PBS on the injection day. The concentration of NMN and NR solution were 40 mg/ml and 35 mg/ml respectively in order to inject same volume. The same volume of vehicle control (PBS) was injected into control mice. Kidney and blood samples were collected 3 days after cisplatin injection or IRI surgery. RIG-I KO (Stock #046070), MAVS KO (Stock #008634), and MDA5 KO (Stock #015812) mice were obtained from Jackson Laboratory. cGAS flox mice were obtained from Charles Rice (Rockefeller University)37. All mice were C57BL/6 background and only male mice at age 8–12 weeks were used in all experiments. Mice were housed under Specific Pathogen Free (SPF) conditions with a 12-hour dark/light cycle, 22–25 °C, and 50–60% humidity with water and food provided ad libitum.
Sample preparation and data analysis for mice and human kidney metabolomics study.
Kidneys from mice and human were collected and weighted. Snap frozen samples were sent to the Metabolon, and proceeded to measure metabolites levels in the kidneys with Ultrahigh Performance Liquid Chromatography-Tandem Mass Spectroscopy (UPLC-MS/MS). Raw data was extracted, peak-identified and QC processed using Metabolon’s hardware and software. A data normalization step was performed to correct variation resulting from instrument inter-day tuning differences. Principal Components Analysis (PCA) was tested to reduce the dimension of the data. The pathway analysis using MetaboAnalyst (http://www.metaboanalyst.ca) with default setting was performed for the metabolites significantly changed in mice and human kidney tissues. The human study was deemed exempt by the Institutional Review Board of the University of Pennsylvanian as no personal identifiers were collected.
Mouse and human kidney bulk RNA sequencing analysis
Total RNA was isolated from the kidneys of mice and human using the RNeasy mini kit (Qiagen #74126). After sample quality check, the samples with highest RIN (RNA integrity number) were selected for library preparation. Sequencing libraries were constructed using the Illumina TruSeq RNA Preparation Kit. High-throughput sequencing was performed using Illumina NovaSeq6000 with 100bp pair-end according to the manufacturer’s instruction. Trim-galore was used to remove low-quality reads. Reads were aligned to the mouse (GRCm38) or human (hg19) reference genome using STAR (v2.4.1d). HTSeq-0.6.1 was used for gene mapping. Differentially expressed genes between experimental groups were identified using DESeq2 version 1.10.1.
Human kidney snRNAseq
Human kidneys were homogenized and single nuclear suspension for snRNAseq was prepared according to manufacturer’s protocol (10X Genomics)3, 38. Quality control for constructed library was perform by Agilent Bioanalyzer High Sensitivity DNA kit. The libraries were sequenced on an Illumina HiSeq.
Estimation of cell proportions
CIBERSORTx was used to deconvolute (determine the percent of each cell type) the bulk RNA sequencing data of mouse kidney samples39.
Western blot
Mice kidney lysates were homogenized in SDS lysis buffer (CST, #7722) with 2-Mercaptoethanol, and boiled for 5 minutes at 95 degrees. Lysates were transferred onto polyvinylidene difluoride membranes. After blocking in 5% milk in TBS and 0.1% Tween-20, membranes were incubated overnight with the following antibodies at 4 degrees: RIG-I (D14G6) (CST, # 3743S), cleaved Caspase-3 (CST, #9664), BAX (CST, #2772), MAVS (CST, #4983S), MDA5 (CST #5321), GAPDH (CST, #5174). Membranes were incubated with Horseradish peroxidase-conjugated secondary anti-rabbit or anti-mouse antibody (CST #7074, #7076) for 1 hour at room temperature. Signal was detected by enhanced chemiluminescence (SuperSignal™ West Femto Maximum Sensitivity Substrate # 34094, Thermo Scientific). Western blots were quantified using the Fiji software40.
MAVS aggregation assay
To detect MAVS aggregation, semidenaturing detergent agarose gel electrophoresis (SDD-AGE) was performed according to a published protocol30. Briefly, mitochondria fraction was isolated from mouse kidneys and resuspended in 1 × sample buffer (0.5 × TBE, 10% glycerol, 2% SDS, and 0.0025% bromophenol blue). Samples were loaded onto a 1.5% agarose gel. After electrophoresis in running buffer (1 × TBE and 0.1% SDS) for 45 min with a constant voltage of 100 V at 4°C, the proteins were transferred to PVDF membrane for immunoblotting and incubated with MAVS Antibody overnight at 4°C.
RNA-immunoprecipitation assay
The cytosolic fraction isolated from cultured renal tubule cells using digitonin including RNase and protease inhibitors were treated with cisplatin for 24 hours. Anti-Rig-I Ab or control IgG were added into the equally aliquoted cytosolic fractions, and gently rotated overnight at 4 °C. Protein A/G beads were then added for 2 hours, followed by a washing step. RNA was extracted and purified from the precipitated samples and analyzed by RT–qPCR using mtRNA specific primers (Supplementary table12). Fold enrichment of mtRNA in Rig-I Ab relative to Control IgG was calculated and the result of 3 independent experiments were plotted.
Histological analysis
Paraffin-embedded sections of mouse kidney tissue fixed in 10% formalin were cut at 5-µm thickness, and deparaffinized. Hematoxylin and eosin staining and Sirius red staining (#24901, Polysciences) were performed according to manufacturer’s protocol. The degree of tubulointerstitial damage was scored as previously described41. The sections were semi-quantitatively scaled (0 to 5+), according to the percentage of the area affected by hyaline casts, tubular atrophy, tubular lumen dilation, and interstitial immune cells infiltration (0 = normal; 1 = <10%; 2 = 10–25%; 3 = 26–50%; 4 = 51–75%; 5 = >75%). 5–8 independent fields were analyzed, and the mean value was plotted.
For immunofluorescence staining, sections were incubated with citrate buffer at 95°C for 10 minutes for antigen retrieval. Sections were allowed to cool slowly for 1 hour, and washed in distilled water, Non-specific signal was blocked with 10% FBS at room temperature for 1 hour. Sections were incubated overnight at 4°C with FITC-labelled anti-mouse Ly-6G Antibody (BioLegend, #127605). Sections were mounted with ProLong® Gold Antifade Mountant with DAPI (#P36935, Invitrogen) and examined under a fluorescence microscope (OLYMPUS DP73) . The Ly6G+ cells were counted in 5–8 independent fields in kidneys from each mouse (n = 4, each group), and the mean value was plotted.
In situ hybridization
RNAscope® 2.5 HD Duplex Detection Kit (bio-techne, #322436) was applied to perform in situ hybridization using formalin-fixed paraffin-embedded mouse kidney tissue. The probe for human DDX58 (Hs-RIG-I-C2 # 550261), mice Isg15 (Mm-Isg15-O1 #559271) were used for the RNAscope assay.
qRT-PCR
RNA was isolated from kidney tissue or cells using Trizol (Invitrogen #15596018) or RNeasy mini kit (Qiagen #74106). RNA was reverse transcribed using the High-Capacity cDNA Reverse Transcription Kit (Applied Biosystems #4368813) and qRT-PCR was run in the ViiA 7 System (Life Technologies) instrument using SYBR Green Master Mix (Applied Biosystems #4367659) and gene-specific primers. For quantitative analysis, samples were normalized using GAPDH or ACTB with the delta delta CT method. Primer sequences are listed in Supplemental Table 12.
In vitro experiments using renal tubule cells
Renal tubule cells were isolated from 3–4 weeks old WT or RIG-I KO mice. Kidneys were minced and incubated for 30 min at 37˚C with collagenase I (Worthington Biochemical Product #CLS-1). Digested kidney cells were filtered through the 100-um, 70-umm, 40-um mesh. Cell suspensions were cultured in RPMI 1640 (Corning #10–040-CM) supplemented with 10% fetal bovine serum (FBS, Atlanta Biologicals #S11950), 20 ng/ml EGF (Peprotech #AF-100–15), ITS (Gibco #51500–056), and 1% penicillin-streptomycin (Corning #30–002-CI) at 5% CO2 and 37˚C.
Renal tubule cells were treated with cisplatin (10 µM) or PBS overnight. NAD+ precursors (400µM, NMN, NR), mitoTEMPO (200µM, Sigma, #SML0737), BAX inhibitor (400µM, Cayman Chemical # 30243), EX527 (10 µM, SIRT1 inhibitor, Sigma #E7034;), Olaparib (10 µM, PAPR inhibitor, Selleck Chemicals, #S1060) and their vehicle controls were supplemented 2 hours before cisplatin treatment. Renal tubule cells were incubated with FK866 (100nM, NAMPT inhibitor, Cayman Chemical, #13287) to delete NAD+ for indicated time. Mitochondria ROS and membrane potential were assessed by staining MitoSOX (Thermo, #M36008) and JC-1 (Thermo, #T3168) respectively according to the manufacturer’s instruction. The fluorescent signal was measured by microplate reader for quantification. Live cells assay (Promega; #G9200), cytotoxicity assay (Promega; #G17800), and ATP contents measurement (Biovision; #K354) were tested according to the manufacturer’s instruction.
Renal tubule cells isolated from cGAS flox/flox mice we transfected with GFP-Cre or GFP adenovirus. After 48 hours incubation, renal tubule cells were treated with 10µM cisplatin for 24 hours.
Mitochondrial isolation from renal tubule cells.
Cultured renal tubules were dissociated using trypsin, washed with PBS, and centrifuged at 500 g at 4°C for 10 minutes. Samples were resuspended in mitochondrial isolation buffer (MIB) (containing 210 mM mannitol, 70 mM sucrose, 1 mM EDTA, 10 mM HEPES, final pH adjusted to 7.2) with 0.25% fatty acid–free BSA. Samples were homogenized using an IKA RW20 digital homogenizer at 12,000 rpm/min for 20 times at cold room 42. Samples were centrifuged at 800g for 5 minutes at 4°C. The supernatant containing mitochondria was transferred to the new tubes, and then centrifuged at 10,000g for 10 minutes at 4°C. The pelleted mitochondrial fraction was collected and used for downstream assay.
Oxygen consumption measurements in renal tubule cells
For real-time analysis of the oxygen consumption rate (OCR), renal tubule cells were analyzed using an XF-96 Extracellular Flux Analyzer (Seahorse Bioscience). In brief, cells were plated in XF-96 cell culture plates, and treated with PBS or cisplatin with or without NAD+ precursors (NMN, NR). The following substrates were used to estimate OCR; 1 µM oligomycin, 1.5 μM fluoro-carbonyl cyanide phenylhydrazone (FCCP) and 100 nM rotenone plus 1μM antimycin A.
In vitro mitochondria high-resolution respiration assay in renal tubule cells
The activity of complex I, II and IV in mitochondria of renal tubule cells was examined using Oroboros Instruments. Briefly, 200µg mitochondria were resuspended in the respiration buffer, containing 110 mM mannitol, 0.5 mM EGTA, 3 mM MgCl2, 20 mM taurine, 10 mM KH2PO4, 60 mM K lactobionate, 0.3 mM DTT, and 0.1% fatty acid–free BSA at pH 7.242. After measuring baseline oxygen consumption rate, oxygen concentration were continuously recorded. Complex I-dependent respiration was induced by adding 10 mM pyruvate, 10 mM malate, and 1 mM ADP. An inhibitor of Complex I, rotenone (0.5 μM), was used to determine Complex l-dependent respiration. Antimycin A (5 μM) was used to inhibit complex III, followed by TMPD (0.5 mM) and ascorbate (2 mM) as artificial substrates for complex IV42. The data were analyzed using DatLab software 4.3 (Oroboros Instruments).
NAD measurement of mitochondria
NAD in the isolated mitochondria from renal tubule cells were measured by an enzymatic cycling assay in a 96-well format as previously described42. The concentration of NAD was determined by measuring the rate of resorufin accumulation in microplate reader with fluorescence excitation at 544 nm and emission at 590 nm42. The values were normalized by total protein levels.
Cytosolic extraction from renal tubule cells
Cytosolic fraction was extracted as described previously 21. Renal tubule cells were resuspended in roughly 500 μl buffer containing 150 mM NaCl, 50 mM HEPES pH 7.4, and 15–25 μg/ml digitonin (#300410 Millipore). Samples were incubated for 10 min at 4 degrees with constant rotation to allow selective plasma membrane permeabilization, followed by centrifuge at 980g for 10 min at 4 degrees. The cytosolic supernatants were transferred to fresh tubes and centrifuged at 17,000g for 10 min to remove cellular debris, mitochondria, nucleus. Purity of cytosolic fraction was examined by western blot analysis.
The evaluation of cytosolic mitochondria RNA expression in renal tubule cells
Cytosolic fractions from kidney tubules were extracted as described previously 20. Briefly, PBS resuspended cells were aliquoted equally to 2 tubes. First tube was used to extract cytosolic fraction. Second tube was used for normalization. RNA was extracted and purified in both tubes using RNA extraction kit (#74106, Qiagen) with optional DNase treatment (#79254, Qiagen) according to manufacturer’s protocol. Equal volumes of eluate were used for cDNA production. Samples were optionally incubated with RNAse A (CST, #7013) at 100µg/ml, 37 degrees for 30minutes. Mitochondrial gene transcripts in the cytosolic fraction were evaluated by real time qPCR using mitochondrial genome specific primers (Supplementary Table 12). qRT-PCR was run in the ViiA 7 System (Life Technologies) instrument using SYBR Green Master Mix (Applied Biosystems #4367659).
Transfection of mitochondria RNA into renal tubule cells
400ng isolated mitochondria were transfected into renal tubule cells using lipofectamine 3000 (Thermo, #L3000008). Total RNA was corrected 24 hours after transfection from renal tubule cells.
Establishment of Rho0 renal tubule cells
Renal tubule cells were cultured in RPMI medium in presence of ethidium bromide (EtBr,100ng/ml), uridine (50µg/ml), and sodium pyruvate (1mM) for 8 days to make mitochondria DNA/RNA-depleted cells. The loss of mitochondria RNA was confirmed by qPCR. No apparent cell death was observed following EtBr treatment, however, cell growth was slower compared to untreated cells. Both untreated and Rho0 cells were treated with cisplatin when cells reached to 80 to 90 % confluency. 500ng RIG-I agonist (5’ppp-dsRNA #tlrl-3prna, Invivogen) were transfected into Rho0 cells as a positive control.
Statistics
All data are shown as mean ± SEM. Comparisons between 2 groups were analyzed using unpaired 2-tailed Student’s t test. Comparisons between 3 or more groups were analyzed using 1-way ANOVA followed by Tukey’s post hoc testing. For metabolomics data, Welch’s two-sample t-test was used. A P value of less than 0.05 was considered significant.
Study approval
All animal work was performed in accordance with the guidelines and with approval of the University of Pennsylvania IACUC.
Extended Data
Extended Data Fig. 1. Changes in de novo NAD+ synthesis pathway in human and mouse kidneys.
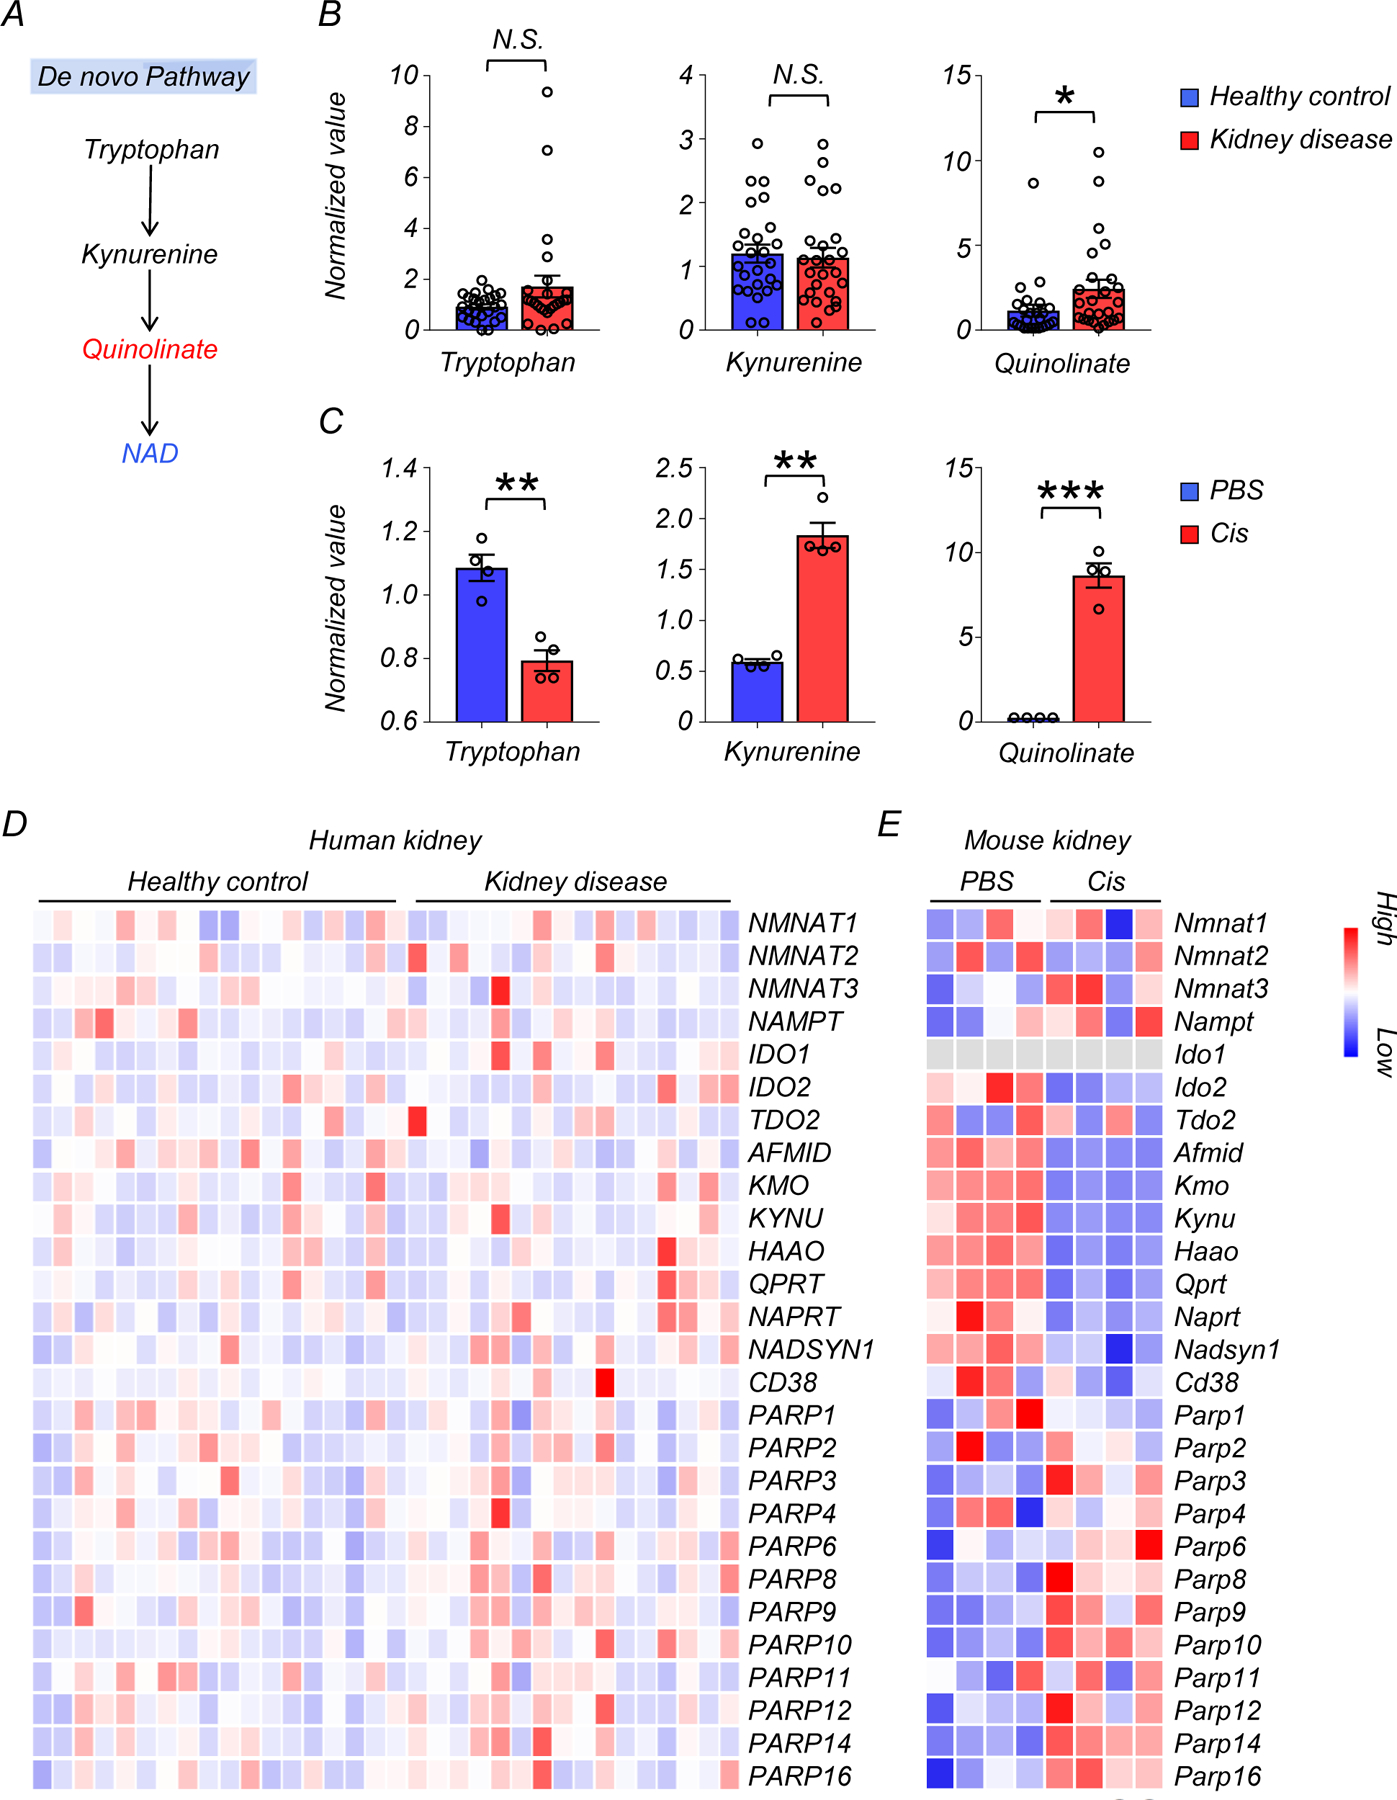
(A) Simplified de novo NAD+ synthesis pathway. The color indicates metabolites significantly higher (red) or lower (blue) in injured kidneys of human and mice.
(B) Relative quantification of tryptophan, kynurenine, and quinolinate in human kidneys (Healthy control n=25. Kidney disease n=25). * p<0.05. N.S. not significant.
(C) Relative quantification of tryptophan, kynurenine, and quinolinate in mouse kidneys (PBS n=4. Cis n=4). ** p<0.01, *** p<0.001.
(D) Heatmap showing the expression of genes involved in NAD+ metabolism in human kidneys. Color indicates higher (red) or lower (blue) expression.
(E) Heatmap showing the expression of genes involved in NAD+ metabolism in mouse kidneys. Color indicates higher (red) or lower (blue) expression.
Data are presented as mean ± s.e.m. and were analyzed using a two-tailed Student’s t-test.
Extended Data Fig. 2. Changes in de novo NAD+ synthesis pathway in age-matched human kidneys.
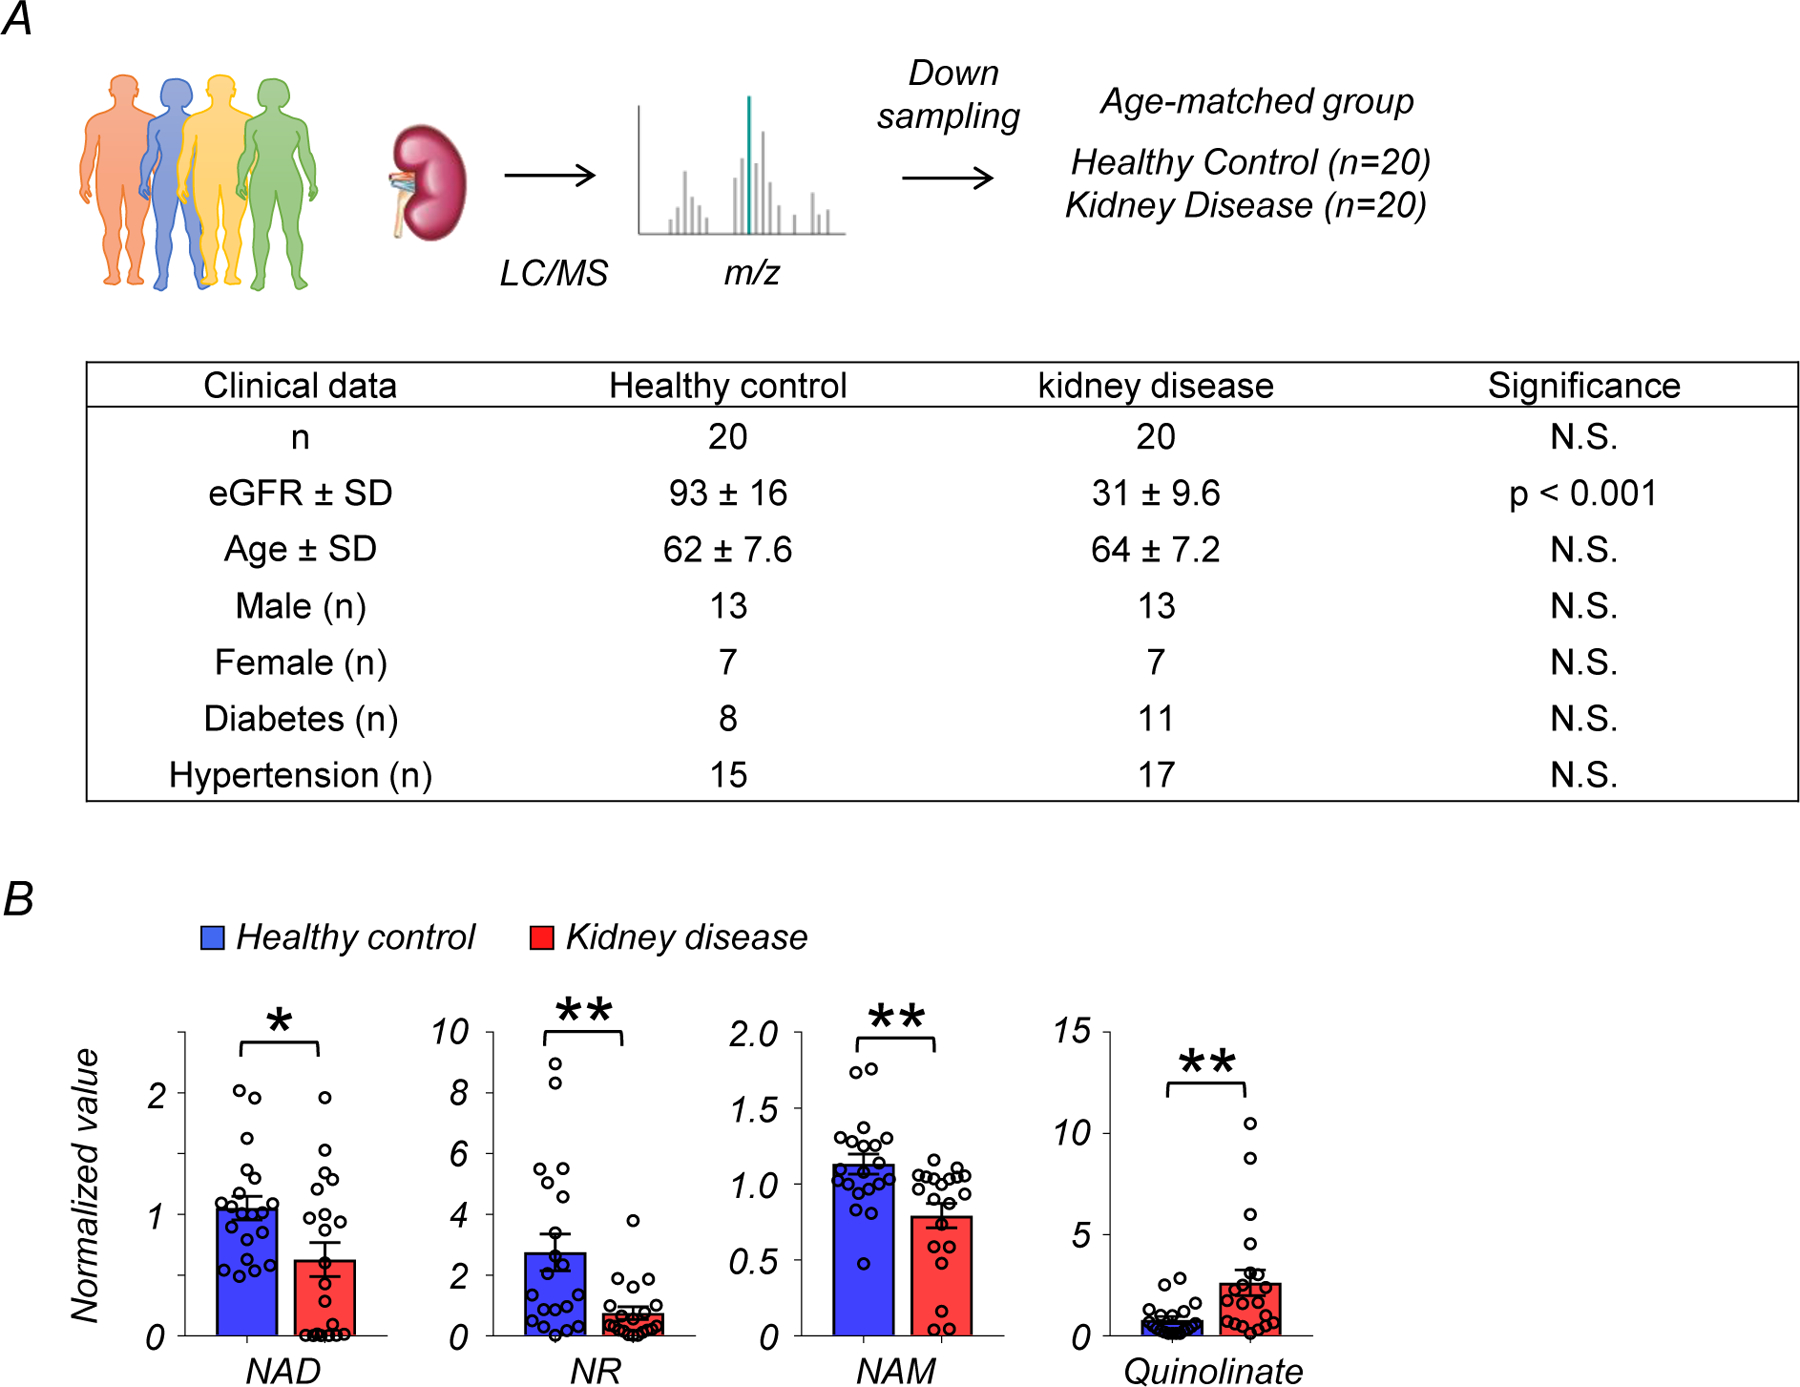
(A) Demographic and clinical data of age-matched human kidney samples.
(B) Relative quantification of NAD+, NR, NAM, and quinolinate in human kidneys (Healthy control n=25. Kidney disease n=25). * p<0.05.
Data are presented as mean ± s.e.m. and were analyzed using a two-tailed Student’s t-test.
Extended Data Fig. 3. The expression levels of genes involved in cytosolic DNA and RNA sensing in kidneys.
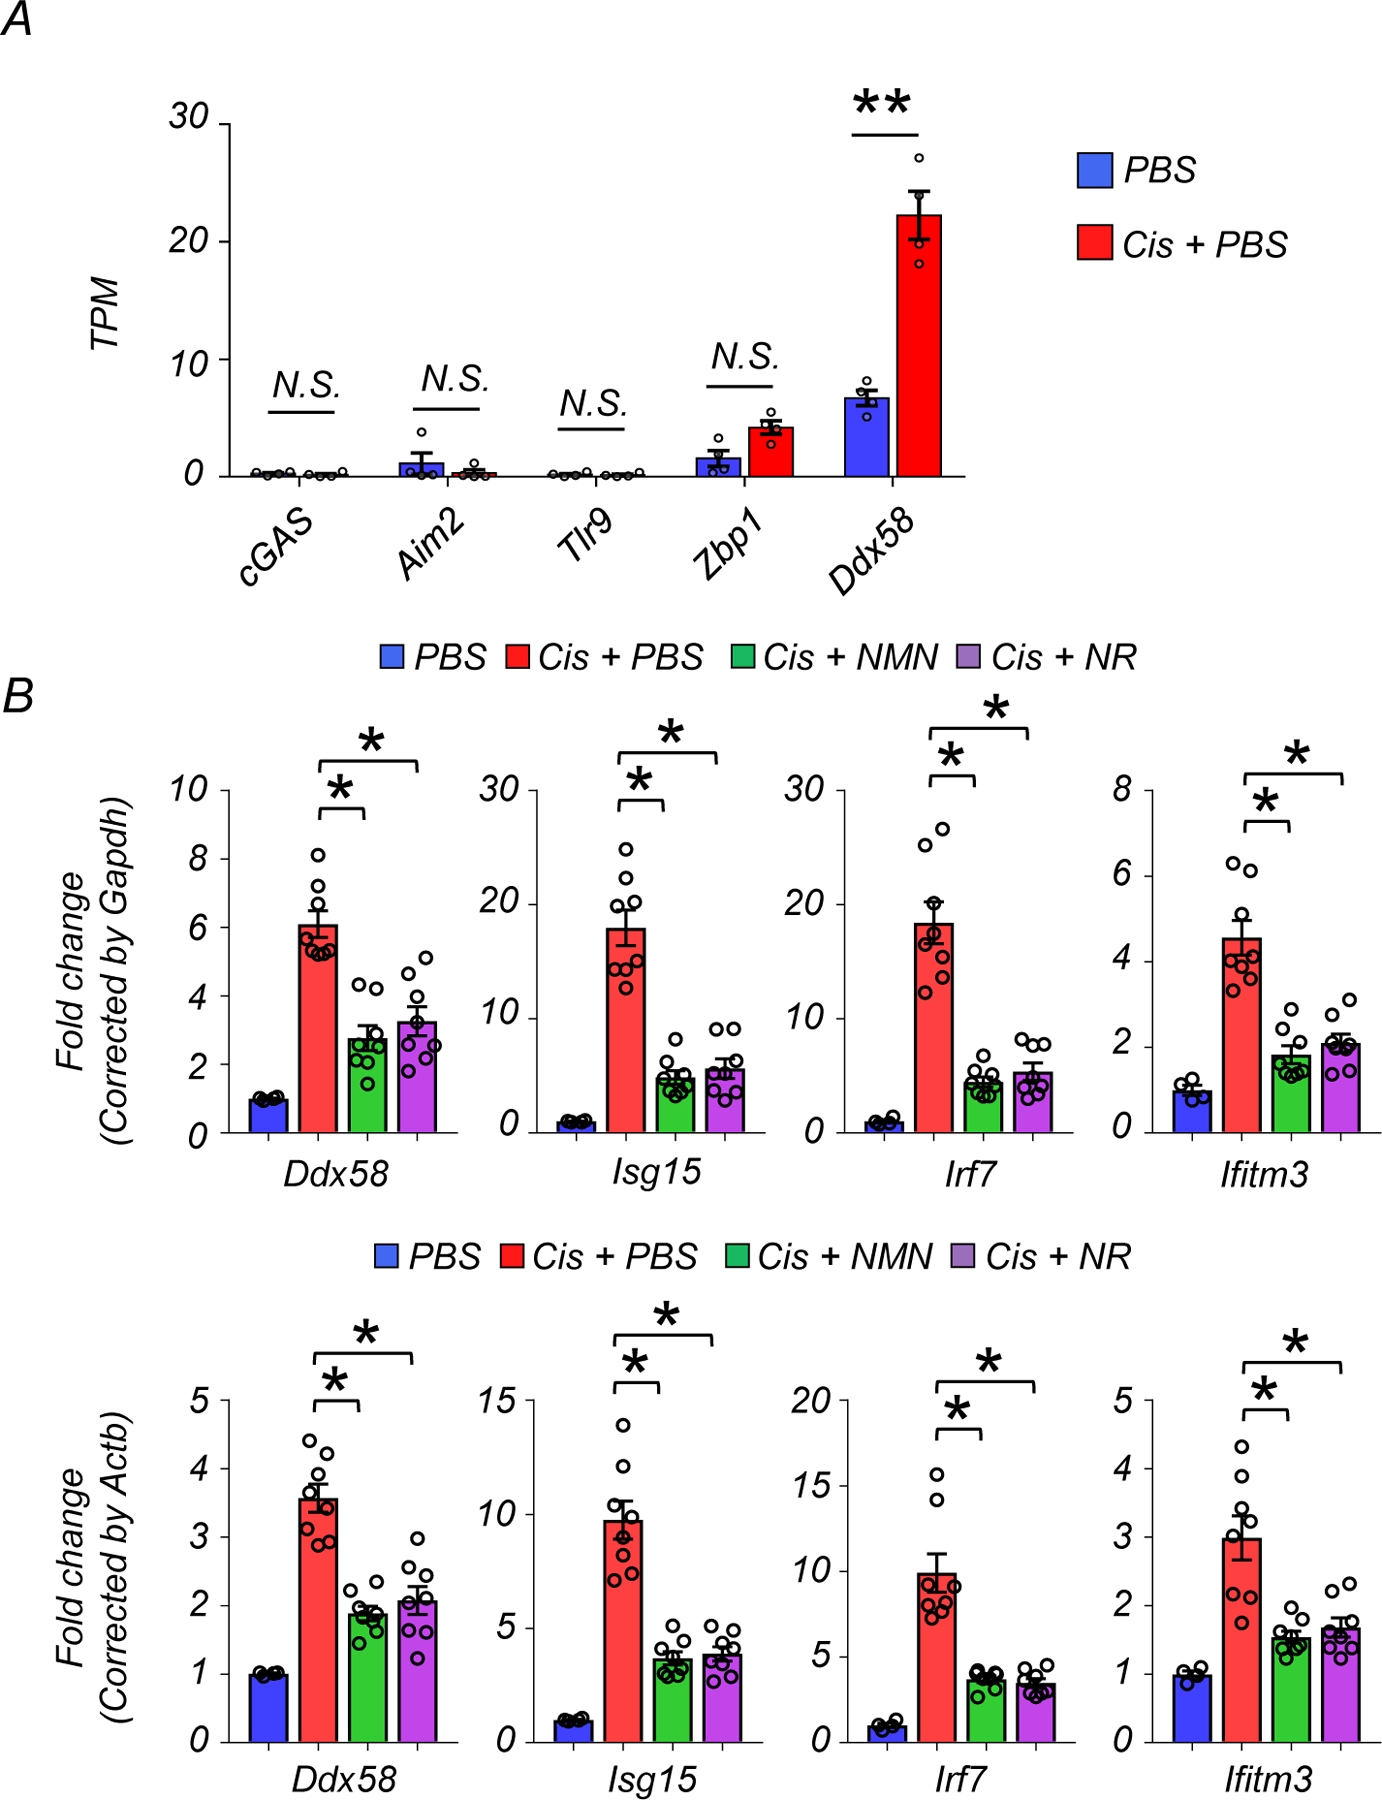
(A) TPM values of cGAS, Aim2, Tlr9, Zbp1, and Ddx58 in kidneys.
(B) Relative transcript levels of Ddx58, Isg15, Irf7, and Ifitm3 in in the kidneys of experimental groups (PBS n=4. Cis + PBS n=8. Cis + NMN n=8. Cis + NR n=8). Upper: Data were normalized using Gapdh. Lower; Data were normalized using Actb.
Data are presented as mean ± s.e.m. and were analyzed using a one-way ANOVA followed by Tukey post hoc test for multigroup comparison.
Extended Data Fig. 4. NMN and NR supplementation improved kidney function and lowered inflammation in IRI mouse kidney disease model.
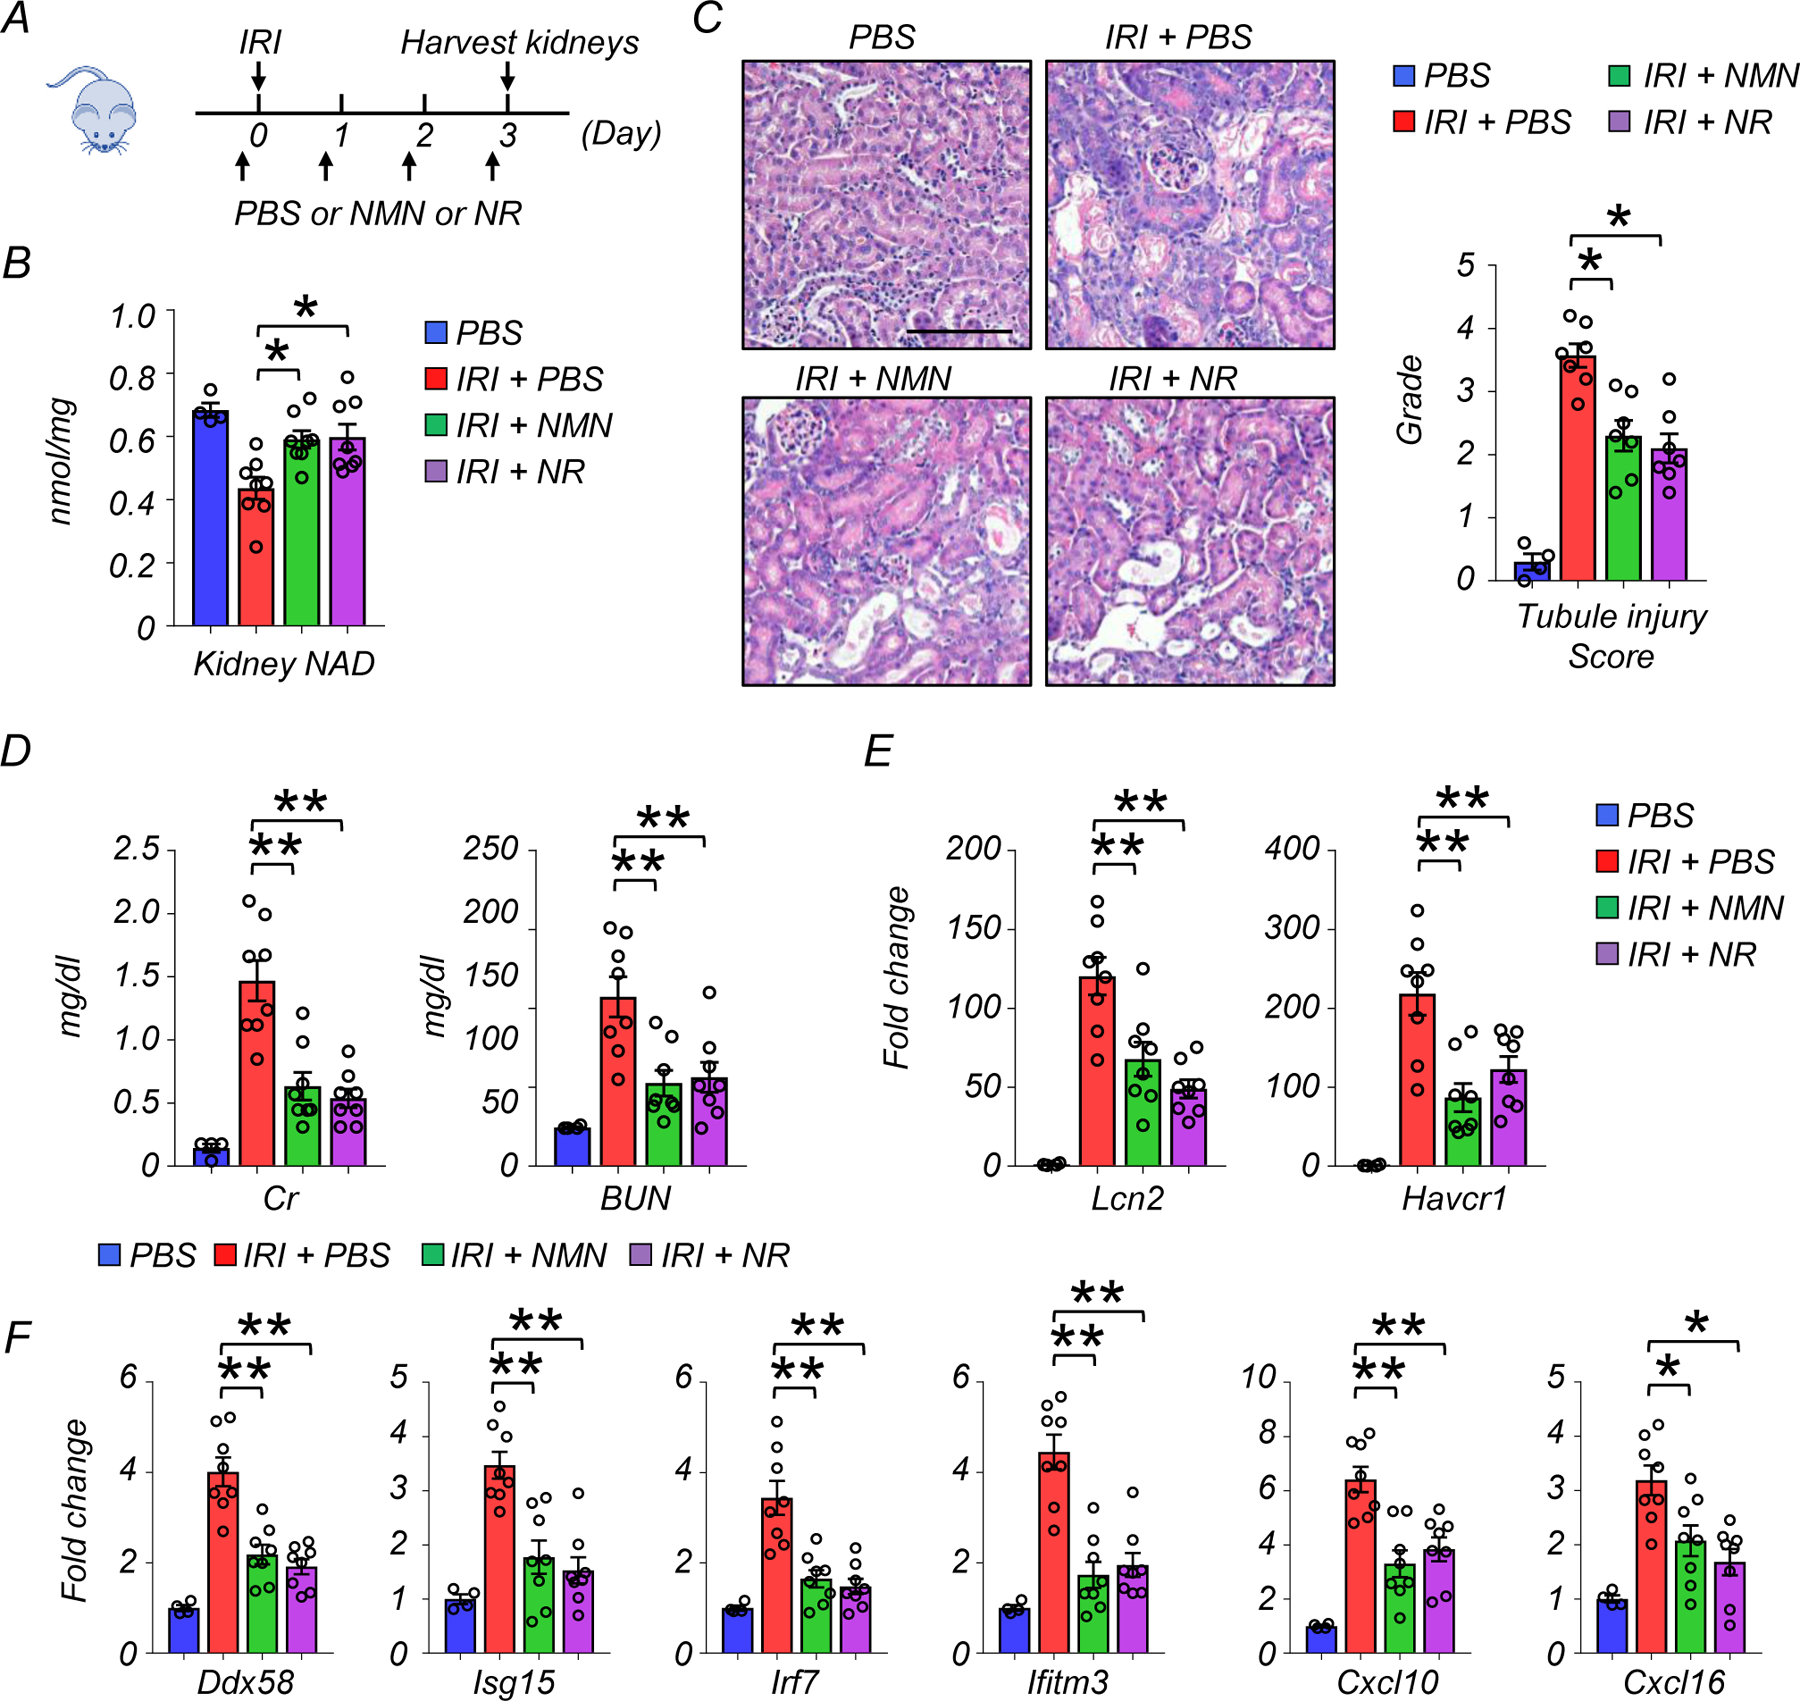
(A) The experiment designs. NAD+ precursors (NMN or NR) or vehicle (PBS) were injected i.p. for 4 consecutive days. First dose was injected 2 hours before IRI.
(B) Kidneys were collected 3 days after IRI. Kidney NAD+ levels in experimental groups. *p<0.05.
(C) Representative images of hematoxylin and eosin staining and semi-quantitative analysis of tubule injury in experimental groups. Scale bars: 20 μm. *p<0.05.
(D) Serum creatinine and blood urea nitrogen (BUN) levels in experimental groups. **p<0.01.
(E) Relative expression levels of Lcn2 and Havcr1 in the kidneys of mice in experimental groups. **p<0.01.
(F) Relative expression levels of Ddx58, Isg15, Irf7, ifitm3, Cxcl10, and Cxcl16 in the kidneys of mice in experimental groups. *p<0.05, **p<0.01.
(B-F) PBS n=4. Cis + PBS n=8. Cis + NMN n=8. Cis + NR n=8. Data are presented as mean ± s.e.m. and were analyzed using a one-way ANOVA followed by Tukey post hoc test for multigroup comparison.
Extended Data Fig. 5. The effect of NAD+ depletion by NAMPT inhibitor (FK866).
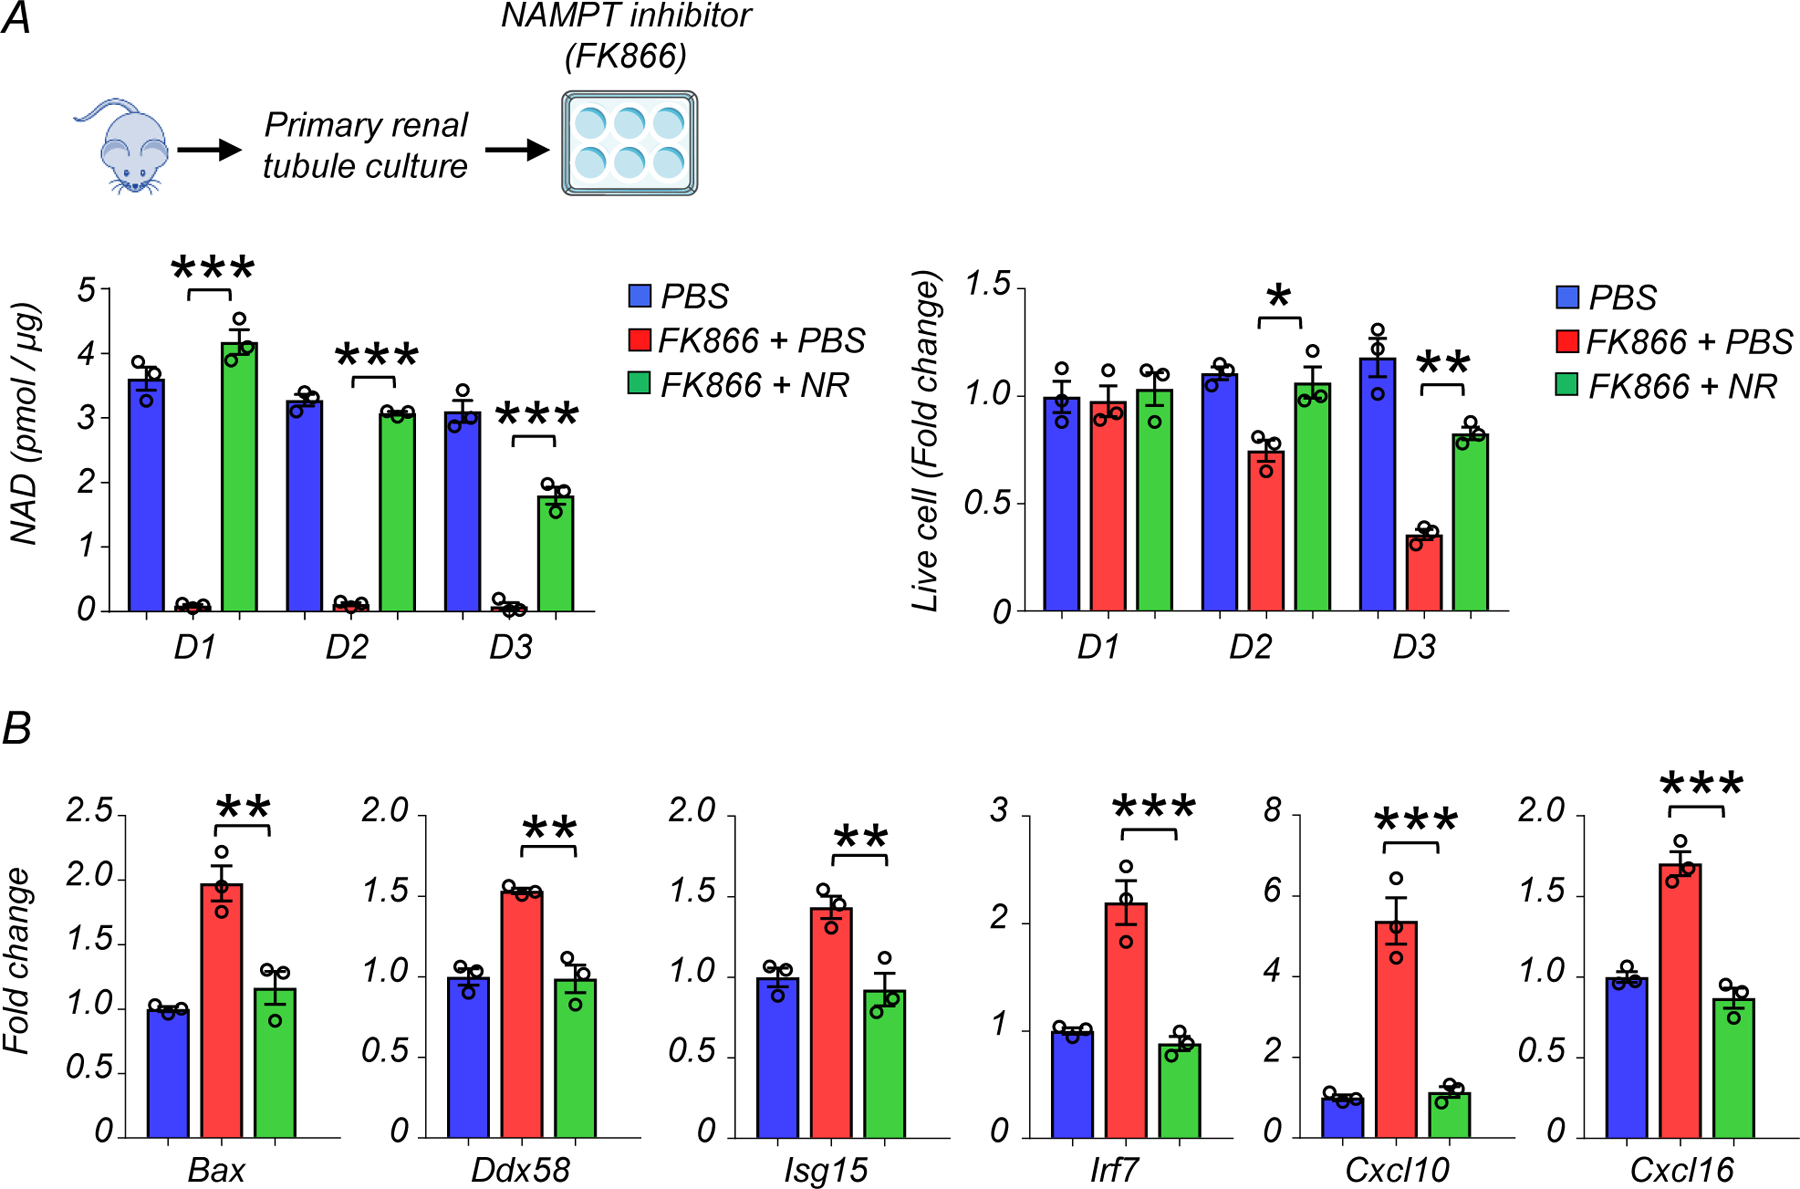
(A) Experimental design. Renal tubule cells were cultured and treated with NAMPT inhibitor, FK866 (100nM) for indicated days. NAD+ levels in renal tubule cells and changes in live cell numbers of experimental groups on day1 (D1), day2 (D2), and day3 (D3).
(B) Relative transcript levels of Bax, Ddx58, Isg15, Irf7, ifitm3, Cxcl10, and Cxcl16 in renal tubule cells of experimental groups on D2.
Gene expression levels were normalized to Gapdh.
(A, B) PBS n=3. FK866 + PBS n=3. FK866 + NR n=3. Data are presented as mean ± s.e.m. and were analyzed using a one-way ANOVA followed by Tukey post hoc test for multigroup comparison.
Extended Data Fig. 6. NAD+ precursors (NMN or NR) treatment restored mitochondria respiration capacity, lowered apoptosis, and improved energy production.
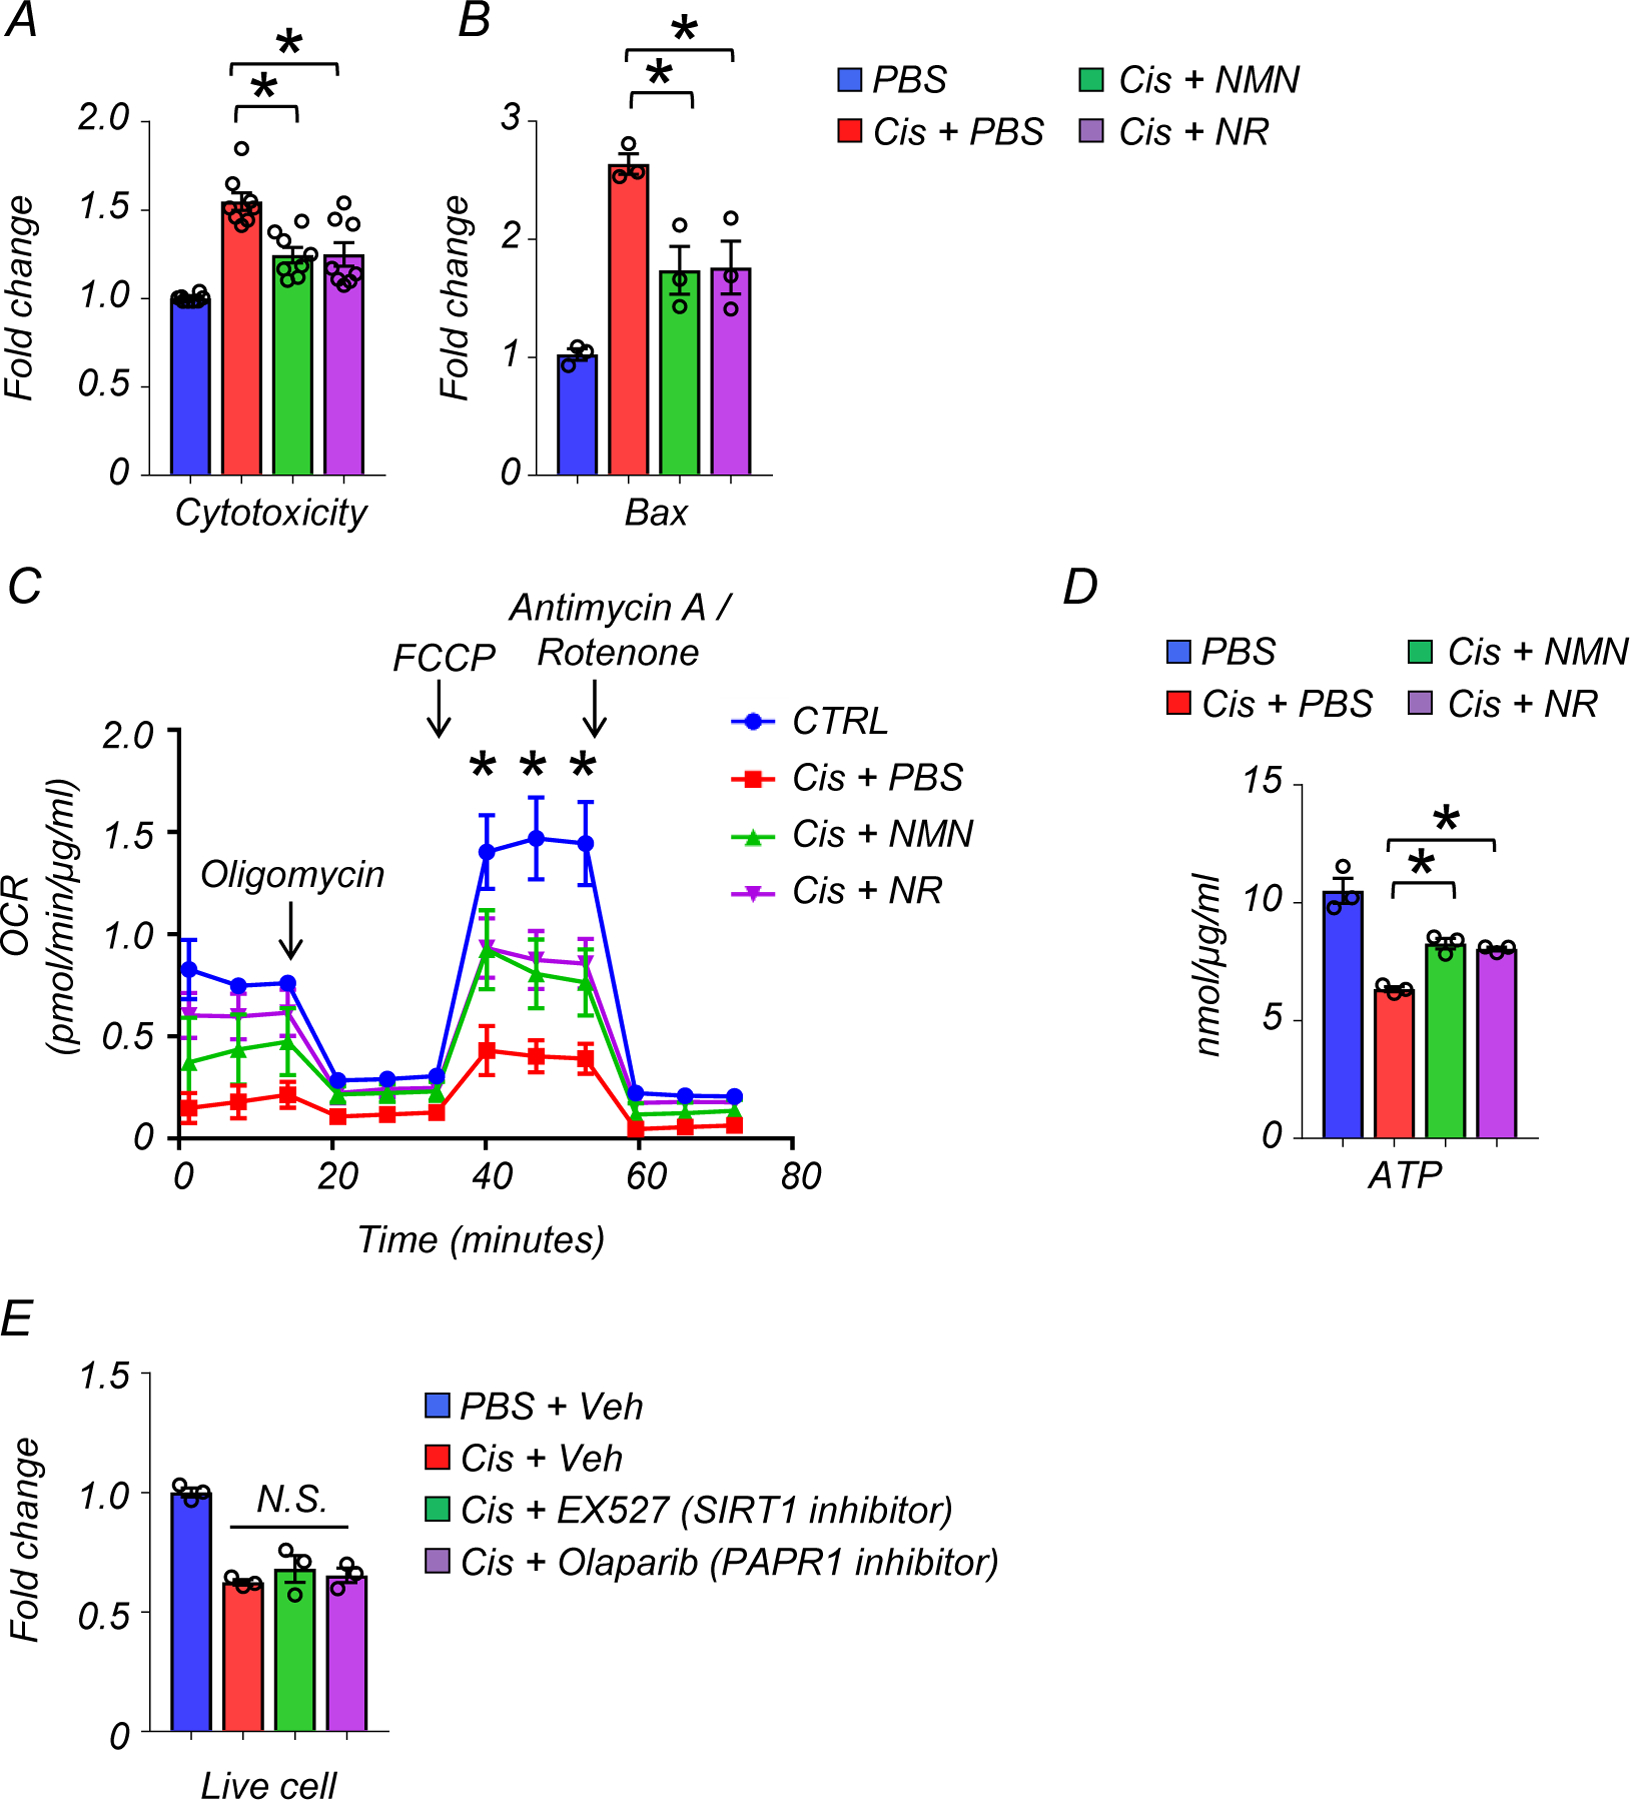
(A) Cytotoxicity assay. The data is as represented as fold-change normalized to control PBS group (n=8 in each group).
(B) Relative transcript levels of Bax in renal tubule cells of experimental groups (n=3 in each group). Gene expression levels were normalized to Gapdh.
(C) The result of oxygen consumption rate (OCR) in cultured renal tubule cells of experimental groups PBS n=6. Cis + PBS n=6. Cis +NMN n=5. Cis + NR n=5. *p<0.05. The data was normalized to total protein levels.
(D) ATP levels in renal tubule cells in experimental groups (n=3 in each group). *p<0.05. The data was normalized to total protein levels.
(E) Live cell numbers of cisplatin-treated renal tubule cells in indicated experiment groups (n=3 in each group). veh; vehicle control. N.S. not significant.
Data are presented as mean ± s.e.m. and were analyzed using a one-way ANOVA followed by Tukey post hoc test for multigroup comparison.
Extended Data Fig. 7. MitoTEMPO and BAX inhibitor reduced RIG-I cytosolic RNA sensing pathway induction in renal tubule cells.
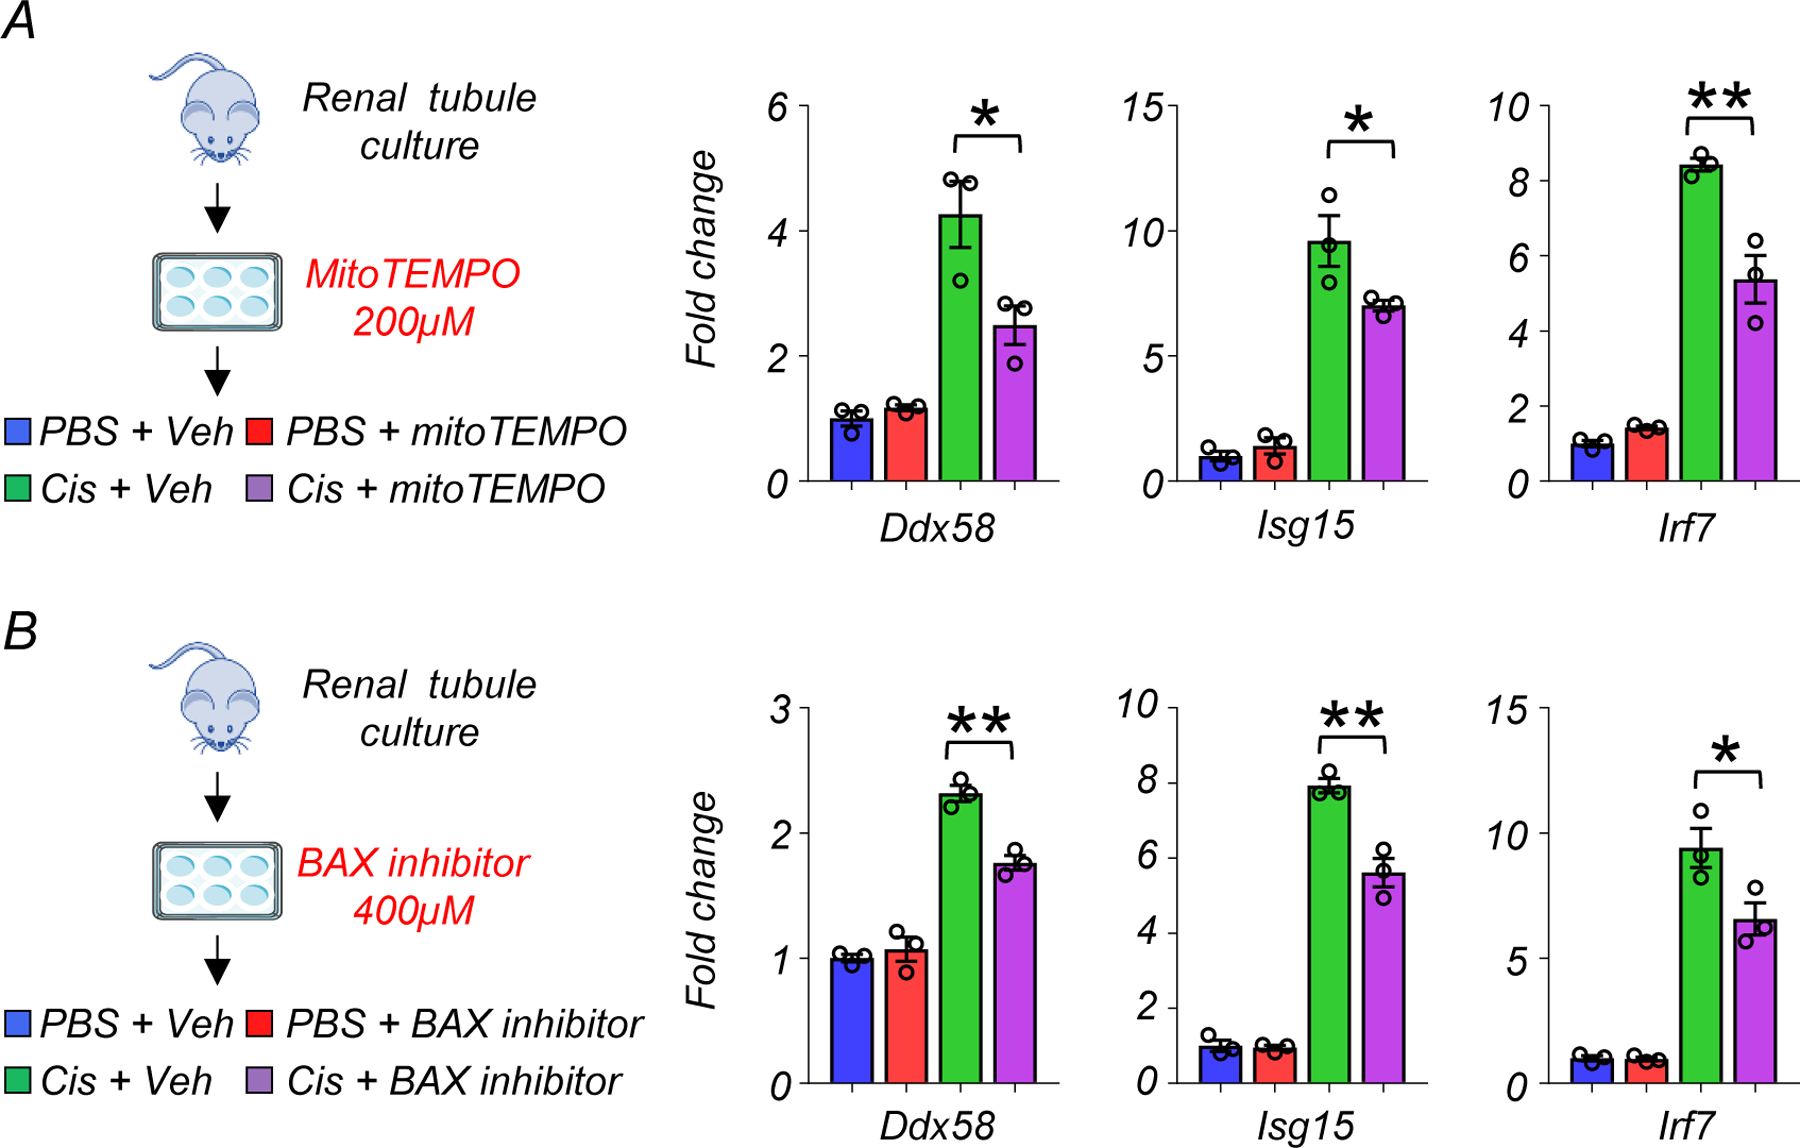
(A) (Left) The experimental design of the MitoTEMPO study (Right) Relative transcript levels of Ddx58, isg15, and Irf7 in experimental groups (n=3 in each group). Gene expression levels were normalized using Gapdh. veh; vehicle control. *p<0.05.
(B) (Left) The experimental design of the BAX inhibitor study (Right) Relative transcript levels of Ddx58, isg15, and Irf7 in experimental groups (n=3 in each group). Gene expression levels were normalized using Gapdh. veh; vehicle control. *p<0.05.
Data are presented as mean ± s.e.m. and were analyzed using a one-way ANOVA followed by Tukey post hoc test for multigroup comparison.
Extended Data Fig. 8. RIG-I depletion protected from kidney injury, cell death, and inflammation.
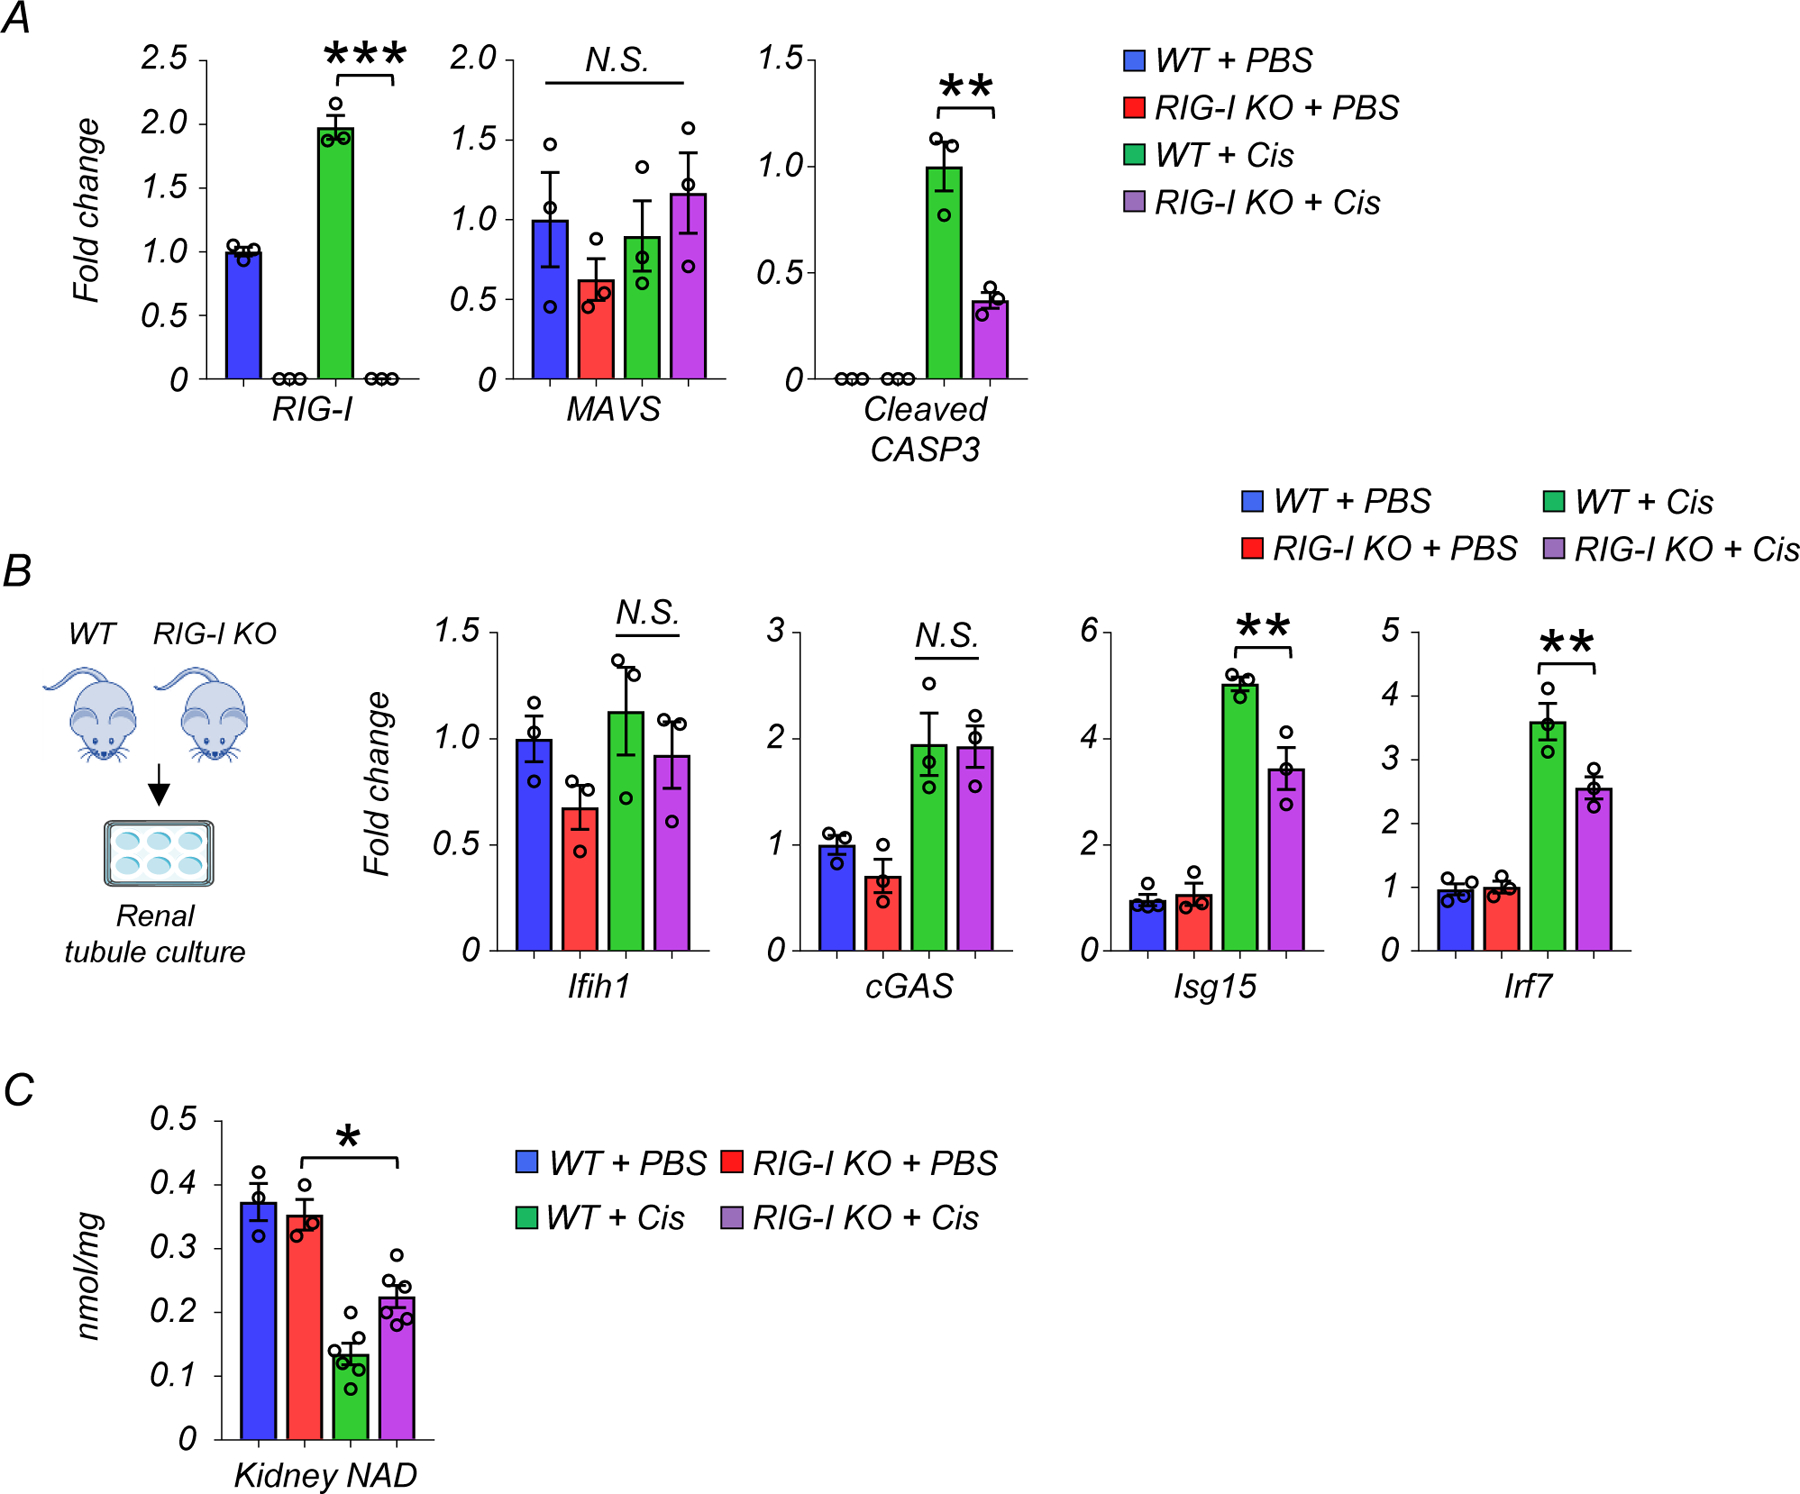
(A) Western blot quantification of RIG-I, MAVS, cleaved caspase-3 (cCASP3) in mice kidneys in indicated groups (n=3 in each group). *p<0.05, ***p<0.001. N.S. not significant.
(B) Experimental design. Renal tubule cells were isolated from WT and RIG-I KO mice. Relative transcript levels of Ifih1, cGAS, Isg15 and Irf7 in renal tubule cells of experimental groups (n=3 in each group). Gene expression levels were normalized to Gapdh. *p<0.05. N.S. not significant.
(C) Kidney NAD+ levels in experimental groups (WT + PBS n=4. RIG-I KO + PBS n=4. WT + Cis n=6. RIG-I KO + Cis n=6). *p<0.05.
Data are presented as mean ± s.e.m. and were analyzed using a one-way ANOVA followed by Tukey post hoc test for multigroup comparison.
Extended Data Fig. 9. The effect of MDA5 and cGAS deletion on expression of inflammatory molecules in cisplatin treated renal tubule cells.
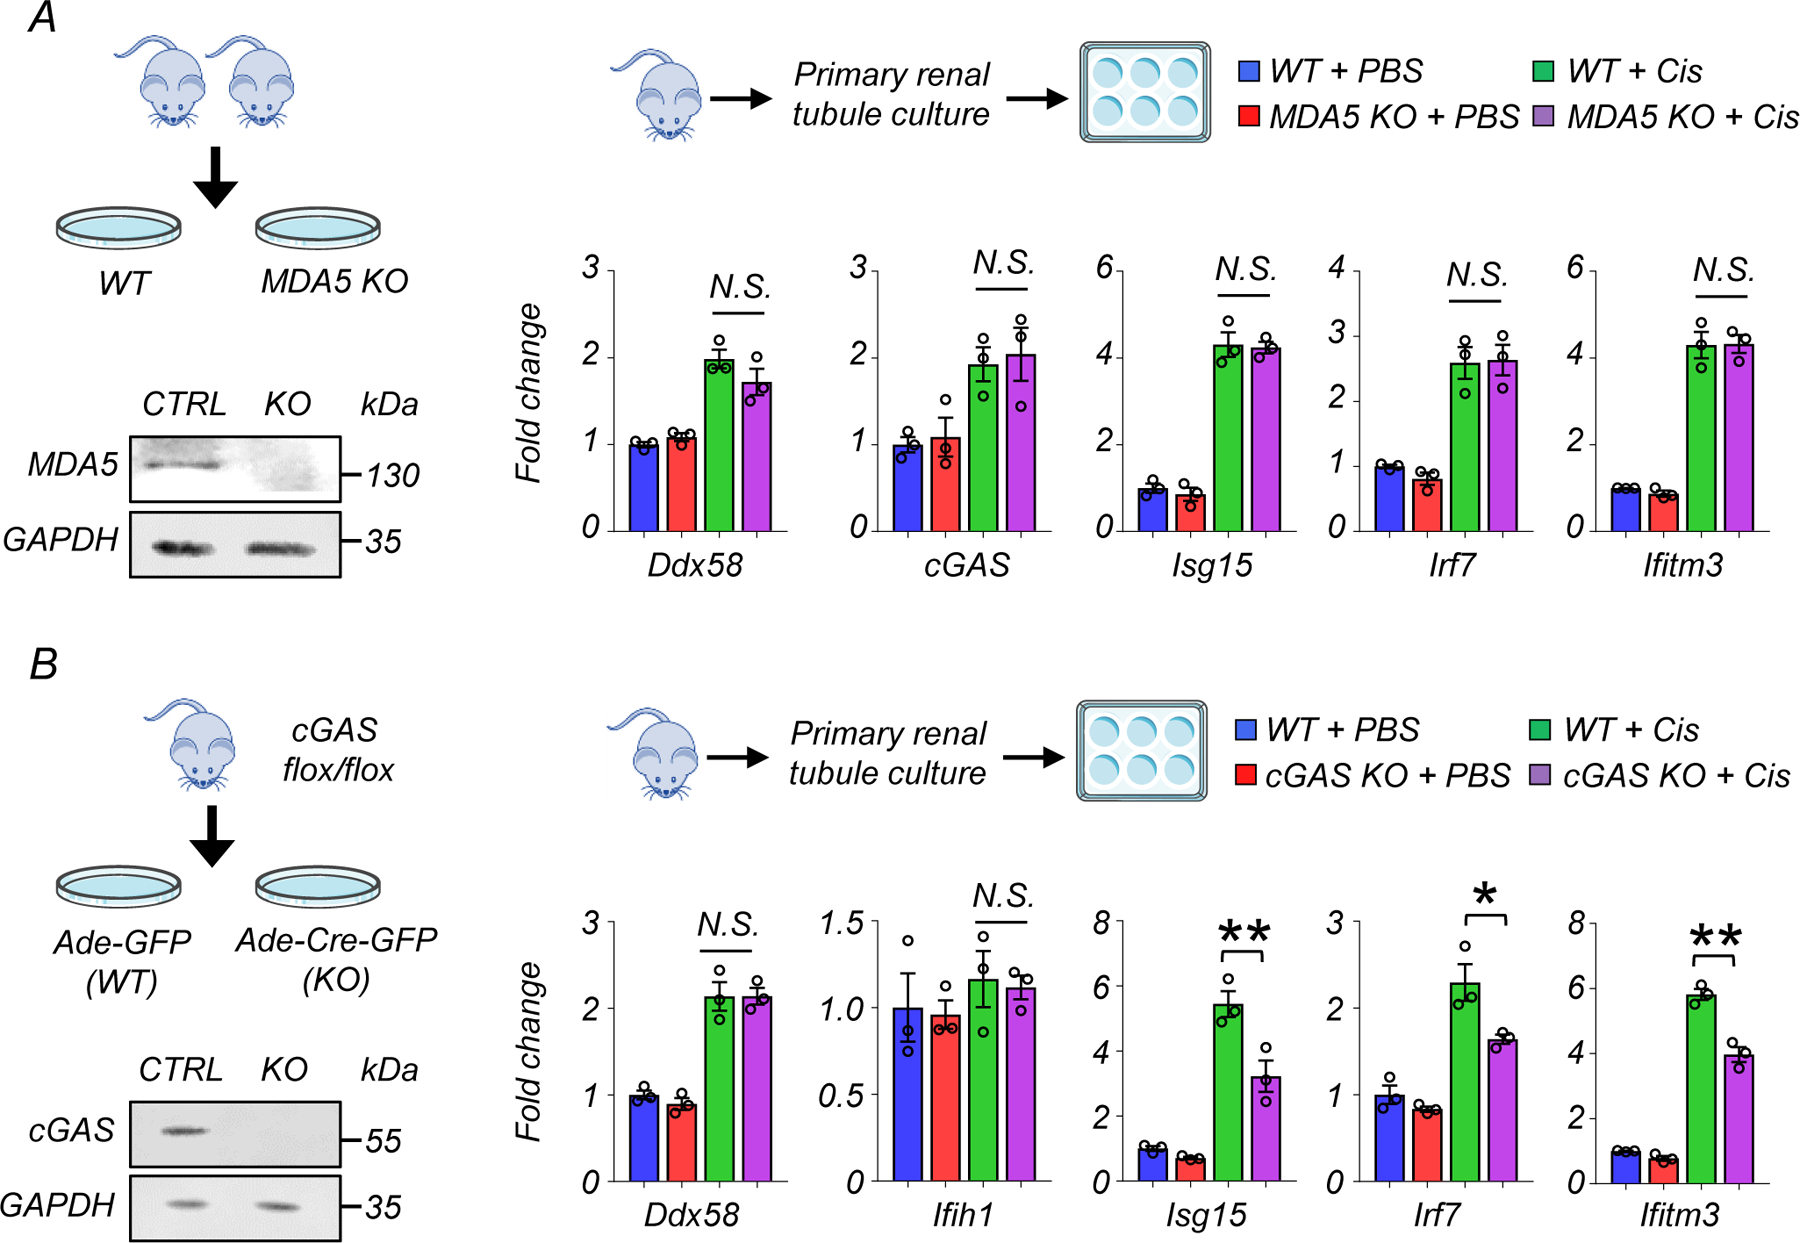
(A) Experimental design. Renal tubule cells were isolated from WT and MDA5 KO mice. Western blot image of MDA5 in renal tubule cells. Relative transcript levels of Ddx58, cGAS, Isg15, Irf7, and Ifitm3 in experimental groups (n=3 in each group). Gene expression levels were normalized to Gapdh. N.S. not significant.
(B) Experimental design. Renal tubule cells were isolated from cGAS flox/flox mice, and infected with Adenovirus-GFP (Ade-GFP) or Adenovirus-Cre-GFP (Ade-Cre-GFP). Western blot image of cGAS in renal tubule cells. Relative transcript levels of Ddx58, Ifih1, Isg15, Irf7, and Ifitm3 in experimental groups (n=3 in each group). Gene expression levels were normalized to Gapdh. N.S. not significant*p<0.05. N.S. not significant.
Data are presented as mean ± s.e.m. and were analyzed using a one-way ANOVA followed by Tukey post hoc test for multigroup comparison.
Extended Data Fig. 10. The correlation between the degree of renal fibrosis and expression of RIG-I and cytosolic RNA sensing pathway genes.
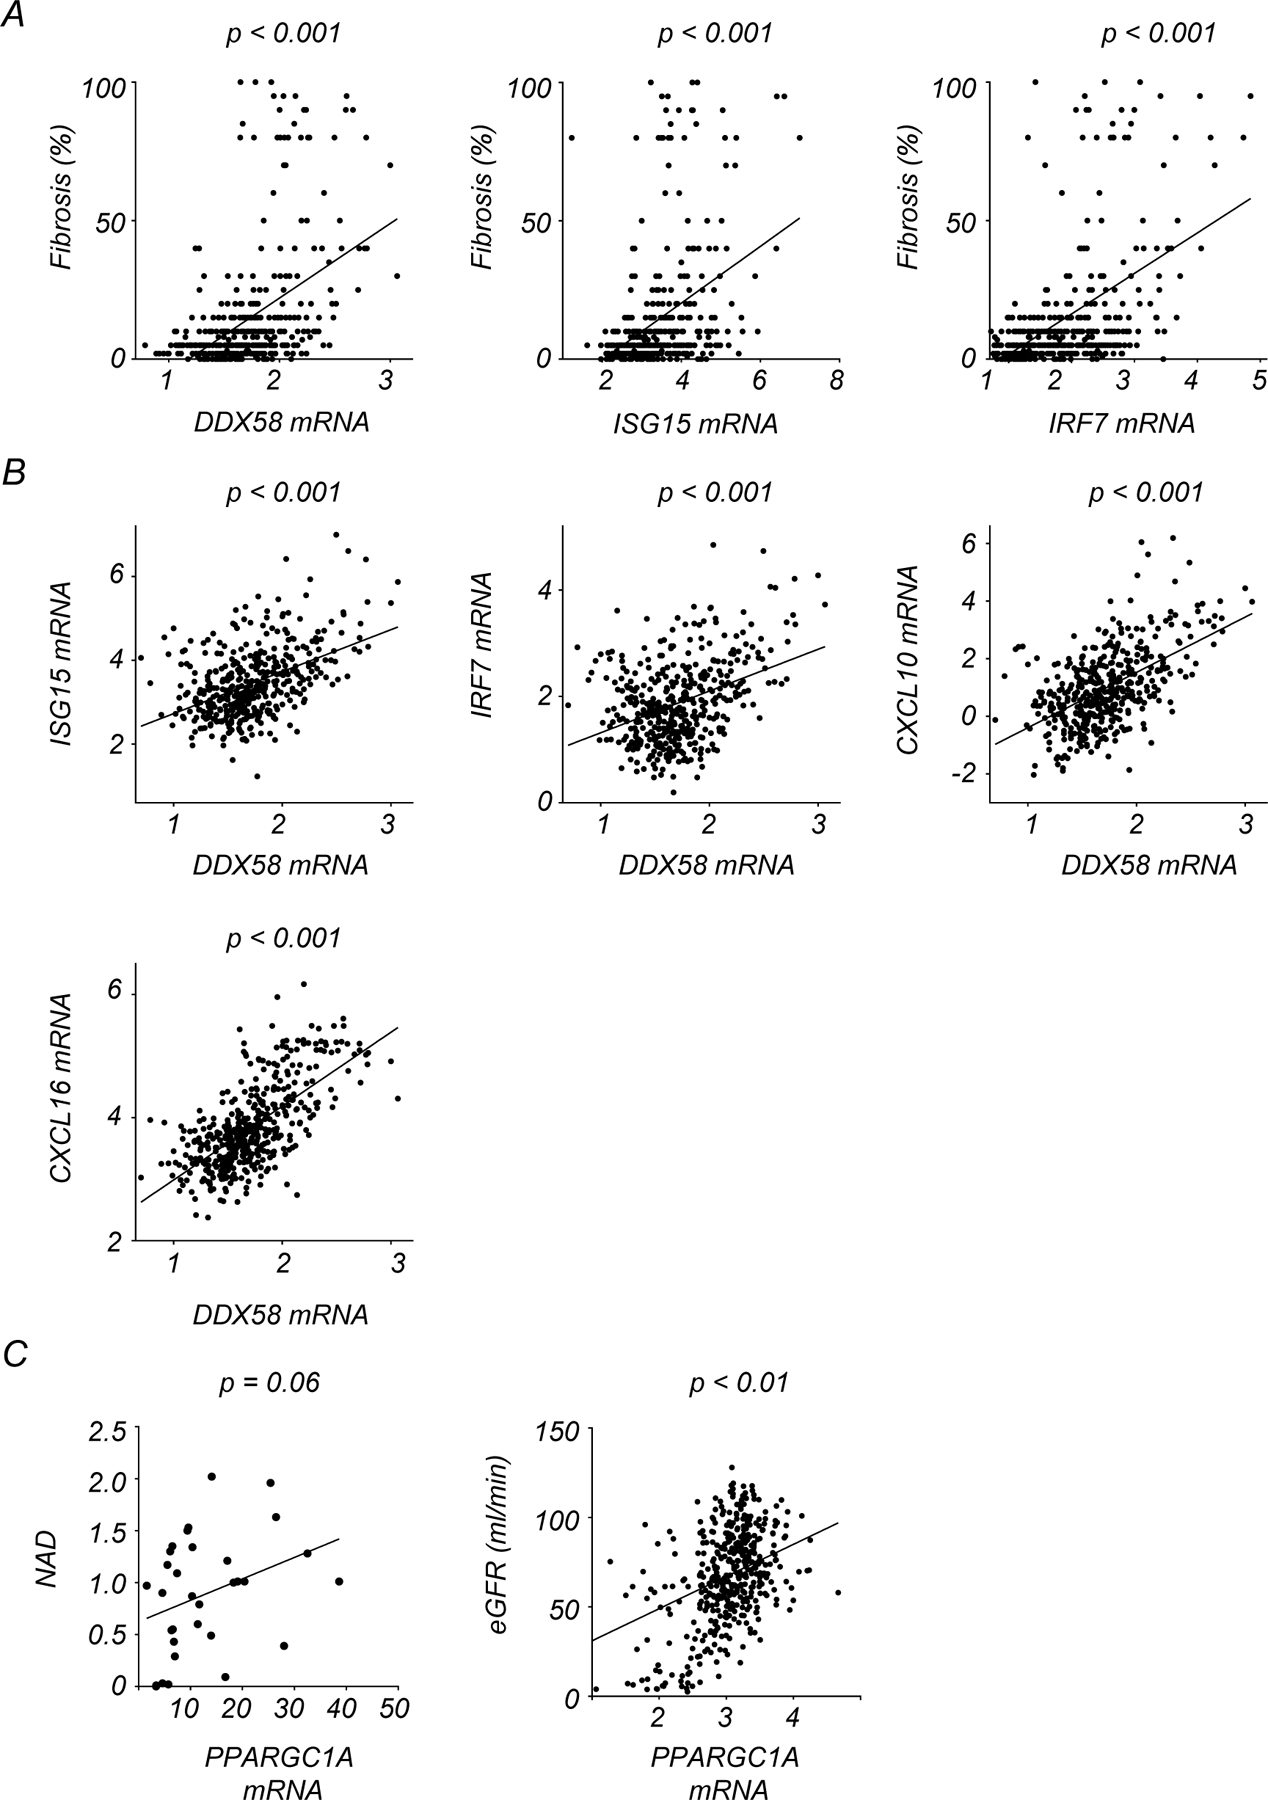
(A) Correlation between the degree of kidney fibrosis and normalized transcription levels of DDX58, ISG15, and IRF7 in human kidney samples.
(B) Correlation between transcription levels of DDX58 and ISG15, IRF7, CXCL10, and CXCL16 in human kidney samples.
(C) Correlation of relative transcript levels of PPARGC1A with kidney NAD+ levels and eGFR.
p-value was calculated by Person’s correlation.
Supplementary Material
Acknowledgments
This work has been supported by the National Institute of Health, in the Susztak lab NIH R01 DK087635, DK076077 and DK105821 and in the Baur lab by DK098656 and HL165792. Additional funding and research materials were provided by Metro International Biotech through a sponsored research agreement to JAB and KS. The authors thank the Molecular Pathology and Imaging Core (P30-DK050306) and Diabetes Research Center (P30-DK19525 and S10 OD025098) at University of Pennsylvania for their services.
Footnotes
Conflict of interest statement
Work in the Susztak lab is supported by Gilead, GSK, Boehringer, Regeneron, Novo Nordisk, Novartis, Calico, Astra Zeneca, Genentech, Ventus, and Maze biotech. J.A.B. is consultant to Pfizer and Cytokinetics, an inventor on a patent for using NAD+ precursors in liver injury and has received research funding and materials from Elysium Health and Metro International Biotech, both of which have an interest in NAD+ precursors. The remaining authors declare no competing interests.
Data availability
Gene expression data in this paper are deposited to GSE207587. The RNA-seq data for large-scale human kidney samples are available in GSE115098.
References
- 1.Doke T et al. Transcriptome-wide association analysis identifies DACH1 as a kidney disease risk gene that contributes to fibrosis. The Journal of clinical investigation 131 (2021). [DOI] [PMC free article] [PubMed] [Google Scholar]
- 2.Qiu C et al. Renal compartment-specific genetic variation analyses identify new pathways in chronic kidney disease. Nature medicine 24, 1721–1731 (2018). [DOI] [PMC free article] [PubMed] [Google Scholar]
- 3.Sheng X et al. Mapping the genetic architecture of human traits to cell types in the kidney identifies mechanisms of disease and potential treatments. Nature genetics 53, 1322–1333 (2021). [DOI] [PMC free article] [PubMed] [Google Scholar]
- 4.Liu BC, Tang TT, Lv LL & Lan HY Renal tubule injury: a driving force toward chronic kidney disease. Kidney Int 93, 568–579 (2018). [DOI] [PubMed] [Google Scholar]
- 5.Nadour Z et al. Validation of a liquid chromatography coupled to tandem mass spectrometry method for simultaneous quantification of tryptophan and 10 key metabolites of the kynurenine pathway in plasma and urine: Application to a cohort of acute kidney injury patients. Clinica chimica acta; international journal of clinical chemistry 534, 115–127 (2022). [DOI] [PubMed] [Google Scholar]
- 6.Xu J, Kitada M & Koya D NAD(+) Homeostasis in Diabetic Kidney Disease. Frontiers in medicine 8, 703076 (2021). [DOI] [PMC free article] [PubMed] [Google Scholar]
- 7.Ralto KM, Rhee EP & Parikh SM NAD(+) homeostasis in renal health and disease. Nature reviews. Nephrology 16, 99–111 (2020). [DOI] [PMC free article] [PubMed] [Google Scholar]
- 8.Tran MT et al. PGC1α drives NAD biosynthesis linking oxidative metabolism to renal protection. Nature 531, 528–532 (2016). [DOI] [PMC free article] [PubMed] [Google Scholar]
- 9.Jia Y et al. Nicotinamide Mononucleotide Attenuates Renal Interstitial Fibrosis After AKI by Suppressing Tubular DNA Damage and Senescence. Frontiers in physiology 12, 649547 (2021). [DOI] [PMC free article] [PubMed] [Google Scholar]
- 10.Morevati M et al. Effect of NAD+ boosting on kidney ischemia-reperfusion injury. PloS one 16, e0252554 (2021). [DOI] [PMC free article] [PubMed] [Google Scholar]
- 11.Myakala K et al. NAD metabolism modulates mitochondrial function and inflammation and prevents progression of diabetic kidney disease. bioRxiv, 2021.2012.2005.471273 (2021).
- 12.Zheng M et al. Nicotinamide reduces renal interstitial fibrosis by suppressing tubular injury and inflammation. Journal of cellular and molecular medicine 23, 3995–4004 (2019). [DOI] [PMC free article] [PubMed] [Google Scholar]
- 13.Liu X et al. Impaired Nicotinamide Adenine Dinucleotide Biosynthesis in the Kidney of Chronic Kidney Disease. Frontiers in physiology 12, 723690 (2021). [DOI] [PMC free article] [PubMed] [Google Scholar]
- 14.Poyan Mehr A et al. De novo NAD(+) biosynthetic impairment in acute kidney injury in humans. Nature medicine 24, 1351–1359 (2018). [DOI] [PMC free article] [PubMed] [Google Scholar]
- 15.Raines NH et al. Niacinamide May Be Associated with Improved Outcomes in COVID-19-Related Acute Kidney Injury: An Observational Study. Kidney360 2, 33–41 (2021). [DOI] [PMC free article] [PubMed] [Google Scholar]
- 16.Simic P et al. Nicotinamide riboside with pterostilbene (NRPT) increases NAD(+) in patients with acute kidney injury (AKI): a randomized, double-blind, placebo-controlled, stepwise safety study of escalating doses of NRPT in patients with AKI. BMC nephrology 21, 342 (2020). [DOI] [PMC free article] [PubMed] [Google Scholar]
- 17.Yoshino J, Baur JA & Imai SI NAD(+) Intermediates: The Biology and Therapeutic Potential of NMN and NR. Cell metabolism 27, 513–528 (2018). [DOI] [PMC free article] [PubMed] [Google Scholar]
- 18.Martin DR, Lewington AJ, Hammerman MR & Padanilam BJ Inhibition of poly(ADP-ribose) polymerase attenuates ischemic renal injury in rats. American journal of physiology. Regulatory, integrative and comparative physiology 279, R1834–1840 (2000). [DOI] [PubMed] [Google Scholar]
- 19.Doke T et al. Single-cell analysis identifies the interaction of altered renal tubules with basophils orchestrating kidney fibrosis. Nature immunology (2022). [DOI] [PubMed]
- 20.Tigano M, Vargas DC, Tremblay-Belzile S, Fu Y & Sfeir A Nuclear sensing of breaks in mitochondrial DNA enhances immune surveillance. Nature 591, 477–481 (2021). [DOI] [PubMed] [Google Scholar]
- 21.Dhir A et al. Mitochondrial double-stranded RNA triggers antiviral signalling in humans. Nature 560, 238–242 (2018). [DOI] [PMC free article] [PubMed] [Google Scholar]
- 22.Guan Y et al. Nicotinamide Mononucleotide, an NAD(+) Precursor, Rescues Age-Associated Susceptibility to AKI in a Sirtuin 1-Dependent Manner. Journal of the American Society of Nephrology : JASN 28, 2337–2352 (2017). [DOI] [PMC free article] [PubMed] [Google Scholar]
- 23.Rabb H et al. Inflammation in AKI: Current Understanding, Key Questions, and Knowledge Gaps. Journal of the American Society of Nephrology : JASN 27, 371–379 (2016). [DOI] [PMC free article] [PubMed] [Google Scholar]
- 24.Kirita Y, Wu H, Uchimura K, Wilson PC & Humphreys BD Cell profiling of mouse acute kidney injury reveals conserved cellular responses to injury. Proceedings of the National Academy of Sciences of the United States of America 117, 15874–15883 (2020). [DOI] [PMC free article] [PubMed] [Google Scholar]
- 25.Hasenberg A et al. Catchup: a mouse model for imaging-based tracking and modulation of neutrophil granulocytes. Nature methods 12, 445–452 (2015). [DOI] [PubMed] [Google Scholar]
- 26.Rehwinkel J & Gack MU RIG-I-like receptors: their regulation and roles in RNA sensing. Nature reviews. Immunology 20, 537–551 (2020). [DOI] [PMC free article] [PubMed] [Google Scholar]
- 27.Desjardins P, Frost E & Morais R Ethidium bromide-induced loss of mitochondrial DNA from primary chicken embryo fibroblasts. Mol Cell Biol 5, 1163–1169 (1985). [DOI] [PMC free article] [PubMed] [Google Scholar]
- 28.Kleih M et al. Direct impact of cisplatin on mitochondria induces ROS production that dictates cell fate of ovarian cancer cells. Cell death & disease 10, 851 (2019). [DOI] [PMC free article] [PubMed] [Google Scholar]
- 29.Redza-Dutordoir M & Averill-Bates DA Activation of apoptosis signalling pathways by reactive oxygen species. Biochimica et biophysica acta 1863, 2977–2992 (2016). [DOI] [PubMed] [Google Scholar]
- 30.Hou F et al. MAVS forms functional prion-like aggregates to activate and propagate antiviral innate immune response. Cell 146, 448–461 (2011). [DOI] [PMC free article] [PubMed] [Google Scholar]
- 31.Liu S et al. Phosphorylation of innate immune adaptor proteins MAVS, STING, and TRIF induces IRF3 activation. Science (New York, N.Y.) 347, aaa2630 (2015). [DOI] [PubMed] [Google Scholar]
- 32.Maekawa H et al. Mitochondrial Damage Causes Inflammation via cGAS-STING Signaling in Acute Kidney Injury. Cell reports 29, 1261–1273.e1266 (2019). [DOI] [PubMed] [Google Scholar]
- 33.Abedini A et al. Spatially resolved human kidney multi-omics single cell atlas highlights the key role of the fibrotic microenvironment in kidney disease progression. bioRxiv, 2022.2010.2024.513598 (2022).
- 34.McReynolds MR et al. NAD(+) flux is maintained in aged mice despite lower tissue concentrations. Cell systems 12, 1160–1172.e1164 (2021). [DOI] [PMC free article] [PubMed] [Google Scholar]
- 35.Liu L et al. Quantitative Analysis of NAD Synthesis-Breakdown Fluxes. Cell metabolism 27, 1067–1080.e1065 (2018). [DOI] [PMC free article] [PubMed] [Google Scholar]
- 36.Peng J et al. Clinical Implications of a New DDX58 Pathogenic Variant That Causes Lupus Nephritis due to RIG-I Hyperactivation. Journal of the American Society of Nephrology : JASN (2022). [DOI] [PMC free article] [PubMed]
- 37.Schoggins JW et al. Pan-viral specificity of IFN-induced genes reveals new roles for cGAS in innate immunity. Nature 505, 691–695 (2014). [DOI] [PMC free article] [PubMed] [Google Scholar]
- 38.Doke T et al. Genome-wide association studies identify the role of caspase-9 in kidney disease. Science advances 7, eabi8051 (2021). [DOI] [PMC free article] [PubMed] [Google Scholar]
- 39.Steen CB, Liu CL, Alizadeh AA & Newman AM Profiling Cell Type Abundance and Expression in Bulk Tissues with CIBERSORTx. Methods in molecular biology (Clifton, N.J.) 2117, 135–157 (2020). [DOI] [PMC free article] [PubMed] [Google Scholar]
- 40.Schindelin J et al. Fiji: an open-source platform for biological-image analysis. Nature methods 9, 676–682 (2012). [DOI] [PMC free article] [PubMed] [Google Scholar]
- 41.Doke T et al. Single-cell analysis identifies the interaction of altered renal tubules with basophils orchestrating kidney fibrosis. Nature immunology 23, 947–959 (2022). [DOI] [PubMed] [Google Scholar]
- 42.Mukherjee S et al. SIRT3 is required for liver regeneration but not for the beneficial effect of nicotinamide riboside. JCI insight 6 (2021). [DOI] [PMC free article] [PubMed] [Google Scholar]
Associated Data
This section collects any data citations, data availability statements, or supplementary materials included in this article.
Supplementary Materials
Data Availability Statement
Gene expression data in this paper are deposited to GSE207587. The RNA-seq data for large-scale human kidney samples are available in GSE115098.


