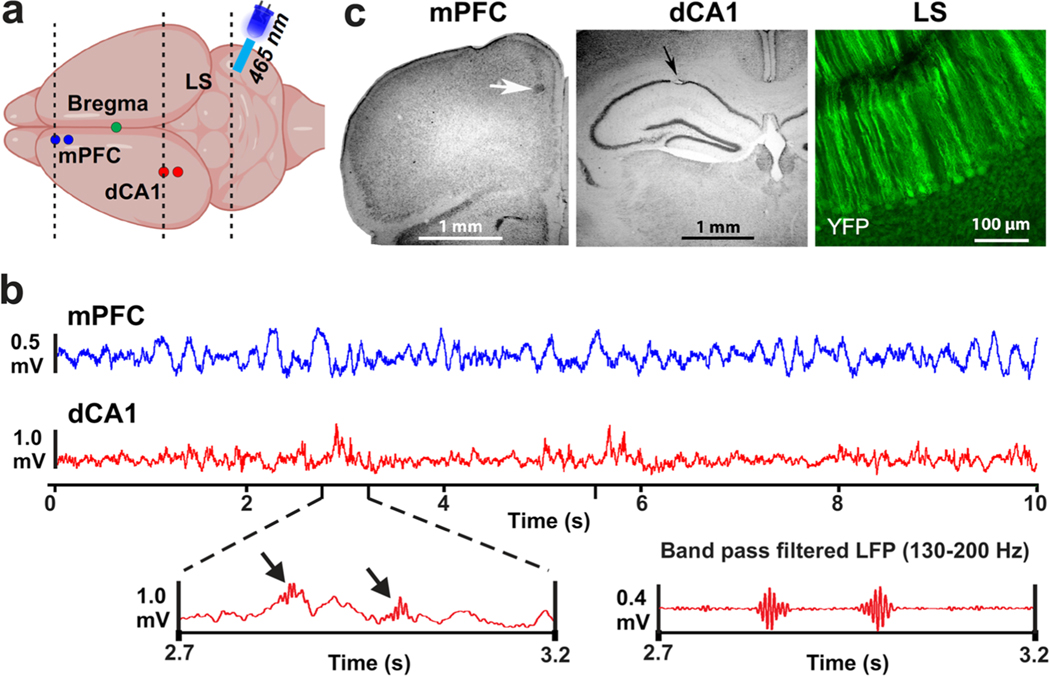
Fig. 2.
Illustration of recording locations, example data, and lesion sites. a Schematic drawing of the top view of a mouse brain with recording locations in the left mPFC and dCA1 marked with blue and red circles, respectively. The illustration above the cerebellum depicts an optical fiber coupled to an LED (465 nm) that was mounted over LS. Dashed lines indicate the approximate locations of coronal sections shown in panel (c). b Top traces are LFP signals recorded in the mPFC (blue) and dCA1 (red). The left bottom panel shows an enlarged sections of the dCA1 LFP that includes sharp-wave ripple activity indicated by black arrows. The bottom right panel shows a band pass filtered (130–200 Hz) version of the LFP on the left, highlighting the two sharp-wave ripple events. c Examples of electrolytic lesions (arrows) at recording sites in Nissl-stained sections of the mPFC and dCA1 region and a coronal section of cerebellar LS showing YFP expression in PCs of the L7-ChR2-GFP mice

