Abstract
Background
Lung cancer is the leading cause of cancer-related deaths worldwide, and despite recent advances in targeted therapies and immunotherapies, the clinical benefit remains limited. Therefore, there is an urgent need to further investigate the molecular mechanisms underlying lung cancer. The aim of this study was to investigate the expression and function of NPM3 in the tumor microenvironment of lung adenocarcinoma (LUAD).
Methods
We utilized bioinformatics tools and databases, including UALCAN, GEPIA2, HPA, and Sangerbox, to analyze NPM3 expression in LUAD samples and its association with prognosis and mutational landscape. NPM3 expression in various cell types was assessed at the single cell level using the TISCH database. We also used algorithms such as TIMER and EPIC to explore the crosstalk between NPM3 expression and immune features. KEGG enrichment analysis was performed to identify potential signaling pathways of NPM3. Finally, we employed siRNA knockdown strategy to investigate the effect of NPM3 on LUAD cell proliferation and migration in vitro.
Results
NPM3 was significantly upregulated in LUAD tissues and was strongly associated with poor prognosis and TP53 gene mutations. Single-cell sequencing analysis revealed that NPM3 was expressed in immune cells (dendritic cells and monocytes/macrophages) in the tumor microenvironment. Moreover, NPM3 expression was negatively associated with immune B cell and CD4 T cell infiltration, as well as with several immune-related genes (including CCL22, CXCR2, CX3CR1, CCR6, HLA-DOA, HLA-DQA2). KEGG enrichment analysis indicated that NPM3 expression was associated with cell cycle, CAMs, and NSCLC pathway genes. Finally, in vitro experiments showed that NPM3 knockdown inhibited LUAD cell proliferation and migration in NCI-H1299 and SPC-A1 cells, and suppressed the expression of CCNA2 and MAD2L1.
Conclusion
Elevated NPM3 expression predicts poor clinical outcome and an immunosuppressive microenvironment in LUAD tissues. NPM3 promotes LUAD progression by promoting cell proliferation and migration, and targeting NPM3 may represent a novel therapeutic strategy for LUAD.
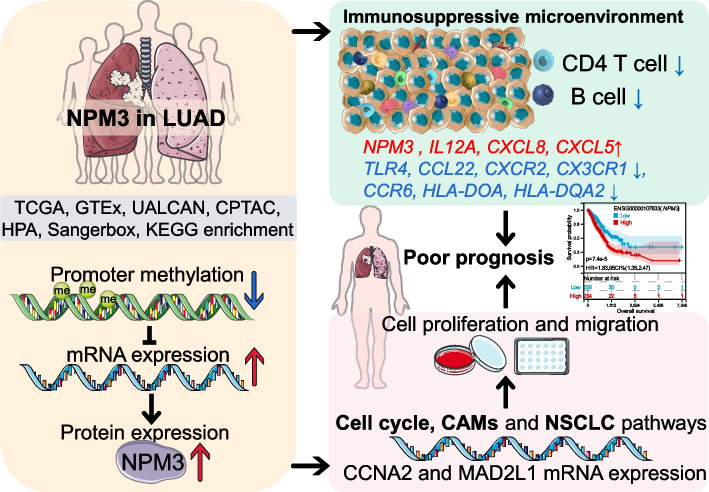
Graphical Abstract
Supplementary Information
The online version contains supplementary material available at 10.1186/s41065-023-00289-6.
Keywords: Lung adenocarcinoma, NPM3, Prognosis, Immune microenvironment, Cell proliferation, Cell migration
Introduction
Lung cancer is the leading cause of cancer mortality worldwide, accounting for 18% of all cancer deaths. In 2020, there were approximately 2.2 million new cases and 1.8 million deaths from lung cancer, making it the second most common cancer. The 5-year survival rate for lung cancer patients ranges from 10 to 20%, which is significantly lower compared to other cancers [1]. The most recent cancer statistics report from the United States revealed that lung cancer is the leading cause of cancer deaths for adults aged 50 and over, exceeding the combined deaths caused by breast cancer, prostate cancer, and colorectal cancer [2]. Lung cancer is a complex and heterogeneous disease that is classified into non-small cell lung cancer (NSCLC) and small cell lung cancer based on histological categories. NSCLC is responsible for 85–90% of all lung cancers, with lung adenocarcinoma (LUAD) accounting for approximately 40% of NSCLC cases [3–5]. Despite significant improvements in treatment options, such as surgery, radiation therapy, targeted therapy, and immunotherapy, lung cancer remains an incurable disease for most patients [6, 7] Therefore, understanding the molecular heterogeneity and exploring of the relationship between oncogenes and tumor microenvironment underlying lung cancer will contribute to the development of novel targeted drugs.
Nucleophosmin 3 (NPM3) is a member of the nucleophosmin/nucleoplasmin family and encodes proteins associated with the molecular chaperones nucleoplasmin and nucleophosmin [8]. NPM comprises an N-terminus domain (protein binding), an acidic domain (histone binding) and a C-terminus nucleic acid binding domain. The acidic domain contains multiple potential phosphorylation sites and putative nuclear localization signals. NPM3 was found to be strongly expressed in all 16 human tissues, with particularly strong expression in the pancreas and testis, while the lung exhibited the lowest expression levels. Subcellular fraction analysis showed that NPM3 protein was localized only in the nucleus [9].
During retinoic acid-induced differentiation, NPM3 protein was reduced and the expression level of NPM3 was higher in undifferentiated cells. NPM3 also acts as a chromatin remodeling protein responsible for the unique chromatin structure and replication ability of embryonic stem (ES) cells and facilitates ES cell proliferation [10]. Furthermore, the interaction between NPM3 and transition protein 2 (TP2) is blocked by the histone acetylase p300, altering the DNA condensation properties during mammalian spermiogenesis [11]. Importantly, NPM3 was found to be abundantly expressed in adipose tissue and participated in adipose metabolism. The expression of NPM3 in small extracellular vesicles (sEV-AT) derived from adipose tissue was remarkably reduced in obese individuals compared to lean individuals [12]. NPM3 carried by sEV-AT regulates the PRDM16 mRNA stability, which in turn facilitates white adipose tissue browning [13]. However, the effect of NPM3 on LUAD progression and its relationship with the tumor microenvironment are not yet clear.
In this study, we comprehensively characterized the expression of NPM3 on tumor cells and immune cells in lung adenocarcinoma tissues, and evaluated the correlation between NPM3 expression and clinical prognosis, gene mutations, immune cell infiltration, or immune regulatory genes using multiple biological databases. Then, we attempted to uncover the mechanism by which NPM3 exerts its function using KEGG enrichment analysis. To conclude, we investigated the impact of NPM3 on cell migration or growth using multiple biological functional assays in LUAD cell lines NCI-H1299 and SPC-A1, and profiled the downstream genes regulated by NPM3.
Materials and methods
Gene expression, promoter methylation level and protein expression analysis
All database information involved in this study is listed in Table 1. We utilized the UALCAN database to analyze the expression and promoter methylation levels of NPM3, GLRX3, and CALCOCO1 genes in TCGA samples, as well as the protein expression of NPM3 in CPTAC samples [14]. We obtained the immunohistochemical staining data of NPM3 using the HPA database [15]. Furthermore, we analyzed the NPM3 expression in TCGA and GTEx samples using the GEPIA2 database [16].
Table 1.
Summary of databases used in this study
| Name | Abbreviation | Link |
|---|---|---|
| The University of ALabama at Birmingham CANcer data analysis Portal | UALCAN | http://ualcan.path.uab.edu/ |
| Human Protein Atlas | HPA | https://www.proteinatlas.org/ |
| The cBioPortal for Cancer Genomics | cBioPortal | https://www.cbioportal.org/ |
| Sangerbox Database | Sangerbox | http://sangerbox.com/home.html |
| STRING Database | STRING | https://string-db.org/cgi/input.pl |
| Gene Expression Profiling Interactive Analysis 2 | GEPIA2 | http://gepia2.cancer-pku.cn/#index |
| University of California Santa Cruz | UCSC | https://xenabrowser.net/ |
| Tumor Immune Single-cell Hub 2 | TISCH | http://tisch.comp-genomics.org/home/ |
Prognosis analysis
We analyzed the relationship between NPM3 expression and Overall Survival (OS), Disease Free Survival (DFS), Progression Free Interval (PFI) or Disease Free Interval (DFI) using the Sangerbox database [17]. Briefly, we calculated the optimal cut-off values for NPM3 using the R package maxstat (Maximally selected rank statistics with several p-value approximations version: 0.7–25), and patients were divided into high and low NPM3 expression groups. Prognosis was analyzed using the survfit function of the R package survival [18], and differences in prognosis between the groups were evaluated using the log-rank test method. We also analyzed the influence of GLRX3, and CALCOCO1 on the survival of LUAD patients using the UALCAN database [14].
Gene expression and mutational landscape
We analyzed the mutation profile of the NPM3 gene in lung adenocarcinoma using the cBioPortal database [19]. We also analyzed the relationship between NPM3 expression and the gene mutation landscape using the Sangerbox database [17]. Specifically, we analyzed the mutation landscape in 513 lung adenocarcinoma samples and assessed the variation of mutation frequencies between high and low NPM3 expression group samples using the chi-square test.
The crosstalk between NPM3 and immune microenvironment
We investigated NPM3 expression in immune cells within the LUAD microenvironment at the single-cell level using the TISCH database [20]. Furthermore, we analyzed the relationship between NPM3 expression and immune cell infiltration or immune-related genes using the Sangerbox database [17]. To do this, we used the ESTIMATE algorithm to evaluate the relationship between NPM3 expression and ESTIMATE score, immune score, or stromal score [21], the relationship between NPM3 expression and immune cell infiltration was analyzed using TIMER [22], EPIC [23] or QUANTISEQ [24] algorithms. Finally, we used Spearman's correlation to assess the relationship between NPM3 and immune modulator (immune checkpoint, chemokine, chemokine receptor, MHC) expression. Briefly, we downloaded the uniformly normalized dataset from the UCSC (https://xenabrowser.net/) database, and extracted the expression data of ENSG00000107833 (NPM3) gene in each LUAD sample. We then performed log2(x + 0.001) transformation on the gene expression data and mapped the gene expression profile to Gene Symbol. Finally, we reassessed the immune cell infiltration score of each patient based on gene expression using the TIMER [22], EPIC [23] or QUANTISEQ [24] method of R package IOBR [25].
Co-expressed genes and KEGG enrichment analysis
We obtained 608 positively and 189 negatively associated genes (absolute value of Pearson r ≥ 0.3) with NPM3 using the UALCAN database [14], and performed KEGG enrichment analysis [26] for each of these two gene sets. Briefly, we used the KEGG rest API (https://www.kegg.jp/kegg/rest/keggapi.html) to obtain the latest KEGG Pathway gene annotations as background, mapped the genes to the background set, and the R package clusterProfiler [27] was used for enrichment analysis to obtain the results of gene set enrichment. A minimum gene set was set at 5 and a maximum gene set at 5000, p value < 0.05 and FDR < 0.25 were considered statistically significant.
Cell culture and small interfering RNA (siRNA) transfection
We purchased NCI-H1299, SPC-A1 lung adenocarcinoma cell lines from the Chinese Academy of Sciences Shanghai Cell Bank. They were cultured in a constant temperature incubator containing 5% CO2 at 37 ℃ as required. Small interfering RNA transfection procedures were performed according to the instructions of the GP-transfect-Mate transfection reagent (GenePharma, Shanghai, China). The siRNA used in this study was purchased from KeyGEN BioTECH (Nanjing, China) and the sequences are siNPM3#1 sense, AGGUAGAGGAAGAGGAUGATT, antisense, UCAUCCUCUUCCUCUACCUTT; siNPM3#2 sense, GGACAGUGAUGAGGAAGAATT, antisense, UUCUUCCUCAUCACUGUCCTT.
RNA extraction, reverse transcription and real-time fluorescence quantitative PCR (qPCR) experiments
The RNA extraction procedure in this study was performed according to the manufacturer's instructions of the TransZol Up Plus RNA Kit (TransGen Biotech #ER501, Beijing, China). Briefly, lung adenocarcinoma cells were collected using TRizol up, RNA was isolated and cleaned using several reagents supplied as part of the kit, and RNA concentration and purity were measured. The reverse transcription experiments were performed referring to the manufacturer's instructions of HiScript III All-in-one RT SuperMix Perfect for qPCR (Vazyme, #R333, Nanjing, China). The qPCR experiments were performed on the Applied Biosystems® 7500 Fast (Applied Biosystems, USA) using Taq Pro Universal SYBR qPCR Master Mix (Vazyme #Q712, Nanjing, China). The primer sequences used in this study are listed in Supplementary Table S1.
Cell cloning experiments and CCK-8 experiments
After transfection of siRNA for 48 h in NCI-H1299 and SPC-A1 cells, 1000 cells were collected for clone formation assay, and clone size was observed after 14 days. Cells were fixed with paraformaldehyde and stained with 0.1% crystal violet.
After transfection of siRNA for 48 h in NCI-H1299 and SPC-A1 cells, 2000 cells were collected for CCK-8 experiments, three replicate wells were set up, the absorbance at 450 nm was measured using CCK-8 solution on 0, 2, 4, 6 days respectively, and the cell growth rate was calculated.
Cell scratching experiments and transwell experiments
Cell scratching experiments were performed following transfection of siRNA for 48 h in NCI-H1299 and SPC-A1 cells, and cell migration was recorded by microscopy at 0 h, 18 h, and 24 h, respectively.
For transwell experiments, siRNA was transfected for 48 h in NCI-H1299 and SPC-A1 cells. Subsequently, 100 µl of medium containing 2*10^4 cells with 10% serum was added to the upper chamber of the transwell, and 600 µl of medium with 20% serum was added to the lower chamber of the transwell. After 24 h, cells were fixed using anhydrous ethanol, stained using 0.1% crystal violet, and photographed under the microscope to record the staining.
Statistical analysis
Analyses and graphical presentation were performed using the GraphPad Prism 8.0 software. Unless stated otherwise, single comparison was performed by a two tailed Student’s t test, multiple comparisons were analyzed by One-way ANOVA. The Mann–Whitney U test was used for non-normal distribution. The patient survival curves were presented by the Kaplan–Meier method and the difference was determined using a log-rank test. Differences in the frequency of gene mutations among high and low NPM3 expression samples were assessed using a chi-square test. Pearson's correlation coefficient was used to determine the relationship between gene expression and immune infiltration. Spearman's correlation coefficient was used to assess gene expression correlation. Differences with * P < 0.05, ** P < 0.01, and *** P < 0.001 were considered significant.
Results
The NPM3 expression and its relationship with clinical parameters in LUAD
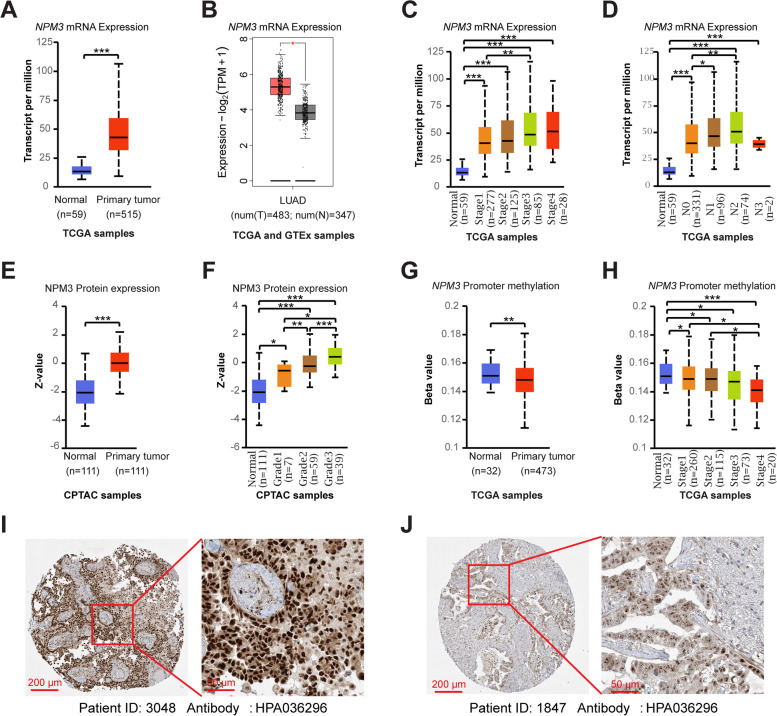
To determine the differences of NPM3 expression between normal and tumor tissues, we analyzed the NPM3 mRNA expression in TCGA-LUAD and GTEx samples using the UALCAN and GEPIA2 databases. We found that NPM3 mRNA expression was significantly elevated in LUAD tissues (Fig. 1A-B). We additionally investigated the association between NPM3 and clinical parameters, and the results indicated that NPM3 mRNA expression was significantly elevated in patients with advanced clinical Stage and N staging (Fig. 1C-D), irrespective of patients' gender, age, race and smoking habits (Supplementary Figure S1). We further analyzed the promoter methylation level of NPM3 in TCGA-LUAD samples using the UALCAN database. The results indicated that the promoter methylation level of NPM3 was significantly decreased in tumors and negatively correlated with the clinical Stage of patients (Fig. 1E-F), implying that the elevated mRNA expression of NPM3 appeared potentially driven by the decreased promoter methylation level. More importantly, we analyzed NPM3 protein expression utilizing the UALCAN and HPA databases. We found that NPM3 protein expression was significantly elevated and positively correlated with clinical Grade in CPTAC-LUAD samples (Fig. 1G-H). Immunohistochemical staining results revealed that NPM3 protein is expressed in the nucleus (Fig. 1I-J). In summary, NPM3 is highly expressed and positively correlated with tumor malignancy in LUAD.
Fig. 1.
NPM3 expression characteristics in LUAD. A-B NPM3 mRNA expression in TCGA-LUAD and GTEx-lung samples. C-D NPM3 mRNA expression in LUAD with different pathological parameters. E NPM3 protein expression is elevated in CPTAC-LUAD samples. F NPM3 protein expression in grade. G NPM3 promoter methylation levels are reduced in TCGA-LUAD samples. H NPM3 promoter methylation levels are reduced in higher stage. I-J Immunohistochemical staining of NPM3 protein in LUAD tissue slides. The Mann–Whitney U test was used to assess the significance of observed differences. * P < 0.05, ** P < 0.01, and *** P < 0.001 were considered significant
NPM3 is associated with worse clinical prognosis
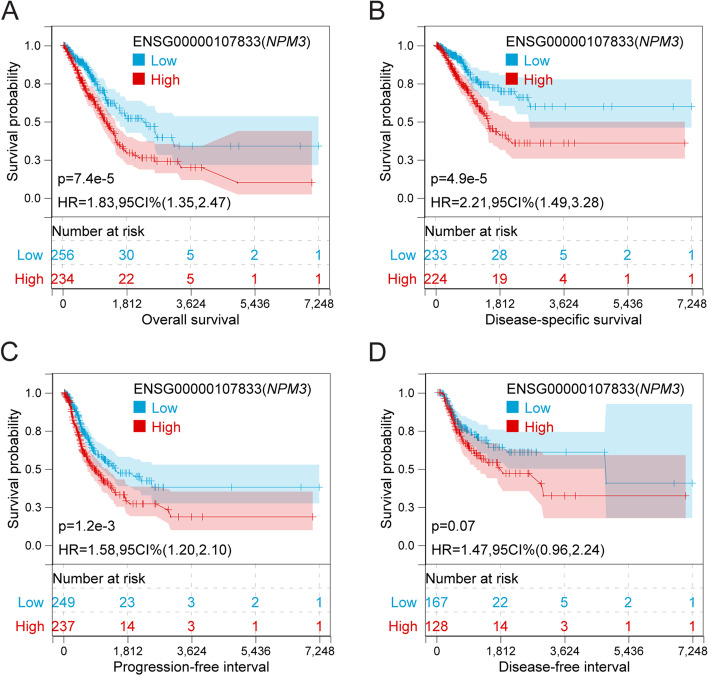
Based on the significantly elevated expression of NPM3 in LUAD samples and its positive correlation with tumor malignancy, it is possible that NPM3 may have a negative impact on patient survival. To investigate this possibility, we categorized patients into high and low NPM3 expression groups and analyzed their prognosis using the Sangerbox database. The logrank test was used to compare the differences in prognosis between the two groups. Our results indicated that high NPM3 expression was significantly associated with poor prognosis in LUAD, as demonstrated by Kaplan–Meier curves for overall survival (OS, HR = 1.83, p = 7.4e-5) (Fig. 2A), disease-free survival (DFS, HR = 2.21, p = 4.9e-5) (Fig. 2B), progression-free interval (PFI, HR = 1.58, p = 1.2e -3) (Fig. 2C), and disease-free interval (DFI, HR = 1.47, p = 0.07) (Fig. 2D). These findings suggest that NPM3 has potential as a prognostic biomarker in LUAD.
Fig. 2.
Effect of NPM3 expression on prognosis. A-D The association of NPM3 expression with OS, DSS, PFI, and DFI. P values were determined by log-rank test
NPM3 expression and mutation landscape
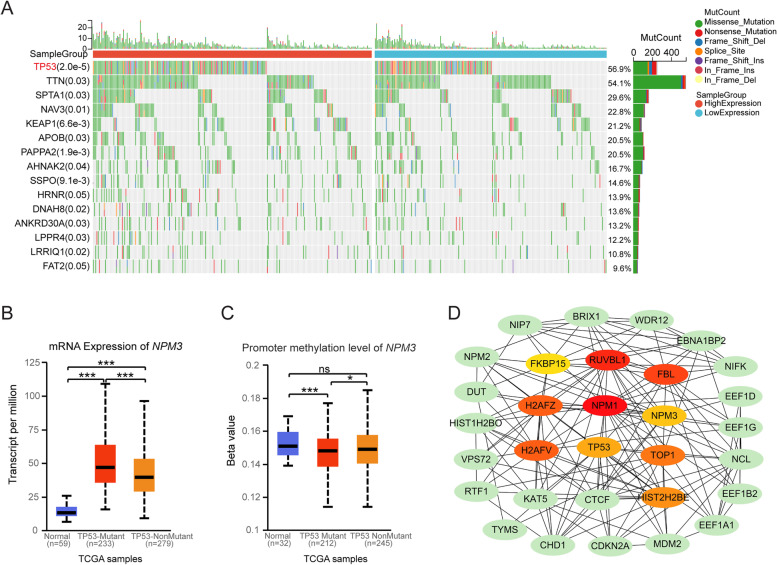
We first analyzed the somatic mutation of NPM3 using the cBioPortal database. The results revealed that NPM3 exhibits a low somatic mutation rate in LUAD, indicating that the abnormal expression of NPM3 is mainly due to epigenetic modification rather than genetic alteration (Supplementary Figure S2). We further investigated the relationship between NPM3 expression and mutation landscape, and found that the mutation frequencies of TP53 (p = 2.0e-5), TTN (p = 0.03), SPTA1 (p = 0.03), NAV3 (p = 0.03), or KEAP1 (p = 0.03) genes were higher in high NPM3 expression samples (Fig. 3A). Notably, TP53 is a well-known tumor suppressor, and TP53 mutations are capable of inducing carcinogenesis, tumor development, resistance to therapy, and influencing patient prognosis and responsiveness to therapy [28]. To confirm the association between NPM3 expression and TP53 mutation, we analyzed NPM3 expression in the presence of TP53 mutation using the UALCAN database. The results showed that NPM3 mRNA expression was higher (Fig. 3B) and promoter methylation level was lower (Fig. 3C) in the presence of TP53 mutation, consistent with the results of Fig. 3A. Furthermore, we retrieved the interaction protein network of NPM3 protein using STRING database [29], and obtained a network comprising 31 nodes with 156 edges, we downloaded and imported this network into Cytoscape 3.9.1 software, and the central hub genes were identified depending on the Betweenness Centrality (BC) value, degree, and Closeness Centrality (CC) value using CytoHubba (Supplementary Table S2). The nodes with high BC in the network often serve as an important bridge for information transfer in the network. We identified the top 10 important nodes in the network based on the Betweenness Centrality parameter, including NPM3, NPM1, TP53, RUVBL1, FBL, H2AFV, H2AFZ, TOP1, HIST2H2BE, FKBP15 (Fig. 3D and Supplementary Table S2), suggesting a potential functional interaction between NPM3 and TP53.
Fig. 3.
Relationship between NPM3 expression and gene mutation landscape. A Relationship between NPM3 expression and gene mutation landscape was analyzed through the Sangerbox database. B-C NPM3 mRNA expression and promoter methylation levels upon TP53 mutation were analy zed through the UALCAN database. D The interacting protein network of NPM3 was analyzed through the STRING database and Cytoscape 3.9.1 software. The top ten important nodes are highlighted based on Betweenness Centrality parameter. Chi-square test was used to assess differences in the frequency of gene mutations. The Mann–Whitney U test was used to assess the significance of observed differences. * P < 0.05 and *** P < 0.001 were considered significant, ns, no significance
Single-cell level profiling of NPM3 expression signatures on LUAD microenvironment cells
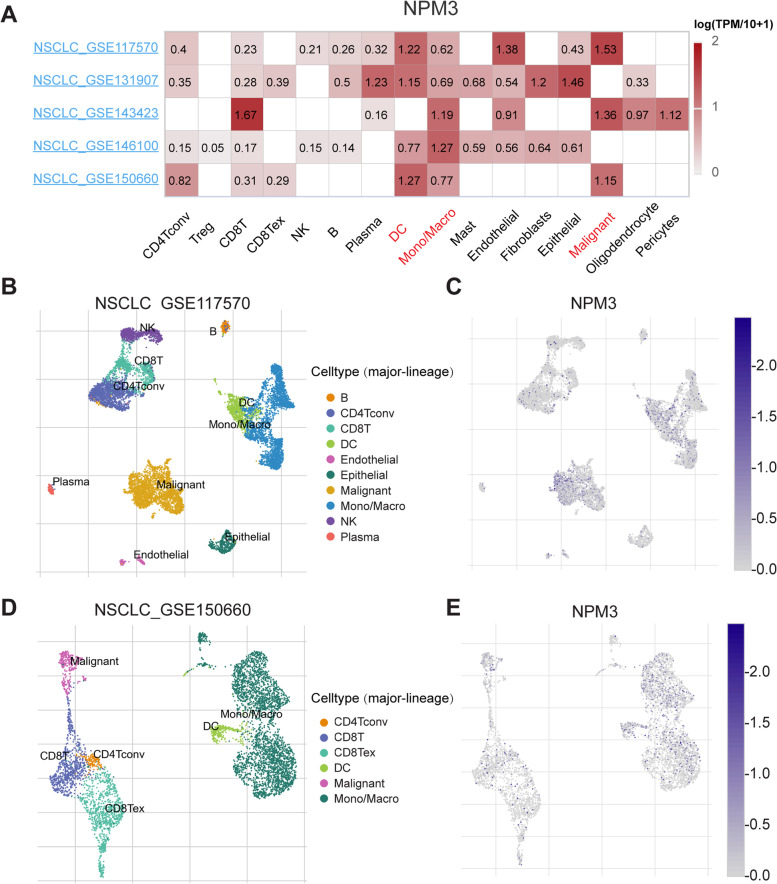
We investigated the NPM3 expression in LUAD microenvironment cells at the single cell level using the TISCH database (Fig. 4A). The results demonstrated that NPM3 was predominantly expressed in dendritic cells (DC) and monocytes/macrophages (Mono/Macro) clusters in GSE117570 (Fig. 4B-C), GSE131907, GSE143423, GSE146100 (Supplementary Figure S3A-C), and GSE150660 (Fig. 4D-E). Moreover, in GSE143423, NPM3 was also expressed mainly in the CD8T cell cluster (Fig. 4A). In GSE131907, NPM3 was mainly expressed in Plasma, Fibroblasts and Epithelial cell clusters (Fig. 4A). These findings suggest that NPM3 might also play a functional role in immune cells or stromal cells, in addition to its role in cancer cells.
Fig. 4.
NPM3 expression at the single cell level. A Heatmap displaying the NPM3 expression in different cell types from different NSCLC databases. B-C Single-cell clustering plot and NPM3 expression in the GSE117570 dataset. D-E Single-cell clustering plot and NPM3 expression in the GSE150660 dataset. CD4Tconv means conventional CD4 T cells. CD8Tex means exhausted CD8 T cells
Relationship between tumor-infiltrating immune cells and NPM3 expression
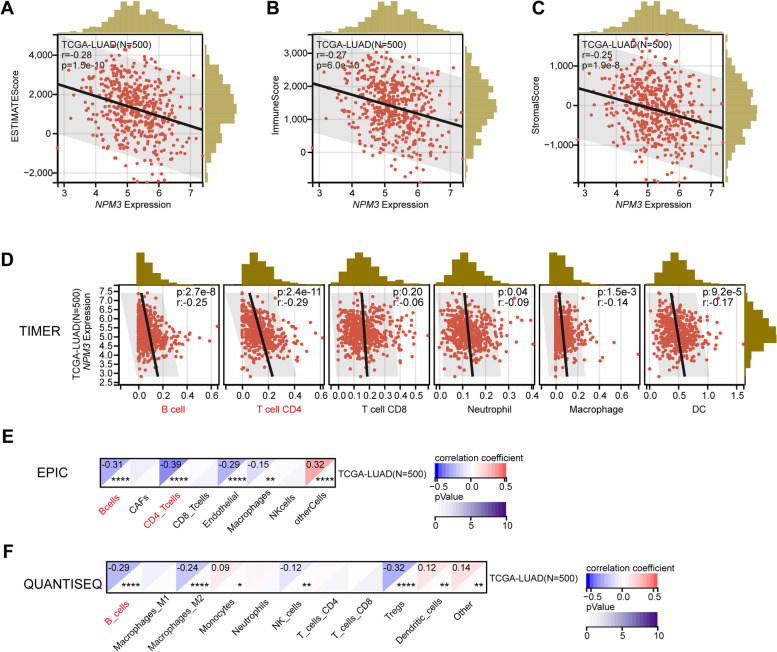
Previous studies have demonstrated that the type, density and dysfunction of tumor-infiltrating lymphocytes influences the survival of cancer patients [30, 31]. We first evaluated the relationship between NPM3 expression and immune score using the ESTIMATE algorithm. The results revealed a significant negative correlation between NPM3 expression and ESTIMATE score (Fig. 5A), immune score (Fig. 5B), and stromal score (Fig. 5C), suggesting that tumors with high NPM3 expression likely suffer from immunosuppression.
Fig. 5.
Codependence of NPM3 expression and immune microenvironment. A-C The relationship between NPM3 expression and ESTIMATE score, immune score or stromal score. D-F the relationship between NPM3 expression and immune cell infiltration was analyzed using TIMER, EPIC or QUANTISEQ algorithms. Pearson's correlation coefficient was used to determine the relationship between gene expression and immunescore or immune cell infiltration
Next, we proceeded to determine whether NPM3 expression was associated with immune cell infiltration in LUAD using various algorithms. As a result, NPM3 expression was negatively correlated with B cells (cor = -0.25, cor = -0.31, cor = -0.29), as illustrated by the TIMER, EPIC and QUANTISEQ algorithms (Fig. 5D-F). Furthermore, NPM3 expression was significantly negatively correlated with CD4 + T cells (cor = -0.29, cor = -0.39) (Fig. 5D-E) and endothelial cells (cor = -0.29) (Fig. 5E). NPM3 expression was also significantly negatively correlated with M2 macrophages (cor = -0.24) and Tregs cells (cor = -0.32) (Fig. 5F). However, there was no significant correlation between CD8 + T cells and NPM3 expression (p > 0.05). These findings suggest that NPM3 plays an essential role in regulating immune infiltration in LUAD.
The association between NPM3 expression and immune-related genes
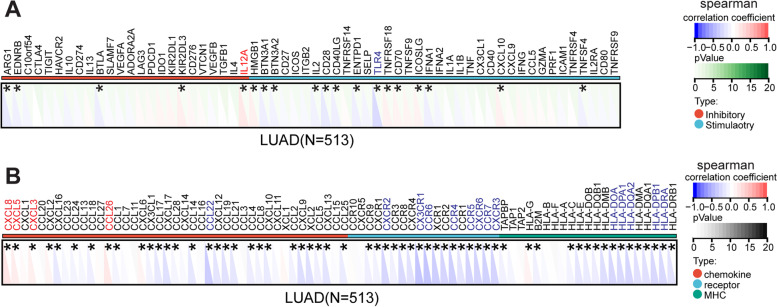
Immune checkpoints are vital in the tumor immune microenvironment, and directly mediate the anti-tumor immune response of the host [32]. Within this context, we performed a correlation analysis between NPM3 and immune checkpoints (Fig. 6A). The results demonstrated that IL12A, an immunosuppressive checkpoint, showed the strongest positive correlation with NPM3 expression, while TLR4, an immunostimulatory checkpoint, showed the strongest negative correlation with NPM3 expression. Furthermore, we investigated the correlation between NPM3 expression and immune-related genes (including chemokines, chemokine receptors, and MHC genes. Our analysis revealed that NPM3 expression was positively correlated with chemokines and chemokine receptors such as CXCL8, CXCL5, and CCL26, while NPM3 expression was negatively correlated with several immunomodulatory genes, including CCL22, CXCR2, CX3CR1, CCR6, HLA-DOA, and HLA-DQA2 (Fig. 6B).
Fig. 6.
Correlation between NPM3 expression and immune-related genes in LUAD. A Heat map illustrates the correlation between NPM3 and immune checkpoints. B Heat map illustrates the correlation between NPM3 and chemokines, chemokine receptors, MHC. Gene expression correlation was analyzed using Spearman's rank correlation coefficient
The potential mechanism of NPM3 is explored in LUAD
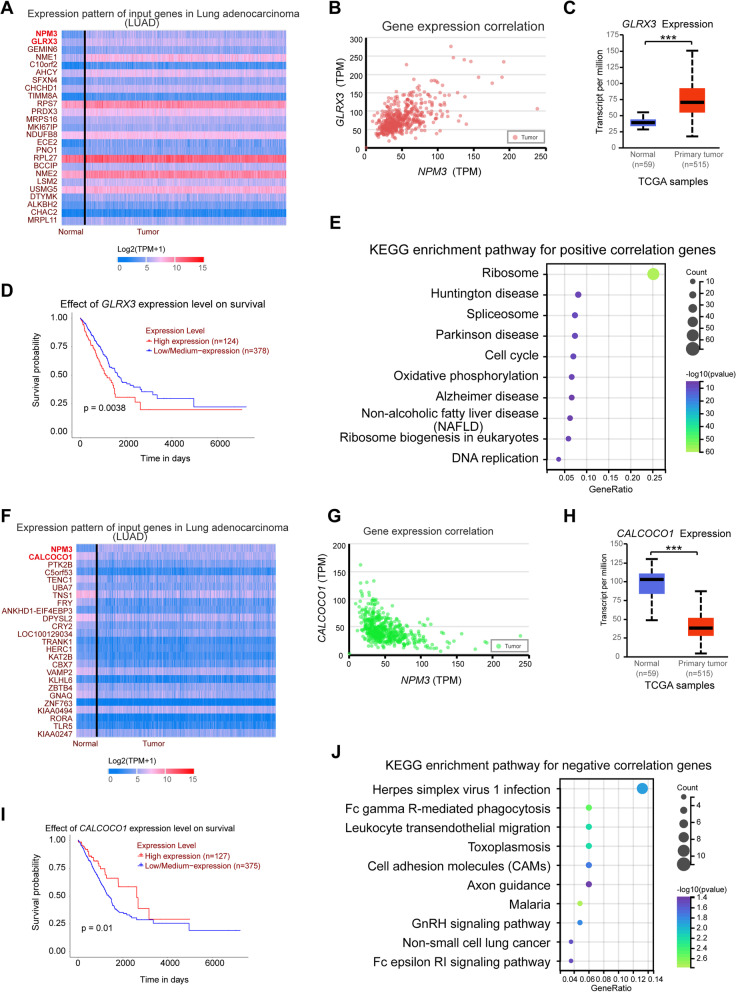
To investigate the potential mechanism of NPM3 in LUAD, we obtained 608 genes positively associated with NPM3 (Pearson r ≥ 0.3) from the UALCAN database (Supplementary Table S3), with GLRX3 being the most correlated gene (Fig. 7A-B). Further analysis showed that GLRX3 was significantly overexpressed in LUAD (Fig. 7C) and high GLRX3 expression was associated with poor prognosis (Fig. 7D), consistent with previous reports that GLRX3 is preferentially expressed in lung cancer [33]. KEGG enrichment analysis of these 608 genes showed significant enrichment in pathways related to ribosome, spliceosome, cell cycle, Parkinson's disease, DNA replication, Huntington's disease, and nonalcoholic fatty liver disease (NAFLD) (Fig. 7E, Supplementary Table S4). We also obtained 189 genes negatively associated with NPM3 (Pearson r ≤ -0.3) from the UALCAN database (Supplementary Table S5), with CALCOCO1 being the most negatively associated gene (Fig. 7F-G). We found a significant decrease in CALCOCO1 expression in LUAD (Fig. 7H) and an association between low CALCOCO1 expression and poor prognosis (Fig. 7I), consistent with previous reports that CALCOCO1 acts synergistically with CCAR1 to co-activate the tumor suppressor TP53 [34]. KEGG enrichment analysis of these 189 genes revealed significant enrichment in pathways related to malaria, Fc gamma R-mediated phagocytosis, leukocyte transendothelial migration, toxoplasmosis, GnRH signaling pathway, cell adhesion molecules (CAMs), non-small cell lung cancer, and Fc epsilon RI signaling pathway pathways (Fig. 7J, Supplementary Table S6).
Fig. 7.
The potential mechanism of NPM3 in LUAD. A Heat map plotting of genes positively correlated with NPM3 expression. B Correlation between NPM3 and GRLX3 expression. C GRLX3 mRNA expression in TCGA-LUAD samples. D Effect of GRLX3 expression on LUAD prognosis. E The KEGG enrichment pathway for positive correlated genes. F Heat map plotting of genes negatively associated with NPM3 expression. g Correlation between NPM3 and CALCOCO1 expression. H CALCOCO1 mRNA expression in TCGA-LUAD samples. I Effect of CALCOCO1 expression on LUAD prognosis. J The KEGG enrichment pathway for negative associated genes. The Mann–Whitney U test was used to assess the significance of observed differences (C and H). *** P < 0.001 were considered significant. P values were determined by log-rank test (D and I)
NPM3 knockdown inhibits cell proliferation in LUAD cells NCI-H1299 and SPC-A1 in vitro
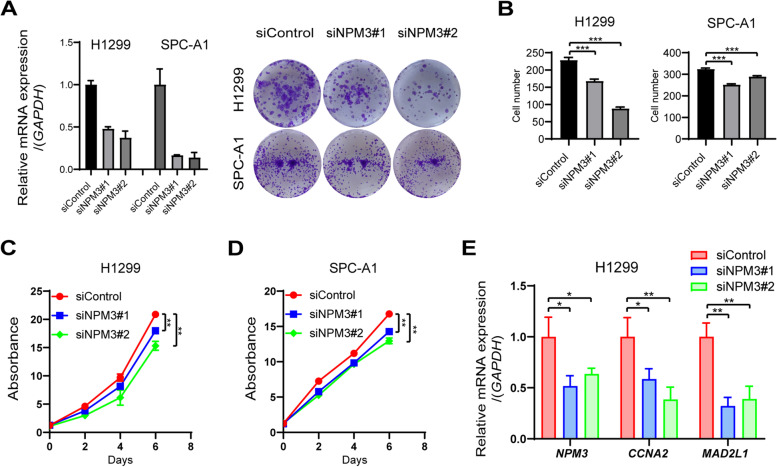
To investigate the role of NPM3 in lung adenocarcinoma, we examined the effect of NPM3 on cell proliferation. First, we performed cell clone-formation assays and found that NPM3 knockdown significantly inhibited the cell clone-forming ability in NCI-H1299 cells compared to controls (Fig. 8A-B). The consistent results were observed in SPC-A1 cells (Fig. 8A-B). In addition, we performed CCK-8 experiments, which showed that NPM3 knockdown significantly inhibited the cell proliferation capacity in either NCI-H1299 or SPC-A1 cells compared to controls (Fig. 8C-D). These results indicated that suppression of NPM3 could retard LUAD cell proliferation in vitro. Since NPM3 was positively associated with certain genes in the cell cycle pathway (including MAD2L1, CCNA2, BUB3, CCNB2, DBF4, CDK1 and CCNB1) (Fig. 7E), we attempted to explore the regulatory relationship between them. As a result, we found that NPM3 knockdown significantly suppressed the mRNA expression of CCNA2 and MAD2L1 (Fig. 8E). The above results suggest that NPM3 knockdown may inhibit LUAD cell growth by suppressing CCNA2 and MAD2L1 expression.
Fig. 8.
NPM3 knockdown inhibits proliferation of LUAD cells. A Cell clone formation assay confirms the effect of NPM3 knockdown on LUAD cell growth. B Statistical analysis of A plots. C-D CCK-8 assay confirms the effect of NPM3 knockdown on proliferative capacity of LUAD cells. E The mRNA expression of CCNA2 and MAD2L1 were analyzed by qPCR assay after NPM3 knockdown. Data represent the mean ± SD. * P < 0.05, ** P < 0.01, and *** P < 0.001. P values were determined by one-way ANOVA
NPM3 knockdown inhibits cell migration in LUAD cells NCI-H1299 and SPC-A1 in vitro
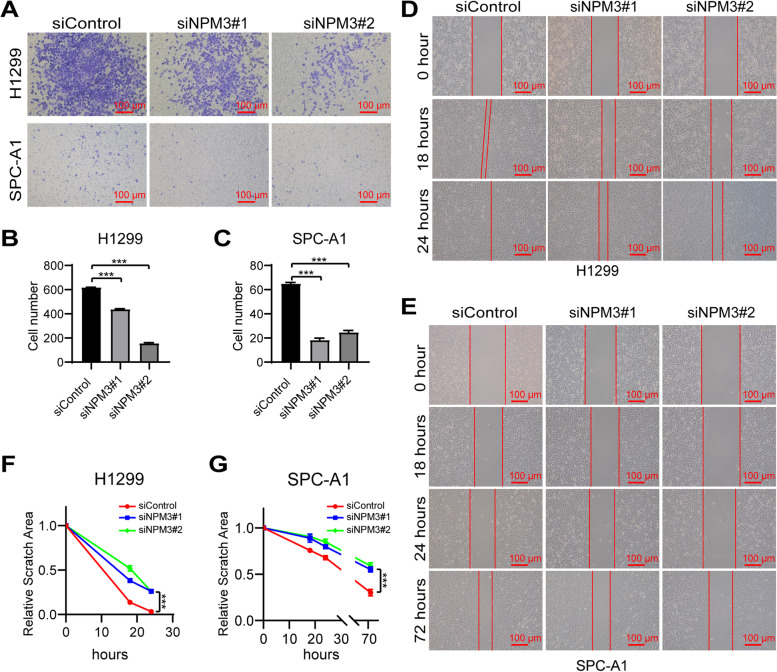
To investigate the effect of NPM3 on cell migration ability, we performed cell scratch assay and transwell assay. Firstly, the results of transwell assays showed that NPM3 knockdown significantly inhibited the cell migration ability in NCI-H1299 or SPC-A1 cells compared to the control (Fig. 9A-C). In addition, the results of cell scratch assays revealed that the scratch closure rate was significantly slower in the NPM3 knockdown group than in the control group (Fig. 9D-G). These findings suggest that suppression of NPM3 can significantly inhibit the migration of LUAD cells in vitro.
Fig. 9.
NPM3 knockdown inhibits migration of LUAD cells. A The effect of NPM3 knockdown on the migratory ability of LUAD cells was analyzed by transwell assay. B-C The count of migrating cells. D-E. The effect of NPM3 knockdown on the migratory ability of LUAD cells was analyzed by cell scratch assay. F-G. The statistics of scratch healing area. Data represent the mean ± SD. * P < 0.05, ** P < 0.01, and *** P < 0.001. P values were determined by one-way ANOVA
Discussion
Lung adenocarcinoma (LUAD) is one of the most common malignancies. Sourcing critical targets for LUAD diagnosis and treatment is emerging as a sought-after investigation area following the rapid development of molecular biology. As such, gaining adequate insight into the molecular pathways that manipulate LUAD progression and prognosis has become an essential objective. This study reveals that NPM3 is a prognostic risk factor in patients and that its mRNA and protein expression are elevated in LUAD. Additionally, in the immune microenvironment, NPM3 is expressed mainly on DC and Mono/Macro immune cells. NPM3 expression is negatively correlated with immune scores, immune infiltration of B cells and CD4 T cells. Finally, NPM3 inhibition suppressed the proliferation and migration of LUAD cells, presumably by regulating the cell cycle and CAMs pathways. In conclusion, our investigations are based on numerous biological database findings, and the results have been validated within in-vitro experiments.
The Nucleophosmin/Nucleoplasmin (NPM) family proteins are termed molecular (or nuclear) chaperones mediating the ordered assembly of proteins, allowing subdivision into four groups based on protein sequence: NPM1, NPM2, NPM3, and invertebrate NPM proteins [35]. We barely know how NPM3 acts in tumors. There is only one report implicating that NPM3 might engage in cancer proliferation as a novel target of transcription factor SP1 in Hela cells [36]. However, NPM1 has attracted substantial attention lately due to its multiple functions, including nucleoplasm-nucleolus shuttling, chromatin remodeling, DNA replication, and mRNA transcription. In particular, NPM1 serves as a double-edged sword in tumors. NPM1 protein expression is upregulated in colorectal and hepatocellular carcinoma, promoting tumor migration and invasion. In contrast, NPM1 protein expression is decreased in gastric cancer, inhibiting tumor proliferation and migration, and thus acting as a tumor suppressor [37–39]. More interestingly, several reports hinted at a synergistic action of NPM3 with NPM1, NPM3 enhances the nucleoplasm-nucleolus shuttling activity of NPM1 through inhibition of NPM1's RNA binding activity in somatic cells [40]. NPM3 tremendously enhances transcription in the cellular system by suppressing the histone assembly activity of NPM1 in vitro [41]. In addition, NPM3 interacts with NPM1 to inhibit ribosome biogenesis [42]. Our study demonstrates for the first time that NPM3 mRNA and protein expression is elevated in LUAD with reduced promoter methylation levels using multiple databases. NPM3 is a risk factor for clinical prognosis in LUAD patients. We also identified a strong association between NPM3 expression and TP53 mutations. Finally, we demonstrated that NPM3 knockdown inhibits the proliferation and migration of LUAD cells in a cellular model, indicating that NPM3 is a potential novel target for LUAD.
The development of lung cancer is a complex process that involves interactions among tumor cells, stromal fibroblasts, and immune cells. Despite the advances in cancer immunotherapy, effective predictors and favorable response rates remain unavailable [43–46]. Single-cell RNA sequencing (scRNA-seq) has helped to improve our understanding of the various cell states in the tumor microenvironment. In this study, single-cell analysis revealed that NPM3 is expressed not only in malignant cells but also in immune cells (DC and Mono/Macro cells) and stromal cells (e.g. fibroblasts) (Fig. 4). This is the first report of NPM3 expression in various cell clusters used for cancer research. DC and Mono/Macro are involved in the intrinsic immune response, additionally, their role as antigen-presenting cells presenting tumor antigens to T cells is essential for an effective T cell-mediated antitumor response [47]. These findings suggest that NPM3 may exert its influence on tumor progression by affecting intrinsic immunity and adaptive immunity through DC and Mono/Macro.
Furthermore, we evaluated the cross-talk between NPM3 expression and the immune microenvironment using multiple algorithms. We found that NPM3 expression was mainly negatively correlated with the infiltration of B cells and CD4 T cells, and somewhat negatively correlated with the infiltration of DCs and macrophages, but the correlation coefficient was low. While regarding a negative correlation between NPM3 expression and M2 tumor-associated macrophages that was observed in Fig. 5F, we think that this exactly indicates a very complicated role of NPM3 in the tumor microenvironment. We believe that NPM3 plays a more important role in the initial stage of tumor immunity and immune regulation, rather than in the effector phase. CD4 T cells are the cornerstone of antitumor immunity, mediating antitumor immunity primarily by contributing to CD8 cytotoxic T lymphocytes (CTL) and antibody responses, and by secreting effector cytokines such as interferon-γ (IFNγ) and tumor necrosis factor-α (TNFα) [48]. B cells can capture tumor antigens and activate immune cells in the initial stage of the immune response, or participate in tumor killing by secreting antibodies, such as CCL2, CXCR4, CCL5, CXCL5 and CXCL10, which trigger the activation of CD4 and CD8 T cells [49]. The results in Fig. 6B show that NPM3 expression was negatively correlated with CCL2, CXCR4, CCL5 or CXCL10, and positively correlated with CXCL5. In addition, tumor infiltrating B cells exerts anti-tumor immunity by secreting tumor-specific antibodies, facilitating T-cell responses, and maintenance the structure and function of tertiary lymphoid structures, which are all responsible for the beneficial outcome of lung cancer [50–53]. However, B cells acting as a multifaceted effector are able to evolve into an immunosuppressive phenotype secreting IL-35, also called regulatory B cells, resulting in tumor progression [51, 53]. Collectively, a comprehensive analysis of immune cell infiltration, immune checkpoint expression, and cell function experimental results suggests that high NPM3 expression is more probably mediating the immunosuppressive microenvironment to promote tumor progression.
To further elucidate the mechanism of NPM3 action in LUAD cells beyond its effects on the immune microenvironment, we investigated the potential signaling pathways in which NPM3-associated genes are involved. Our results revealed a positive association between NPM3 expression and genes involved in cell cycle signaling pathways, such as MAD2L1, CCNA2, BUB3, CCNB2, DBF4, CDK1, and CCNB1 (Supplementary Table S4). Previous studies have shown that FOXM1 reduces the expression of CCNA2 and CCNB1, thereby promoting the proliferation of LUAD cells [54]. TRAP1 modulates the expression of MAD2L1, CDK1, and CCNB1 thereby promoting cell cycle progression and mitotic entry [55]. Additionally, miR-139-5p inhibits LUAD cell proliferation, migration, and invasion by targeting MAD2L1 [56]. Our results demonstrated that NPM3 knockdown suppressed the expression of CCNA2 and MAD2L1, revealing the molecular mechanism by which NPM3 promotes LUAD cell proliferation. Furthermore, we found a negative correlation between NPM3 and the NSCLC pathway RASSF5 gene (Supplementary Table S6), which acts as a tumor suppressor by stabilizing Rb and nuclear P53 [57]. Overall, we found that NPM3 was positively associated with genes that promote tumor proliferation, with NPM3 positively regulating the expression of CCNA2 and MAD2L1, and NPM3 was negatively correlated with the tumor suppressor RASSF5.
In this study, we comprehensively investigated the expression and function of NPM3 in LUAD and its relationship with the tumor microenvironment. However, some limitations remain. Firstly, more clinicopathological tissues are required to validate NPM3 expression. Secondly, the function of NPM3 was only investigated in LUAD cells and its role in immune cells remains unknown. Finally, animal experiments are needed to further elucidate the in vivo role of NPM3. We anticipate that further studies will shed light on the action pattern of NPM3 in the LUAD tumor microenvironment.
Conclusion
To conclude, our study revealed that NPM3 expression is significantly elevated in LUAD tissues and contributes to the growth and migration of LUAD cells in vitro. We demonstrated that NPM3 may be regulate the expression of cell cycle pathway-related genes, as well as impact immune-related genes and immune cell infiltration, to achieve this function. Our findings provide valuable insights for further investigation into the role of NPM3 in LUAD. Moreover, targeting NPM3 may present a novel therapeutic strategy for LUAD treatment.
Supplementary Information
Additional file 1: Supplementary Figure S1. NPM3expression in different clinicopathological parameters of TCGA-LUAD.
Additional file 2: Supplementary Figure S2. NPM3mutation in cancer.
Additional file 3: Supplementary Figure S3. Single-cell clustering plots and NPM3 expression in GSE131907, GSE143423 andGSE146100 datasets.
Additional file 4: Supplementary Table S1. Primer sequences.
Additional file 5: Supplementary Table S2. A protein-protein interactionnetwork parameter based on NPM3.
Additional file 6: Supplementary Table S3. The genes positively associated with NPM3 expression.
Additional file 7: Supplementary Table S4. The KEGG enrichment pathway of genes positivelyassociated with NPM3 expression.
Additional file 8: Supplementary Table S5. The genes negatively associated with NPM3 expression.
Additional file 9: Supplementary Table S6. The KEGG enrichment pathway of genes negativelyassociated with NPM3 expression.
Acknowledgements
Not applicable.
Abbreviations
- LUAD
Lung adenocarcinoma
- NSCLC
Non-small cell lung cancer
- NPM3
Nucleophosmin3
- ES
Embryonic stem
- TP2
Transition protein 2
- sEV-AT
Small extracellular vesicles
- OS
Overall Survival
- DFS
Disease Free Survival
- PFI
Progression Free Interval
- DFI
Disease Free Interval
- siRNA
Small interfering RNA
- Mono/Macro
Monocytes/Macrophages
- DC
Dendritic cells
- NAFLD
Nonalcoholic fatty liver disease
- CAMs
Cell adhesion molecules
- TCGA
The Cancer Genome Atlas
- GTEx
Genotype-Tissue Expression
- HPA
Human Protein Atlas
- UCSC
UNIVERSITY OF CALIFORNIA SANTA CRUZ
- cBioPortal
CBio Cancer Genomics Portal
- UALCAN
The University of ALabama at Birmingham CANcer data analysis Portal
- IHC
Immunohistochemistry
- qPCR
Real-time quantitative PCR
- scRNA-seq
Single-cell RNA sequencing
- MHC
Major histocompatibility complex
- CTL
Cytotoxic T lymphocytes
- IFNγ
Interferon-γ
- TNFα
Tumor necrosis factor-α
Authors’ contributions
SW and KL designed the study and collected the data. SW and JX analyzed the data and wrote the manuscript. KW and WY evaluated and revised the manuscript. All authors read and approved the final manuscript.
Funding
This research was supported by the Medical Science and Technology Project of Zhejiang Province (Grant No. 2023KY303), the Project of NINGBO Leading Medical & Health Discipline (Project Number: 2022-B19), and the Postdoctoral Fund of Yinzhou District, Ningbo, Zhejiang Province.
Availability of data and materials
The data used to support the findings of this study are available from the TCGA, GTEx, HPA, and UALCAN database.
Declarations
Ethics approval and consent to participate
Not applicable.
Consent for publication
All authors consent to the publication of this study.
Competing interests
The authors claim that there is no possible conflict of interest.
Footnotes
Publisher's Note
Springer Nature remains neutral with regard to jurisdictional claims in published maps and institutional affiliations.
References
- 1.Sung H, Ferlay J, Siegel RL, et al. Global Cancer Statistics 2020: GLOBOCAN Estimates of Incidence and Mortality Worldwide for 36 Cancers in 185 Countries. CA Cancer J Clin. 2021;71(3):209–249. doi: 10.3322/caac.21660. [DOI] [PubMed] [Google Scholar]
- 2.Siegel RL, Miller KD, Wagle NS, et al. Cancer statistics, 2023. CA Cancer J Clin. 2023;73(1):17–48. doi: 10.3322/caac.21763. [DOI] [PubMed] [Google Scholar]
- 3.Sholl LM. The Molecular Pathology of Lung Cancer. Surg Pathol Clin. 2016;9(3):353–378. doi: 10.1016/j.path.2016.04.003. [DOI] [PubMed] [Google Scholar]
- 4.Suster DI, Mino-Kenudson M. Molecular Pathology of Primary Non-small Cell Lung Cancer[J] Arch Med Res. 2020;51(8):784–798. doi: 10.1016/j.arcmed.2020.08.004. [DOI] [PubMed] [Google Scholar]
- 5.Travis WD, Brambilla E, Nicholson AG, et al. The 2015 World Health Organization Classification of Lung Tumors: Impact of Genetic, Clinical and Radiologic Advances Since the 2004 Classification. J Thorac Oncol. 2015;10(9):1243–1260. doi: 10.1097/JTO.0000000000000630. [DOI] [PubMed] [Google Scholar]
- 6.Godoy LA, Chen J, Ma W, et al. Emerging precision neoadjuvant systemic therapy for patients with resectable non-small cell lung cancer: current status and perspectives. Biomark Res. 2023;11(1):7. doi: 10.1186/s40364-022-00444-7. [DOI] [PMC free article] [PubMed] [Google Scholar]
- 7.Guo H, Zhang J, Qin C, et al. Biomarker-Targeted Therapies in Non-Small Cell Lung Cancer: Current Status and Perspectives. Cells. 2022;11(20):3200. [DOI] [PMC free article] [PubMed]
- 8.MacArthur CA, Shackleford GM. Npm3: a novel, widely expressed gene encoding a protein related to the molecular chaperones nucleoplasmin and nucleophosmin. Genomics. 1997;42(1):137–140. doi: 10.1006/geno.1997.4353. [DOI] [PubMed] [Google Scholar]
- 9.Shackleford GM, Ganguly A, MacArthur CA. Cloning, expression and nuclear localization of human NPM3, a member of the nucleophosmin/nucleoplasmin family of nuclear chaperones. BMC Genomics. 2001;2:8. doi: 10.1186/1471-2164-2-8. [DOI] [PMC free article] [PubMed] [Google Scholar]
- 10.Motoi N, Suzuki K, Hirota R, et al. Identification and characterization of nucleoplasmin 3 as a histone-binding protein in embryonic stem cells. Dev Growth Differ. 2008;50(5):307–320. doi: 10.1111/j.1440-169X.2008.01034.x. [DOI] [PubMed] [Google Scholar]
- 11.Pradeepa MM, Nikhil G, Hari Kishore A, et al. Acetylation of transition protein 2 (TP2) by KAT3B (p300) alters its DNA condensation property and interaction with putative histone chaperone NPM3. J Biol Chem. 2009;284(43):29956–67. doi: 10.1074/jbc.M109.052043. [DOI] [PMC free article] [PubMed] [Google Scholar]
- 12.Zhang Y, Yu M, Dong J, et al. Identification of Novel Adipokines through Proteomic Profiling of Small Extracellular Vesicles Derived from Adipose Tissue. J Proteome Res. 2020;19(8):3130–3142. doi: 10.1021/acs.jproteome.0c00131. [DOI] [PubMed] [Google Scholar]
- 13.Zhang Y, Yu M, Dong J, et al. Nucleophosmin3 carried by small extracellular vesicles contribute to white adipose tissue browning. J Nanobiotechnology. 2022;20(1):165. doi: 10.1186/s12951-022-01381-1. [DOI] [PMC free article] [PubMed] [Google Scholar]
- 14.Chandrashekar DS, Karthikeyan SK, Korla PK, et al. UALCAN: An update to the integrated cancer data analysis platform. Neoplasia. 2022;25:18–27. doi: 10.1016/j.neo.2022.01.001. [DOI] [PMC free article] [PubMed] [Google Scholar]
- 15.Uhlen M, Zhang C, Lee S, et al. A pathology atlas of the human cancer transcriptome. Science. 2017;357(6352):eaan2507. [DOI] [PubMed]
- 16.Li C, Tang Z, Zhang W, et al. GEPIA2021: integrating multiple deconvolution-based analysis into GEPIA. Nucleic Acids Res. 2021;49(W1):W242–W246. doi: 10.1093/nar/gkab418. [DOI] [PMC free article] [PubMed] [Google Scholar]
- 17.Shen W, Song Z, Zhong X, et al. Sangerbox: a comprehensive, interaction-friendly clinical bioinformatics analysis platform. iMeta. 2022;1(3):e36. doi: 10.1002/imt2.36. [DOI] [PMC free article] [PubMed] [Google Scholar]
- 18.Shakur AH, Huang S, Qian X, et al. SURVFIT: Doubly sparse rule learning for survival data. J Biomed Inform. 2021;117:103691. doi: 10.1016/j.jbi.2021.103691. [DOI] [PubMed] [Google Scholar]
- 19.Gao J, Aksoy BA, Dogrusoz U, et al. Integrative analysis of complex cancer genomics and clinical profiles using the cBioPortal. Sci Signal. 2013;6(269):p11. doi: 10.1126/scisignal.2004088. [DOI] [PMC free article] [PubMed] [Google Scholar]
- 20.Sun D, Wang J, Han Y, et al. TISCH: a comprehensive web resource enabling interactive single-cell transcriptome visualization of tumor microenvironment. Nucleic Acids Res. 2021;49(D1):D1420–D1430. doi: 10.1093/nar/gkaa1020. [DOI] [PMC free article] [PubMed] [Google Scholar]
- 21.Yoshihara K, Shahmoradgoli M, Martinez E, et al. Inferring tumour purity and stromal and immune cell admixture from expression data. Nat Commun. 2013;4:2612. doi: 10.1038/ncomms3612. [DOI] [PMC free article] [PubMed] [Google Scholar]
- 22.Li T, Fan J, Wang B, et al. TIMER: A Web Server for Comprehensive Analysis of Tumor-Infiltrating Immune Cells. Cancer Res. 2017;77(21):e108–e110. doi: 10.1158/0008-5472.CAN-17-0307. [DOI] [PMC free article] [PubMed] [Google Scholar]
- 23.Racle J, de Jonge K, Baumgaertner P, et al. Simultaneous enumeration of cancer and immune cell types from bulk tumor gene expression data. Elife. 2017;6:e26476. [DOI] [PMC free article] [PubMed]
- 24.Finotello F, Mayer C, Plattner C, et al. Molecular and pharmacological modulators of the tumor immune contexture revealed by deconvolution of RNA-seq data. Genome Med. 2019;11(1):34. doi: 10.1186/s13073-019-0638-6. [DOI] [PMC free article] [PubMed] [Google Scholar]
- 25.Zeng D, Ye Z, Shen R, et al. IOBR: multi-omics immuno-oncology biological research to decode tumor microenvironment and signatures. Front Immunol. 2021;12:687975. doi: 10.3389/fimmu.2021.687975. [DOI] [PMC free article] [PubMed] [Google Scholar]
- 26.Kanehisa M, Furumichi M, Sato Y, et al. KEGG for taxonomy-based analysis of pathways and genomes. Nucleic Acids Res. 2023;51(D1):D587–D592. doi: 10.1093/nar/gkac963. [DOI] [PMC free article] [PubMed] [Google Scholar]
- 27.Wu T, Hu E, Xu S, et al. clusterProfiler 4.0: A universal enrichment tool for interpreting omics data. Innovation (Camb) 2021;2(3):100141. doi: 10.1016/j.xinn.2021.100141. [DOI] [PMC free article] [PubMed] [Google Scholar]
- 28.Canale M, Andrikou K, Priano I, et al. The Role of TP53 Mutations in EGFR-Mutated Non-Small-Cell Lung Cancer: Clinical Significance and Implications for Therapy. Cancers (Basel). 2022;14(5):1143. [DOI] [PMC free article] [PubMed]
- 29.Szklarczyk D, Kirsch R, Koutrouli M, et al. The STRING database in 2023: protein-protein association networks and functional enrichment analyses for any sequenced genome of interest. Nucleic Acids Res. 2023;51(D1):D638–D646. doi: 10.1093/nar/gkac1000. [DOI] [PMC free article] [PubMed] [Google Scholar]
- 30.Kiessler M, Plesca I, Sommer U, et al. Tumor-infiltrating plasmacytoid dendritic cells are associated with survival in human colon cancer. J Immunother Cancer. 2021;9(3):e001813. [DOI] [PMC free article] [PubMed]
- 31.Okadome K, Baba Y, Yagi T, et al. Prognostic Nutritional Index, Tumor-infiltrating Lymphocytes, and Prognosis in Patients with Esophageal Cancer. Ann Surg. 2020;271(4):693–700. doi: 10.1097/SLA.0000000000002985. [DOI] [PubMed] [Google Scholar]
- 32.Miao D, Margolis CA, Gao W, et al. Genomic correlates of response to immune checkpoint therapies in clear cell renal cell carcinoma. Science. 2018;359(6377):801–806. doi: 10.1126/science.aan5951. [DOI] [PMC free article] [PubMed] [Google Scholar]
- 33.Cha MK, Kim IH. Preferential overexpression of glutaredoxin3 in human colon and lung carcinoma. Cancer Epidemiol. 2009;33(3–4):281–287. doi: 10.1016/j.canep.2009.08.006. [DOI] [PubMed] [Google Scholar]
- 34.Kim JH, Yang CK, Heo K, et al. CCAR1, a key regulator of mediator complex recruitment to nuclear receptor transcription complexes. Mol Cell. 2008;31(4):510–519. doi: 10.1016/j.molcel.2008.08.001. [DOI] [PMC free article] [PubMed] [Google Scholar]
- 35.Frehlick LJ, Eirin-Lopez JM, Ausio J. New insights into the nucleophosmin/nucleoplasmin family of nuclear chaperones. BioEssays. 2007;29(1):49–59. doi: 10.1002/bies.20512. [DOI] [PubMed] [Google Scholar]
- 36.Oleaga C, Welten S, Belloc A, et al. Identification of novel Sp1 targets involved in proliferation and cancer by functional genomics. Biochem Pharmacol. 2012;84(12):1581–1591. doi: 10.1016/j.bcp.2012.09.014. [DOI] [PubMed] [Google Scholar]
- 37.Karimi Dermani F, Gholamzadeh Khoei S, Afshar S, et al. The potential role of nucleophosmin (NPM1) in the development of cancer. J Cell Physiol. 2021;236(11):7832–7852. doi: 10.1002/jcp.30406. [DOI] [PubMed] [Google Scholar]
- 38.Grisendi S, Bernardi R, Rossi M, et al. Role of nucleophosmin in embryonic development and tumorigenesis. Nature. 2005;437(7055):147–153. doi: 10.1038/nature03915. [DOI] [PubMed] [Google Scholar]
- 39.Box JK, Paquet N, Adams MN, et al. Nucleophosmin: from structure and function to disease development. BMC Mol Biol. 2016;17(1):19. doi: 10.1186/s12867-016-0073-9. [DOI] [PMC free article] [PubMed] [Google Scholar]
- 40.Okuwaki M, Sumi A, Hisaoka M, et al. Function of homo- and hetero-oligomers of human nucleoplasmin/nucleophosmin family proteins NPM1, NPM2 and NPM3 during sperm chromatin remodeling. Nucleic Acids Res. 2012;40(11):4861–4878. doi: 10.1093/nar/gks162. [DOI] [PMC free article] [PubMed] [Google Scholar]
- 41.Gadad SS, Shandilya J, Kishore AH, et al. NPM3, a member of the nucleophosmin/nucleoplasmin family, enhances activator-dependent transcription. Biochemistry. 2010;49(7):1355–1357. doi: 10.1021/bi9021632. [DOI] [PubMed] [Google Scholar]
- 42.Huang N, Negi S, Szebeni A, et al. Protein NPM3 interacts with the multifunctional nucleolar protein B23/nucleophosmin and inhibits ribosome biogenesis. J Biol Chem. 2005;280(7):5496–5502. doi: 10.1074/jbc.M407856200. [DOI] [PubMed] [Google Scholar]
- 43.Wang S, Sun J, Chen K, et al. Perspectives of tumor-infiltrating lymphocyte treatment in solid tumors. BMC Med. 2021;19(1):140. doi: 10.1186/s12916-021-02006-4. [DOI] [PMC free article] [PubMed] [Google Scholar]
- 44.Genova C, Dellepiane C, Carrega P, et al. Therapeutic Implications of Tumor Microenvironment in Lung Cancer: Focus on Immune Checkpoint Blockade. Front Immunol. 2021;12:799455. doi: 10.3389/fimmu.2021.799455. [DOI] [PMC free article] [PubMed] [Google Scholar]
- 45.Memmott RM, Wolfe AR, Carbone DP, et al. Predictors of response, progression-free survival, and overall survival in patients with lung cancer treated with immune checkpoint inhibitors. J Thorac Oncol. 2021;16(7):1086–1098. doi: 10.1016/j.jtho.2021.03.017. [DOI] [PubMed] [Google Scholar]
- 46.Otano I, Ucero AC, Zugazagoitia J, et al. At the crossroads of immunotherapy for oncogene-addicted subsets of NSCLC. Nat Rev Clin Oncol. 2023;20(3):143–159. doi: 10.1038/s41571-022-00718-x. [DOI] [PubMed] [Google Scholar]
- 47.Goswami S, Anandhan S, Raychaudhuri D, et al. Myeloid cell-targeted therapies for solid tumours. Nat Rev Immunol. 2023;23(2):106–120. doi: 10.1038/s41577-022-00737-w. [DOI] [PubMed] [Google Scholar]
- 48.Tay RE, Richardson EK, Toh HC. Revisiting the role of CD4(+) T cells in cancer immunotherapy-new insights into old paradigms[J] Cancer Gene Ther. 2021;28(1–2):5–17. doi: 10.1038/s41417-020-0183-x. [DOI] [PMC free article] [PubMed] [Google Scholar]
- 49.Basu A, Ramamoorthi G, Albert G, et al. Differentiation and Regulation of T(H) Cells: A Balancing Act for Cancer Immunotherapy. Front Immunol. 2021;12:669474. doi: 10.3389/fimmu.2021.669474. [DOI] [PMC free article] [PubMed] [Google Scholar]
- 50.Al-Shibli KI, Donnem T, Al-Saad S, et al. Prognostic effect of epithelial and stromal lymphocyte infiltration in non-small cell lung cancer. Clin Cancer Res. 2008;14(16):5220–5227. doi: 10.1158/1078-0432.CCR-08-0133. [DOI] [PubMed] [Google Scholar]
- 51.Michaud D, Steward CR, Mirlekar B, et al. Regulatory B cells in cancer. Immunol Rev. 2021;299(1):74–92. doi: 10.1111/imr.12939. [DOI] [PMC free article] [PubMed] [Google Scholar]
- 52.Schalper KA, Brown J, Carvajal-Hausdorf D, et al. Objective measurement and clinical significance of TILs in non-small cell lung cancer. J Natl Cancer Inst. 2015;107(3):dju435. [DOI] [PMC free article] [PubMed]
- 53.Wang SS, Liu W, Ly D, et al. Tumor-infiltrating B cells: their role and application in anti-tumor immunity in lung cancer. Cell Mol Immunol. 2019;16(1):6–18. doi: 10.1038/s41423-018-0027-x. [DOI] [PMC free article] [PubMed] [Google Scholar]
- 54.Kim IM, Ackerson T, Ramakrishna S, et al. The Forkhead Box m1 transcription factor stimulates the proliferation of tumor cells during development of lung cancer. Cancer Res. 2006;66(4):2153–2161. doi: 10.1158/0008-5472.CAN-05-3003. [DOI] [PubMed] [Google Scholar]
- 55.Sisinni L, Maddalena F, Condelli V, et al. TRAP1 controls cell cycle G2-M transition through the regulation of CDK1 and MAD2 expression/ubiquitination. J Pathol. 2017;243(1):123–134. doi: 10.1002/path.4936. [DOI] [PubMed] [Google Scholar]
- 56.Li J, He X, Wu X, et al. miR-139-5p Inhibits Lung Adenocarcinoma Cell Proliferation, Migration, and Invasion by Targeting MAD2L1. Comput Math Methods Med. 2020;2020:2953598. doi: 10.1155/2020/2953598. [DOI] [PMC free article] [PubMed] [Google Scholar] [Retracted]
- 57.Barnoud T, Schmidt ML, Donninger H, et al. The role of the NORE1A tumor suppressor in Oncogene-Induced Senescence. Cancer Lett. 2017;400:30–36. doi: 10.1016/j.canlet.2017.04.030. [DOI] [PMC free article] [PubMed] [Google Scholar]
Associated Data
This section collects any data citations, data availability statements, or supplementary materials included in this article.
Supplementary Materials
Additional file 1: Supplementary Figure S1. NPM3expression in different clinicopathological parameters of TCGA-LUAD.
Additional file 2: Supplementary Figure S2. NPM3mutation in cancer.
Additional file 3: Supplementary Figure S3. Single-cell clustering plots and NPM3 expression in GSE131907, GSE143423 andGSE146100 datasets.
Additional file 4: Supplementary Table S1. Primer sequences.
Additional file 5: Supplementary Table S2. A protein-protein interactionnetwork parameter based on NPM3.
Additional file 6: Supplementary Table S3. The genes positively associated with NPM3 expression.
Additional file 7: Supplementary Table S4. The KEGG enrichment pathway of genes positivelyassociated with NPM3 expression.
Additional file 8: Supplementary Table S5. The genes negatively associated with NPM3 expression.
Additional file 9: Supplementary Table S6. The KEGG enrichment pathway of genes negativelyassociated with NPM3 expression.
Data Availability Statement
The data used to support the findings of this study are available from the TCGA, GTEx, HPA, and UALCAN database.


