Abstract
We developed a new method using 13CO2 and mass spectrometry to elucidate the role of photorespiration as an alternative electron dissipating pathway under drought stress. This was achieved by experimentally distinguishing between the CO2 fluxes into and out of the leaf. The method allows us to determine the rates of gross CO2 assimilation and gross CO2 evolution in addition to net CO2 uptake by attached leaves during steady-state photosynthesis. Furthermore, a comparison between measurements under photorespiratory and non-photorespiratory conditions may give information about the contribution of photorespiration and mitochondrial respiration to the rate of gross CO2 evolution at photosynthetic steady state. In tomato (Lycopersicon esculentum Mill. cv Moneymaker) leaves, drought stress decreases the rates of net and gross CO2 uptake as well as CO2 release from photorespiration and mitochondrial respiration in the light. However, the ratio of photorespiratory CO2 evolution to gross CO2 assimilation rises with water deficit. Also the contribution of re-assimilation of (photo) respiratory CO2 to gross CO2 assimilation increases under drought.
Water deficit limits plant growth and productivity because it decreases net CO2 assimilation due to reduced stomatal conductance for CO2 and/or because of non-stomatal effects like inhibition of enzymatic processes by changes in ionic or osmotic conditions (Lawlor, 1995). At high light intensities the lowered consumption of redox equivalents in the Calvin cycle makes it necessary to degrade photosynthetic electrons in processes other than CO2 fixation to avoid photo-inhibition. Sharkey et al. (1988) showed that the activity of photosystem II can be regulated in a way that the rate of electron transport matches the capacity of the electron consuming reactions and that linear electron transport depends not only on light intensity and CO2 concentration but also on the O2 concentration. Oxygen can function as alternative electron acceptor directly in the Mehler reaction or indirectly in photorespiration (Badger, 1985).
By combined measurements of O2 and CO2 gas exchange it should be possible to investigate the distribution of photosynthetic electrons between the electron consuming reactions CO2 assimilation, photorespiration, and Mehler reaction (Haupt-Herting, 2000). The influence of drought stress on photosystem II activity, gross O2 evolution, and gross O2 uptake in tomato (Lycopersicon esculentum Mill. cv Moneymaker) plants has been published elsewhere (Haupt-Herting and Fock, 2000). This paper deals with the corresponding carbon fluxes determined by a new CO2 gas exchange method.
The magnitude of photorespiration and the role of mitochondrial respiration in the light under drought stress are still unclear. There are studies where photorespiration decreases under drought stress (Thomas and André, 1982; Biehler and Fock, 1995; Tourneux and Peltier, 1995) as well as studies where it increases (Renou et al., 1990; Biehler and Fock, 1996) or is not influenced at all (Stuhlfauth et al., 1990). According to Bradford and Hsiao (1982) respiration in the light declines with water deficit as dark respiration does. On the other hand, Lawlor (1995) assumes that dissimilation is stimulated under drought stress. However, the contribution of mitochondrial respiration to CO2 release or O2 uptake at photosynthetic steady state has not been resolved yet.
Photorespiratory CO2 evolution is accompanied by CO2 uptake in the Calvin cycle and CO2 release from mitochondrial respiration in the light, whereas photorespiratory O2 uptake is masked by O2 evolution at photosystem II and O2 consumption by Mehler reaction and mitochondrial respiration. Therefore, the determination of the rates of photorespiratory CO2 evolution and O2 uptake is difficult.
Rough calculations of photorespiration have been tried by different methods in the past (Jackson and Volk, 1970; Catzky et al., 1971). Progress in photorespiration research was made by the use of the 14CO2 isotope to separate CO2 fluxes into and out of leaves in an open gas exchange system under steady-state conditions (Ludwig and Canvin, 1971). In these experiments, a leaf is illuminated in 12CO2 until steady state is reached, and then 14CO2-labeled CO2 is provided. From the uptake of 14CO2 and the internal concentrations of 14CO2 and 12CO2 the rates of gross CO2 assimilation, originating from external CO2 and from re-assimilation, gross CO2 evolution and re-assimilation were calculated (Gerbaud and André, 1987; Stuhlfauth et al., 1990).
Some authors use the labeling of the CO2 evolved after illumination in air containing 14CO2 to calculate CO2 evolution rates under photorespiratory and non-photorespiratory conditions (Bauwe et al., 1987). These measurements make it possible to separate the contribution of primary products and end products to the photorespiratory as well as to the respiratory CO2 release (Pärnik and Keerberg, 1995).
The determination of carboxylation and oxygenation rates of Rubisco from fluorescence measurements, CO2 gas exchange, and Rubisco kinetics has been described by Laisk and Sumberg (1994). This method can be used to calculate not only the rates of CO2 assimilation and photorespiration but also the rate of mitochondrial respiration in the light (Laisk and Loreto, 1996). For this, the plastidic CO2 concentration and the CO2 transport resistance in mesophyll cells are required.
To address the problem of sources and sinks for CO2 and O2 in plants, we present a new method, based on considerations from Gerbaud and André (1987), using 13CO2 and mass spectrometry to determine CO2 fluxes under conditions of steady-state photosynthesis. The method was used to determine the rates of net CO2 uptake, gross CO2 assimilation, photorespiratory CO2 release, and mitochondrial respiratory CO2 evolution in the light by attached leaves of tomato under different light intensities and at varying drought stresses.
RESULTS
Signal Curve Characteristics
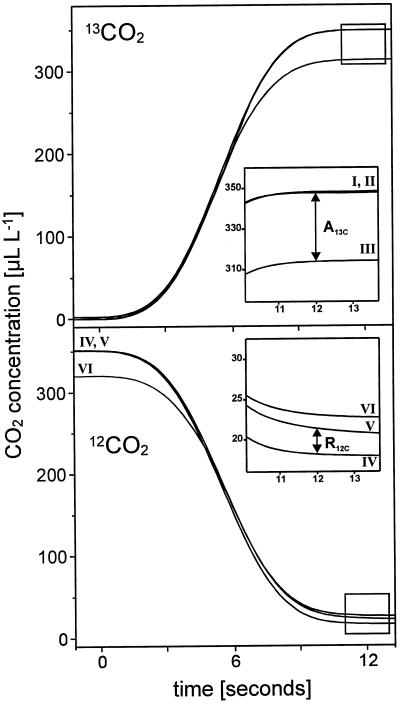
In Figure 1, the mass spectrometric signal curves for 12CO2 and 13CO2 after switching from the gas stream containing 12CO2 to the gas stream containing 13CO2 with an empty cuvette and with a leaf in the cuvette in the dark or in the light, respectively, are shown. The 13CO2 signal rises while the 12CO2 signal falls. The 13CO2 concentration reached after switching to 13CO2 with a leaf in the dark (II) is the same as without a leaf in the cuvette (I), because no CO2 fixation occurs in the dark and no 13CO2 is released from the plant.
Figure 1.
Mass-spectrometric signal curves of 12CO2 and 13CO2 after switching to the gas stream containing 13CO2 and no 12CO2 with an empty cuvette (I, IV) and with a leaf in the cuvette in the dark (II, V) or during photosynthetic steady state (III, VI) under a light intensity of 850 μmol photons m−2 s−1. The system was provided with a gas stream containing 12CO2 prior to application of 13CO2 (gas flow 50 L h−1, 350 μL L−1 CO2, 210 mL L−1 O2, 70% relative humidity, 23°C). The assimilation of 13CO2 by the leaf (A13C) and the release of 12CO2 from the leaf in the light (R12C) are used to determine the intercellular 13CO2 and 12CO2 concentration, respectively, and to determine true CO2 assimilation. The curves were smoothed with a quadratic Savitzky-Golay function using an appropriate software (HP ChemStationDataAnalysis, Hewlett-Packard) and transferred to the same time axis (switching to 13CO2 at t = 0 including 2 s of response time). For further details see “Results” and “Discussion.”
The illuminated leaf (III) takes up 13CO2 without releasing 13CO2 for almost the first 20 s (Ludwig and Canvin, 1971) so that the 13CO2 concentration in the gas stream with a leaf in the cuvette is lower than the maximal 13CO2 concentration, which is reached when switching to 13CO2 is repeated without a leaf in the cuvette. This maximal 13CO2 concentration is reached in less than 20 s (12 s for a gas flow rate of 50 L h−1) after switching to 13CO2. The fact that the 13CO2 curves with a darkened leaf, without a leaf, and with a filter paper in the cuvette (not shown) are identical confirms that the presence of a leaf in the cuvette does not affect the gas flow characteristics and that the signals without a leaf can serve as reference for the calculations of 13CO2 uptake or 12CO2 evolution.
The 12CO2 concentration reached with a darkened leaf (V) is higher than without a leaf (IV) because 12CO2 is generated from dark respiration. The 12CO2 signal with an illuminated leaf (VI) is again higher because in the light 12CO2 is evolved out of the photorespiratory pathway and from mitochondrial respiration.
Exposing the illuminated leaf to 13CO2 up to 20 min results in a slight but continuous increase of the 13CO2 signal (data not shown). Because of the ongoing labeling of photosynthetic and photorespiratory intermediates 13CO2 is released from the leaf and the visible uptake of 13CO2 gets smaller. After 20 min no apparent increase in the 13CO2 signal occurs any longer, and the rate of net 13CO2 uptake calculated at this point of time is higher than the net 12CO2-uptake rate (A) measured before switching to 13CO2. A reason for this might be an incomplete labeling of intermediates of the glycolate pathway, as the evolved CO2 does not become labeled completely, although the signal for 12CO2 release decreases because part of the evolved CO2 is released as 13CO2.
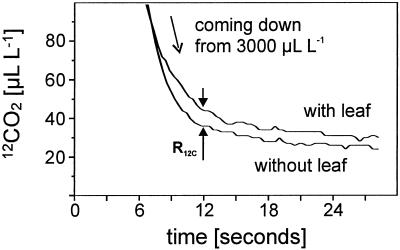
Figure 2 shows the original mass spectrometric signal curves for 12CO2 with and without a leaf in the cuvette after providing 3,000 μL L−1 13CO2 at photosynthetic steady state. Flushing the gas exchange system with 13CO2 leads to a decrease of the 12CO2 concentration from 3,000 μL L−1 to nearly 25 μL L−1. Within 12 s a difference between the 12CO2 concentrations with and without a leaf in the cuvette can be observed. The 12CO2 concentration is higher with a leaf because of mitochondrial 12CO2 release. From this gross CO2 evolution out of the leaf mitochondrial respiration can be calculated.
Figure 2.
Mass spectrometric signal curves for 12CO2 after switching to the gas stream containing 3,000 μL L−1 13CO2 and no 12CO2 without and with an illuminated leaf (850 μmol m−2 s−1) in the cuvette. The system was provided with a gas stream containing 12CO2 prior to application of 13CO2 (gas flow 50 L h−1, 3,000 μL L−1 CO2, 210 mL L−1 O2, 70% relative humidity, 23°C). The curves were not smoothed but transferred to the same time axis (switching to 13CO2 at t = 0 including 2 s of response time). The difference between the curves at t = 12 s was used to calculate the evolution of CO2 by mitochondrial respiration in the light.
The rates of net CO2 uptake, gross CO2 assimilation, and gross CO2 evolution measured with the new mass spectrometric isotope technique change typically in relation to the ambient CO2 and O2 concentration (data not shown). This shows the validity of the new method.
Effect of Light Intensity and Water Deficit on Steady-State Net CO2 Uptake, Gross CO2 Assimilation, and Gross CO2 Evolution
The rates of net CO2 uptake (A), gross CO2 assimilation (TPS), gross CO2 evolution (RC), mitochondrial respiration (Resp), and photorespiration (PR) were measured at photosynthetic steady state on control and drought-stressed tomato leaves under different light intensities.
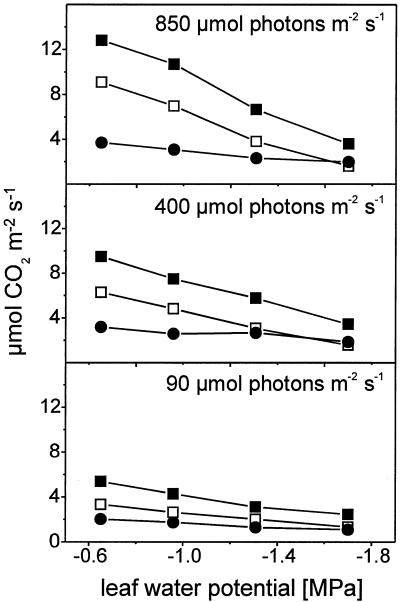
When the light intensity is increased from 90 to 850 μmol photons m−2 s−1 A and TPS rise 2.5-fold in control and weakly stressed plants (Fig. 3) because more light-generated ATP and NADPH are available for CO2 fixation in the Calvin cycle. Lowering the leaf water potential from −0.6 MPa in controls to −1.8 MPa in severely stressed plants leads to a decrease of transpiration and leaf conductance (Haupt-Herting, 2000). This results in an internal CO2 concentration of 112 μL L−1 in severely stressed plants compared with 227 μL L−1 in controls under saturating light intensities and A and TPS decrease by 82% and 72%, respectively. Severely stressed plants seem to be widely unaffected by light intensity. This means that CO2 fixation under drought stress is not limited by light absorption but by internal CO2 deficiency because of stomatal closure or by non-stomatal effects like inhibition of ATP synthase, photosystem II efficiency, or Rubisco activity (Cornic, 1994; Lawlor, 1995). In severely stressed tomato plants the specific activity of Rubisco, measured as 14C-incorporation into acid-stabile compounds, decreases to less than one-half of the activity measured in controls (Haupt-Herting, 2000).
Figure 3.
Rates of steady-state net CO2 uptake (A, □), gross CO2 assimilation (TPS, ▪), and gross CO2 evolution (RC, ●) of attached leaves of tomato at three different light intensities in relation to leaf water potential. Measurements were taken in an open gas exchange system using a mass spectrometric 13CO2 isotope technique. Leaves were provided with air (gas flow 50 L h−1) containing 210 mL L−1 O2, and 350 μL L−1 12CO2 or 13CO2, respectively, at 70% relative humidity and 23°C. Points are means of at least six replicates; se ≤ 10%.
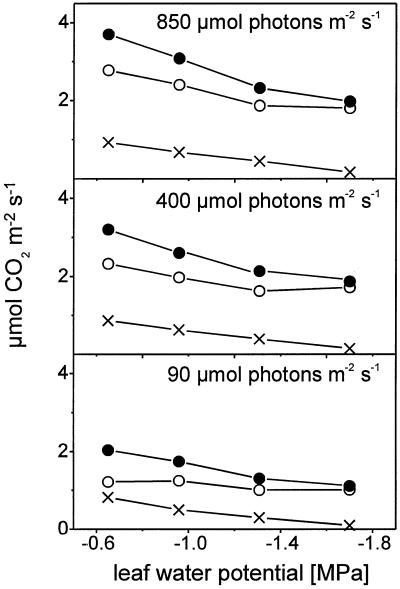
RC, which consists of the CO2 released from photorespiration and mitochondrial respiration, is stimulated by increasing light intensities from 2.0 μmol CO2 m−2 s−1 under low light to 3.7 μmol CO2 m−2 s−1 under saturating light in control plants and from 1.1 μmol CO2 m−2 s−1 to 2.0 μmol CO2 m−2 s−1 in severely stressed plants (Fig. 4). Severe drought stress (−1.8 MPa) results in a decrease of RC of approximately 47% under high light, which is smaller than the relative decrease of TPS (72%).
Figure 4.
Rates of steady-state gross CO2 evolution (RC, ●), photorespiration (PR, ○), and mitochondrial respiration (Resp, X) of attached leaves of tomato at three different light intensities in relation to leaf water potential. Measurements were taken in an open gas exchange system using a mass spectrometric 13CO2 isotope technique. Leaves were provided with air (gas flow 50 L h−1) containing 210 mL L−1 O2 at 70% relative humidity and 23°C. The CO2 concentration was 350 μL L−1 12CO2 or 13CO2, respectively, for determination of gross CO2 evolution and 3,000 μL L−1 12CO2 or 13CO2, respectively, for measurement of mitochondrial respiration. Photorespiration is calculated from RC and Resp. Points are means of at least six replicates; se ≤ 10%.
Effect of Light Intensity and Water Deficit on Mitochondrial Respiration in the Light, Photorespiration, and Re-Assimilation
The rates of mitochondrial respiration in the dark in 350 and 3,000 μL L−1 CO2 are the same in tomato leaves (Haupt-Herting, 2000). Provided that mitochondrial respiration in the light is not affected by CO2 partial pressure between 350 and 3,000 μL L−1 CO2, Figure 4 shows the rates of mitochondrial respiration in the light at 3,000 μL L−1 CO2 and the contribution of mitochondrial respiration and photorespiration to RC. Mitochondrial respiration in the light depends on the incident light intensity (0.82 μmol CO2 m−2 s−1 under low and 0.93 μmol CO2 m−2 s−1 under high light in control plants) and is in the same range as respiration in the dark (0.85 μmol CO2 m−2 s−1). Also, mitochondrial respiration in the dark is lower in stressed plants than in controls (data not shown). Mitochondrial respiration in the light responds to drought stress with a decrease from 0.93 μmol CO2 m−2 s−1 in controls to 0.17 μmol CO2 m−2 s−1 under severe stress (Fig. 4).
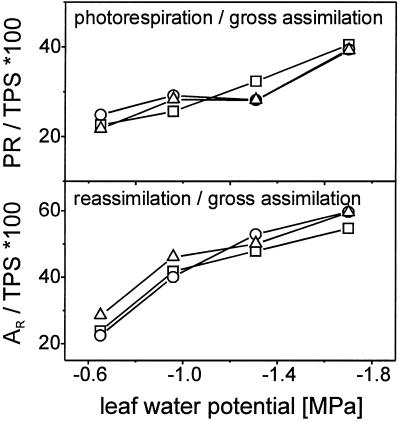
The rate of photorespiration is higher than the rate of mitochondrial respiration and represents the main part of gross CO2 evolution (Fig. 4). It depends on light intensity (1.2 μmol CO2 m−2 s−1 under low light and 2.8 μmol CO2 m−2 s−1 under saturating light for control plants) and is decreased by drought stress from 2.8 μmol CO2 m−2 s−1 in control to 1.8 μmol CO2 m−2 s−1 in severely stressed plants under high light (Fig. 4A). As PR is less inhibited than TPS the ratio of PR to TPS rises with increasing drought stress in tomato under all light regimes from 22% in control plants to 39% in severely stressed plants (Fig. 5A), which shows that the oxygenation reaction of Rubisco is stimulated under drought stress relative to the carboxylation reaction.
Figure 5.
A, Ratio of photorespiration (PR) to gross CO2 assimilation (TPS); B, ratio of re-assimilation (AR) to TPS in relation to leaf water potential at 90 (□), 400 (○), and 850 μmol photons m−2 s−1 (▵). Measurements were taken in an open gas exchange system using a mass spectrometric 13CO2 isotope technique. Leaves were provided with air (gas flow 50 L h−1) containing 210 mL L−1 O2 and 350 μL L−1 12CO2 or 13CO2, respectively, at 70% relative humidity and 23°C.
The CO2 evolved by the glycolate pathway is available for CO2 assimilation in addition to the CO2 in the atmosphere and is partly re-assimilated before leaving the leaf. The relative contribution of re-assimilation of (photo) respiratory 12CO2 (AR) to gross CO2 assimilation is only slightly affected by light intensity (Fig. 5B). In control plants, 23% of TPS are due to AR under low or moderate light and 29% under saturating light. This can be explained by higher rates of photorespiratory CO2 evolution under high light conditions. As PR is less decreased under drought than TPS, the contribution of AR to TPS rises to over 40% in weakly stressed plants, 50% in moderately stressed plants, and nearly 60% in severely stressed plants.
DISCUSSION
Critical Assessment of the New Method
The new mass spectrometric 12CO2/13CO2 isotope technique for the determination of accurate CO2 flux rates into and out of the leaf is derived from 14CO2 measurements of total stomatal CO2 uptake by Ludwig and Canvin (1971). The method has been expanded for re-assimilation calculations by Gerbaud and André (1987) and Stuhlfauth et al. (1990). The substitution of 14CO2 used in earlier studies by 13CO2 used here has some important advantages: The discrimination of Rubisco against 13CO2 (approximately 27‰) is smaller than against 14CO2 (approximately 60‰; Farquhar et al., 1982). The radioactive isotope 14CO2 can only be applied in tracer concentrations of approximately 0.3% of whole CO2 content of the gas mixture (Stuhlfauth et al., 1990). So the rates for 14CO2 uptake during photosynthesis are quite small and the rates of gross CO2 assimilation and refixation as well as internal 14CO2 concentration calculated from this might have large errors. The stable isotope 13CO2, however, can be used in any concentration necessary, e.g. 3,000 μL L−1 13CO2 (and no 12CO2) to suppress photorespiration. The high signals for 13CO2 uptake facilitate correct determination of internal 13CO2 concentration, refixation, and gross CO2 assimilation. In addition, the evolution of 12CO2 through stomata (Fig. 2) and the influence of external conditions on it can directly be observed, which is impossible at 14CO2 measurements where 12CO2 uptake accompanies 12CO2 evolution at high external 12CO2 concentrations.
In contrast to Loreto et al. (1999), who observed the emission of 12CO2 in a 13CO2-atmosphere with a 13CO2-insensitive infrared gas-analyzer, the mass spectrometric method allows the monitoring of the 13CO2 signal in addition to the 12CO2 signal. Therefore, the determination of gross CO2 evolution, gross CO2 assimilation, and re-assimilation of (photo) respiratory CO2 out of gas exchange data is possible and it is not necessary to calculate carboxylation and oxygenation from the electron transport rate, often detected by fluorescence measurements, and theoretical considerations of Rubisco kinetics (Di Marco et al., 1994; Laisk and Sumberg, 1994; Loreto et al., 1994).
For the calculation of re-assimilation rates the determination of internal CO2 concentrations is necessary. Therefore, it is essential to measure leaf conductance carefully, especially under drought stress conditions where transpiration rates are small. Also, nonuniform stomatal closure, which does not occur in tomato leaves (not shown), would lead to a failure in ci calculations (Terashima, 1992) and, therefore, result in false estimations of refixation.
In addition to intercellular refixation, intracellular refixation may occur. Gerbaud and André (1987) assume the intracellular refixation of 12CO2 to be negligible because the carboxylation resistance would be dominant over the resistance for diffusion to the air space. On the other hand, high internal or stomatal resistances may favor intracellular re-assimilation (Laisk and Loreto, 1996), especially under drought stress. Intracellular re-assimilation, which is not considered by the method described here, may lead to an underestimation of gross CO2 assimilation and CO2 evolving reactions the extent of which is unknown.
Mitochondrial Respiration in the Light
It is widely accepted that oxidative phosphorylation occurs in the light (Sharp et al., 1984; Gerbaud and André, 1987). However, the magnitude of mitochondrial respiration in the light is still unclear (Krömer, 1995). In our experiments mitochondrial respiration in the light, which was determined at high CO2 concentrations, is smaller than photorespiration and almost light independent (Fig. 4). Light affects the activity of the pyruvate dehydrogenase complex by a light activated protein kinase. This kinase depends on the NH3 formed in the glycolate pathway (Randall et al., 1996). The inhibition of photorespiration by high CO2 during the measurement of mitochondrial respiration and, as a consequence, the deficiency in photorespiratory NH3 might result in less protein kinase activity and, therefore, in the pyruvate dehydrogenase complex being no longer inactivated in the light. This effect of non-photorespiratory conditions on mitochondrial respiration would also occur if 20 mL L−1 O2 are used to suppress photorespiration, but under these conditions light inhibition of mitochondrial respiration has often been observed (Krömer, 1995).
Mitochondrial respiration in the light is inhibited by water deficit in tomato plants (Fig. 4). According to Laisk and Sumberg (1994), the part of CO2 evolution in the light that cannot be attributed to the oxygenation reaction is influenced by the internal CO2 concentration. In mitochondrial respiration dissimilation of not only end products but also primary products occurs (Pärnik and Keerberg, 1995). Therefore, respiration in the light may depend on the amount of primary products, which are expected to be smaller in drought-stressed plants than in controls because of a decrease in CO2 assimilation. This could be a reason for lower rates of mitochondrial respiration in the light under drought stress. Functions of mitochondrial respiration in the light might be the supply of ATP and carbon skeletons for synthesis reactions in the cytosol and chloroplast or the oxidation of excess redox equivalents under light or drought stress (Krömer, 1995).
In this study, high CO2 concentrations were used to determine mitochondrial respiration in the light under non-photorespiratory conditions (Fig. 4). However, elevated CO2 may influence mitochondrial respiration and the rates at 3,000 μL L−1 CO2 may differ from those at 350 μL L−1 CO2. The effect of high CO2 concentrations on the rate of dark respiration seems to depend on growth conditions and varies in different plant species between 60% of inhibition and 30% of stimulation (Gonzàles-Meler et al., 1996). The inhibition of dark respiration could be the result of a direct effect on cytochrome c oxidase or succinat dehydrogenase (Gonzàles-Meler and Siedow, 1999). In tomato plants, mitochondrial respiration in the dark is not affected by 3,000 μL L−1 CO2 compared with 350 μL L−1 CO2 (Haupt-Herting, 2000). This leads to the conclusion that no inhibition of cytochrome c oxidase or other enzymes occurs. However, it is not yet fully understood how changes of CO2 assimilation and inhibition of photorespiration may influence dissimilatory processes.
At high CO2 concentrations, Laisk and Sumberg (1994) detected carboxylation of a substrate other than RuBP, in addition to RuBP carboxylation, that may be caused by phosphoenolpyruvate carboxylase activity. In our respiration measurements this non-RuBP carboxylation would be included in TPS and the rate of respiration in the light calculated from this TPS value is independent from the type of CO2 assimilation. But mitochondrial respiration in the light determined by the 12CO2/13CO2 technique could be accompanied by CO2 evolution from the decarboxylation of malate or pyruvate (Laisk and Sumberg, 1994).
Photorespiration and Re-Assimilation of (Photo) Respiratory CO2
Most studies dealing with the effects of light intensity or drought stress on photorespiration used 16O2/18O2 mass spectrometry to determine gross O2 uptake, which is often related to photorespiration without taking mitochondrial respiration or Mehler reaction into account (Renou et al., 1990; Tourneux and Peltier, 1995). In our investigations, however, oxygen as well as carbon fluxes have carefully been determined (Haupt-Herting, 2000; Haupt-Herting and Fock, 2000). In control plants of tomato the rate of photorespiration is 22% of the rate of gross CO2 assimilation (Figs. 3 and 4). This matches data of 18O- or 14C-labeling of intermediates of the glycolate pathway, which proved that photorespiration is 27% of net photosynthesis at ambient CO2 concentration in wheat (de Veau and Burris, 1989).
In the experiments presented here, photorespiratory CO2 release is stimulated by light and rises relatively to CO2 uptake under drought stress (Figs. 4 and 5). This is in accordance with earlier results (Thomas and André, 1982; Tourneux and Peltier, 1995; Biehler and Fock, 1996).
Studies on tomato plants showed that in addition to A and TPS the activity of photosystem II as well as gross O2 uptake decrease in relation to water deficit (Haupt-Herting and Fock, 2000) and that the reduction of A cannot solely be caused by reduced internal CO2 concentration. In stressed tomato plants a greater part of photosynthetic electrons flows to oxygen rather than to CO2 than in the controls. It appears that these electrons feed Mehler reaction and the photosynthetic oxidation cycle.
The CO2 evolved by (photo) respiration is partly re-assimilated into the Calvin cycle. Drought stress results in a remarkable increase of the contribution of re-assimilation to gross CO2 assimilation in tomato plants (Fig. 5). Corresponding data have been found earlier in Digitalis lanata (Stuhlfauth et al., 1990). Re-assimilation of CO2 consumes ATP and reducing equivalents, and higher rates of re-assimilation under water deficit were interpreted as contribution to the degradation of excess electrons (Fock et al., 1992). Also, re-assimilation maintains carbon flux and enzyme substrate turnover, which helps the plant to recover after rewatering (Stuhlfauth et al., 1990). Thus, photorespiration plays an important role in protecting plants from photoinhibition by using up excessive photosynthetic electrons in the glycolate pathway and by re-assimilation of (photo) respiratory CO2.
MATERIALS AND METHODS
Plant Growth and Stress Application
Tomato (Lycopersicon esculentum Mill. cv Moneymaker; Hild, Marbach, Germany) seeds were sown individually in small pots of compost (ED 73, Einheitserdenwerk, Hameln, Germany) and then transferred to 2.5-L pots with a mixture of 10% sand in potting compost 7 d after germination. Plants were grown in a growth chamber under weak light (200 μmol photons m−2 s−1) during a 16-h-light period with 23°C in the light and 17°C in the dark with a constant relative air humidity of 70%. Plants were watered daily and regularly supplied with a commercial nutrient solution (Flori 3, Planta Düngemittel, Regenstauf, Germany). The youngest, fully expanded leaf (normally the fifth leaf from the top) of 5-week-old plants was used. Leaves of well watered plants then showed a leaf water potential of −0.6 MPa measured according to Scholander et al. (1965) with a pressure bomb (self constructed, Metallwerkstätten der Universität, Kaiserslautern, Germany). To induce an almost natural, reversible drought stress allowing the plant enough time to acclimate, irrigation was stopped 2, 5, or 8 d before measurements were taken. These treatments resulted in weak (leaf water potential −0.9 MPa), moderate (−1.3 MPa), or severe water stress (−1.8 MPa). Even severely stressed plants showed complete recovery of leaf water potential, transpiration, and net photosynthesis after rewatering.
The CO2 Isotope Fluxes in Illuminated Leaves
To determine true CO2 assimilation, photorespiration, and mitochondrial respiration in the light in attached leaves, we use 13CO2 and mass spectrometry to measure the 13CO2 flux into and the 12CO2 flux out of an illuminated leaf.
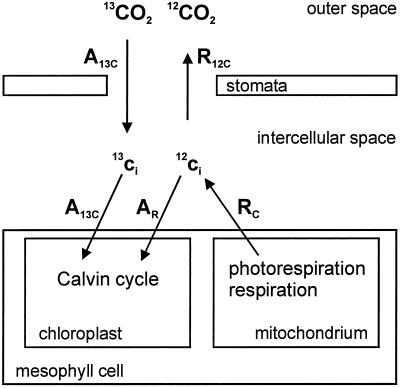
Figure 6 shows the fluxes of 13CO2 and 12CO2 into and out of an illuminated leaf, respectively. The 13CO2 isotope provided in the atmosphere (e.g. 350 μL L−1 pure 13CO2 and no 12CO2) is taken up into the intercellular space and the mesophyll cells to be assimilated in the Calvin cycle, which is located in the chloroplasts. The 13CO2 isotope is not evolved by photorespiration or mitochondrial respiration after internal cycling through primary products for the first 20 to 30 s (Ludwig and Canvin, 1971; Gerbaud and André, 1987; Pärnik and Keerberg, 1995). Therefore, net 13CO2 uptake equals gross 13CO2 uptake (A13C) for the first 20 s after switching to 13CO2. Photorespiration and mitochondrial respiration release 12CO2 into the intercellular space (RC). A part of this 12CO2 is re-assimilated in the Calvin cycle (AR), whereas the other part is evolved into the atmosphere. Because the 12CO2 concentration is in the atmosphere and, therefore, 12CO2 uptake is very small, net 12CO2 evolution (R12C) can be registered outside the leaf. Refixation of 12CO2 occurs corresponding to the fixation rate of 13CO2 and depends on the ratio of the internal concentrations of 12CO2 to 13CO2. The discrimination of 13CO2 is small (27‰; Farquhar et al., 1982) and needs not be taken into account.
Figure 6.
Scheme of CO2 fluxes into and out of an illuminated leaf provided with 13CO2 in the atmosphere. The fluxes of 13CO2 and 12CO2 measurable outside the leaf (gross 13CO2 uptake A13C; 12CO2 release R12C) and the assumed fluxes inside the leaf (gross 12CO2 release RC; 12CO2 re-assimilation AR) are shown. For further details see text in “Materials and Methods.”
Gas Exchange Measurements
The Open Gas-Exchange System
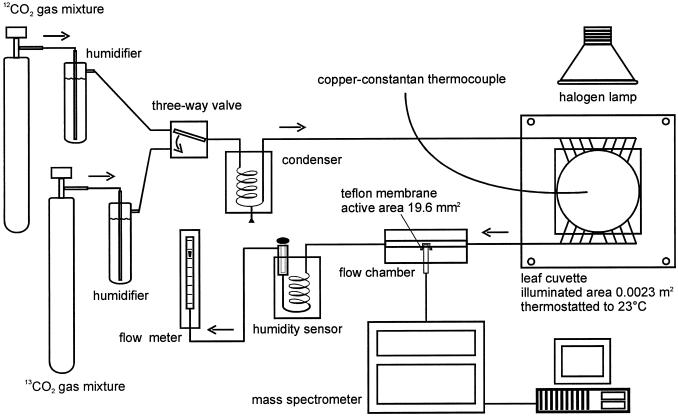
The rates of net CO2 uptake (A), true photosynthetic CO2 assimilation (TPS), and gross CO2 release (RC) by attached leaves were determined at photosynthetic steady state in an open gas exchange system coupled to a mass spectrometer (Fig. 7). The continuous gas stream (50 L h−1) passed through a humidifier and a condenser to achieve a relative air humidity of 70%. A three-way valve allows the gas stream to be switched between 12CO2 and another gas stream containing the same concentration of pure 13CO2. The system contained a thermostated aluminum leaf cuvette illuminated by a halogen lamp and a thermostated flow chamber (self constructed, Metallwerkstätten der Universität, Kaiserslautern, Germany) with a teflon-membrane inlet into a quadrupole mass spectrometer (5970 Series Mass Selective Detector, Hewlett-Packard, Waldbronn, Germany) where the concentrations of 13CO2 (m/z = 45) and 12CO2 (m/z = 44) in the gas stream were detected simultaneously and continuously. The diffusion through the Teflon-membrane and the sensitivity of the mass spectrometer were equal for both isotopes. No significant drifts in the CO2 signals occur during the measuring time. The partial pressure of water vapor in the air was measured with a humidity sensor (HMP 233, Vaisala, Hamburg, Germany). Leaf temperature was determined with a copper-constantan-thermocouple in contact with the lower side of the leaf.
Figure 7.
Diagram of the open gas exchange system used for 12CO2/13CO2 measurements.
Proceeding of the Gas-Exchange Measurement and CO2 Flux Calculations
At the beginning of an experiment the mass spectrometric signals for 12CO2 (350 μL L−1) without a leaf in the cuvette are registered. Then an attached leaf is placed into the cuvette and illuminated in a continuous gas stream (50 L h−1) containing 12CO2 until photosynthetic steady state is reached. The rates of net photosynthetic CO2 uptake (A), transpiration (E), and leaf conductance (gs) are calculated as previously described (Biehler and Fock, 1996).
At steady-state photosynthesis, a gas mixture containing no 12CO2 but 13CO2 in air is suddenly supplied to the leaf for 1 min. The rate of 13CO2 assimilation (A13C) can be calculated from the gas flow rate (F, [μmol s−1]), the difference in 13CO2 concentration with (13co) and without a leaf (13ca, [μL L−1]) in the cuvette and the illuminated leaf area (a, [m−2]):
 |
Re-assimilation of released 12CO2 (AR) must be taken into account when calculating the rate of true CO2 assimilation (Fig. 6). The 12CO2 isotope will be re-assimilated according to 13CO2 assimilation and the ratio of internal concentrations of 12CO2 and 13CO2. The rate of re-assimilation of 12CO2 (AR) is then:
 |
The internal concentrations of CO2 can be calculated from the fluxes of CO2 into or out of the leaf, the external CO2 concentration, and the leaf conductance (gs) determined from transpiration measurements:
 |
The internal 13CO2 concentration is calculated from the 13CO2 flux into the leaf, whereas the internal 12CO2 concentration is calculated from the 12CO2 flux out of the leaf as determined by the mass spectrometer.
The rate of true CO2 assimilation (TPS), which is the sum of 13CO2 assimilation (A13C) and 12CO2 re-assimilation (AR), is given by:
 |
and the rate of gross CO2 release (RC), which is the sum of photorespiration and mitochondrial respiration, can be written as:
 |
For measurements of mitochondrial respiration in the light the leaf was provided with 3,000 μL L−1 12CO2 (to inhibit photorespiration) until steady state was reached, and then 12CO2 was replaced by the same concentration of 13CO2. RC, calculated as described above, is then a measure for the rate of mitochondrial respiration, which is the only reaction pathway releasing CO2 under these conditions. It is assumed that the rate of mitochondrial respiration in the light is not affected by CO2 partial pressures between 350 and 3,000 μL L−1 CO2.
Measurements at different light intensities were done on the same leaf one after the other beginning with the lowest intensity. It was carefully checked that no 13CO2 taken up in the previous measurement was released in the subsequent run. In these experiments 13CO2 was offered for only 1 min before the gas mixture containing 12CO2 was applied again. The ground signal for 13CO2 was then reached within 2 min and 13CO2 was not evolved from the leaf.
ACKNOWLEDGMENT
We thank Dr. David Lawlor (IACR-Rothamsted, Harpenden, UK) for critically reading the manuscript.
LITERATURE CITED
- Badger MR. Photosynthetic oxygen exchange. Annu Rev Plant Physiol. 1985;36:27–53. [Google Scholar]
- Bauwe H, Keerberg O, Bassüner R, Pärnik T, Bassüner B. Reassimilation of carbon dioxide by Flaveria (Asteraceas) species representing different types of photosynthesis. Planta. 1987;172:214–218. doi: 10.1007/BF00394590. [DOI] [PubMed] [Google Scholar]
- Biehler K, Fock H. Estimation of non-cyclic electron transport in vivo of Triticum using chlorophyll fluorescence and mass spectrometric O2 evolution. J Plant Physiol. 1995;145:422–426. [Google Scholar]
- Biehler K, Fock H. Evidence for the contribution of the Mehler peroxidase reaction in dissipating excess electrons in drought-stressed wheat. Plant Physiol. 1996;112:265–272. doi: 10.1104/pp.112.1.265. [DOI] [PMC free article] [PubMed] [Google Scholar]
- Bradford KJ, Hsiao TC. Lange OL, Nobel PS, Osmond CB, Ziegler H, eds, Encyclopedia of Plant Physiology. 12B. Berlin: Springer-Verlag; 1982. Physiological responses to moderate water stress; pp. 263–324. [Google Scholar]
- Catzky J, Jarvis PG, Sestak Z. Plant photosynthetic production. In: Junk W, editor. Manual of Methods. N.V. The Hague, The Netherlands: Publishers; 1971. [Google Scholar]
- Cornic G. Drought stress and high light effects on leaf photosynthesis. In: Baker NR, Bowyer JR, editors. Photoinhibition of Photosynthesis. Oxford: BIOS Scientific Publishers; 1994. pp. 297–313. [Google Scholar]
- de Veau EJ, Burris JE. Photorespiratory rates in wheat and maize as determined by 18O-labeling. Plant Physiol. 1989;90:500–511. doi: 10.1104/pp.90.2.500. [DOI] [PMC free article] [PubMed] [Google Scholar]
- Di Marco G, Iannelli MA, Loreto F. Relationship between photosynthesis and photorespiration in field-grown wheat leaves. Photosynthetica. 1994;30:41–51. doi: 10.1007/BF02183042. [DOI] [PubMed] [Google Scholar]
- Farquhar GD, O'Leary MH, Berry JA. On the relationship between carbon isotope discrimination and the intercellular carbon dioxide concentration in leaves. Aust J Plant Physiol. 1982;9:121–137. [Google Scholar]
- Fock HP, Biehler K, Stuhlfauth T. Use and degradation of light energy in water stressed Digitalis lanata. Photosynthetica. 1992;27:571–577. [Google Scholar]
- Gerbaud A, André M. An evaluation of the recycling in measurements of photorespiration. Plant Physiol. 1987;83:933–937. doi: 10.1104/pp.83.4.933. [DOI] [PMC free article] [PubMed] [Google Scholar]
- Gonzàles-Meler MA, Ribas-Carbó M, Siedow JN, Drake BG. Direct inhibition of plant mitochondrial respiration by elevated CO2. Plant Physiol. 1996;112:1349–1355. doi: 10.1104/pp.112.3.1349. [DOI] [PMC free article] [PubMed] [Google Scholar]
- Gonzàles-Meler MA, Siedow JN. Direct inhibition of mitochondrial respiratory enzymes by elevated CO2: does it matter at the tissue or whole-plant level? Tree Physiol. 1999;19:253–259. doi: 10.1093/treephys/19.4-5.253. [DOI] [PubMed] [Google Scholar]
- Haupt-Herting S. Nutzung und Entwertung von Lichtenergie in höheren Pflanzen: Die Auswirkungen von Trockenstreβ auf den Primärstoffwechsel von Lycopersicon esculentum und einer high-pigment Mutante. PhD thesis. Kaiserslautern, Germany: University of Kaiserlautern; 2000. [Google Scholar]
- Haupt-Herting S, Fock HP. Exchange of oxygen and its role in energy dissipation during drought stress in tomato plants. Physiol Plant. 2000;110:489–495. [Google Scholar]
- Jackson WA, Volk RJ. Photorespiration. Annu Rev Plant Physiol. 1970;21:385–432. [Google Scholar]
- Krömer S. Respiration during photosynthesis. Annu Rev Plant Physiol Plant Mol Biol. 1995;46:45–70. [Google Scholar]
- Laisk A, Loreto F. Determining photosynthetic parameters from leaf CO2 exchange and chlorophyll fluorescence. Plant Physiol. 1996;110:903–912. doi: 10.1104/pp.110.3.903. [DOI] [PMC free article] [PubMed] [Google Scholar]
- Laisk A, Sumberg A. Partitioning of the leaf CO2 exchange into components using CO2 exchange and fluorescence measurements. Plant Physiol. 1994;106:689–695. doi: 10.1104/pp.106.2.689. [DOI] [PMC free article] [PubMed] [Google Scholar]
- Lawlor DW. Effects of water deficit on photosynthesis. In: Smirnoff N, editor. Environment and Plant Metabolism. Oxford: BIOS Scientific Publishers; 1995. pp. 129–160. [Google Scholar]
- Loreto F, Delfine S, Di Marco G. Estimation of photorespiratory carbon dioxide recycling during photosynthesis. Aust J Plant Physiol. 1999;26:733–736. [Google Scholar]
- Loreto F, Di Marco G, Tricoli D, Sharkey TD. Measurements of mesophyll conductance, photosynthetic electron transport and alternative electron sinks of field grown wheat leaves. Photos Res. 1994;41:397–403. doi: 10.1007/BF02183042. [DOI] [PubMed] [Google Scholar]
- Ludwig JL, Canvin DT. An open gas-exchange system for the simultanous measurement of the CO2 and 14CO2 fluxes from leaves. Can J Bot. 1971;49:1299–1313. [Google Scholar]
- Pärnik T, Keerberg O. Decarboxylation of primary products of photosynthesis at different oxygen concentrations. J Exp Bot. 1995;46:1439–1447. [Google Scholar]
- Randall DD, Miernyk JA, David NR, Gemel J, Luethy MH. Regulation of leaf mitochondrial pyruvate dehydrogenase complex activity by reversible phosphorylation. In: Shewry PR, Helford NG, editors. Protein Phosphorylation in Plants. Oxford: Clarendon Press; 1996. pp. 87–103. [Google Scholar]
- Renou JL, Gerbaud A, Just D, André M. Differing substomatal and chloroplastic CO2 concentrations in water-stressed wheat. Planta. 1990;182:415–419. doi: 10.1007/BF02411393. [DOI] [PubMed] [Google Scholar]
- Scholander PF, Hammel HT, Bradstreet ED, Hemmingsen EA. Sap pressure in vascular plants. Science. 1965;148:339–346. doi: 10.1126/science.148.3668.339. [DOI] [PubMed] [Google Scholar]
- Sharp RE, Matthews MA, Boyer JS. Kok effect and the quantum yield of photosynthesis. Plant Physiol. 1984;75:95–101. doi: 10.1104/pp.75.1.95. [DOI] [PMC free article] [PubMed] [Google Scholar]
- Sharkey TD, Berry JA, Sage RF. Regulation of photosynthetic electron-transport in Phaseolus vulgaris L., as determined by room-temperature chlorophyll a fluorescence. Plant. 1988;176:415–424. doi: 10.1007/BF00395423. [DOI] [PubMed] [Google Scholar]
- Stuhlfauth T, Scheuermann R, Fock HP. Light energy dissipation under water stress conditions: contribution of reassimilation and evidence for additional processes. Plant Physiol. 1990;92:1053–1061. doi: 10.1104/pp.92.4.1053. [DOI] [PMC free article] [PubMed] [Google Scholar]
- Terashima I. Anatomy of non-uniform leaf photosynthesis. Photosynth Res. 1992;31:195–212. doi: 10.1007/BF00035537. [DOI] [PubMed] [Google Scholar]
- Thomas DA, André M. The response of oxygen and carbon dioxide exchanges and root activity to short term water stress in soybean. J Exp Bot. 1982;33:393–405. [Google Scholar]
- Tourneux C, Peltier G. Effect of water deficit on photosynthetic oxygen exchange measured using 18O2 and mass spectrometry in Solanum tuberosum L. leaf discs. Planta. 1995;195:570–577. [Google Scholar]


