

Abstract
PURPOSE
This study addresses the challenges in obtaining abdominal 4D flow MRI of obese patients. We aimed to evaluate spectral saturation and inner volume excitation as methods to mitigating artifacts originating from adipose signals, with the goal of enhancing image quality and improving quantification.
METHODS
Radial 4D flow MRI acquisitions with fat mitigation (Inner Volume Excitation (IVE) and intermittent fat saturation (FS)) were compared to a standard slab selective excitation (SSE) in a test-retest study of 15 obese participants. IVE selectively excited a cylindrical region of interest, avoiding contamination from peripheral adipose tissue, while FS globally suppressed fat based on spectral selection. Acquisitions were evaluated qualitatively based on expert ratings and quantitatively based on conservation of mass, test-retest repeatability, and a divergence free quality metric. Errors were evaluated statistically using the absolute and relative errors, regression, and Bland-Altman analysis.
RESULTS
IVE demonstrated superior performance quantitatively in the conservation of mass analysis in the portal vein, with higher correlation and lower bias in regression analysis. IVE also produced flow fields with the lowest divergence error and was rated best in overall image quality, delineating small vessels, and producing the least streaking artifacts. Evaluation results did not differ significantly between FS and SSE. Test-retest reproducibility was similarly high for all sequences, with data suggesting biological variations dominate the technical variability.
CONCLUSION:
IVE improved hemodynamic assessment of radial 4D flow MRI in the abdomen of obese participants while FS did not lead to significant improvements in image quality or flow metrics.
INTRODUCTION
Approximately one million individuals suffer from liver cirrhosis (i.e. end-stage liver disease) in the United States alone. Many more people are at risk of developing cirrhosis due to chronic liver disease including nonalcoholic fatty liver disease (NAFLD), chronic hepatitis, etc.1,2 Cirrhosis is characterized by fibrosis of the liver, which leads to portal hypertension and associated alterations in portal blood flow.3 Quantifying portal blood flow in the portal venous system may address the unmet need of noninvasive detection of gastroesophageal varices at high risk for bleeding,4 aid in surgical planning and monitoring of interventions including transjugular intrahepatic portosystemic shunts (TIPS),5 liver transplantation, and other diseases of the liver. However, imaging of the portal venous system to date has largely focused on anatomic imaging or has focused on velocity measurements in single vessels (Doppler U/S, 2D phase contrast MRI). Recently, 4D flow MRI has been proposed as an alternative to measure flow and velocity in the entire portal venous system in a single exam.6,7 4D flow MRI has provided quantitative blood flow with high spatial resolution in the hepatic and splanchnic vasculature with good interobserver variability, test-retest repeatability, and internal consistency.8-10 Abdominal 4D flow MRI has substantial potential for hepatic applications,11-13 as well as for other applications14,15 such as mesenteric ischemia16,17 and renal artery disease.18
Unfortunately, achieving sufficient image quality in the abdomen using 4D flow MRI is challenging. due to cardiac and respiratory gating, a need for large volumetric coverage, complex anatomy with frequent anatomical variants, and varying velocity ranges of interest (e.g., arterial, portal venous, and venous flow velocities).15 One major challenge to the widespread use of abdominal 4D flow MRI is the frequently compromised image quality in obese patients. A myriad of technical issues arise in imaging obese patients including radiofrequency (RF) wave effects, lower signal-to-noise ratio (SNR) from increased receiver coil distance,19 larger required imaging volumes with associated longer acquisition times, and higher and more heterogenous local RF energy deposition.20-22 In 4D flow MRI, obesity can lead to amplified imaging artifacts and inaccuracies in the velocity maps, which can cause errors in the flow quantification.23 Additionally, in obese subjects, there is confounding signal emanating from fatty tissue of the limbs and pelvis leading to chemical shift artifacts.24 These effects are aggravated by the B0, B1, and gradient non-linearities that occur at the edge of the MRI bore. This is especially true for undersampled non-cartesian imaging such as radial 4D flow MRI, where these errors lead to streak artifacts23.
Methods to reduce the confounding influence of fat on 4D flow MRI are needed to enable its robust application to abdominal flow quantification. Fat suppression methods have previously been proposed to improve 4D flow and have been initially shown to reduce residual respiration artifacts and improve the delineation of vessels.25 However, fat saturation may be compromised in the presence of B0 field heterogeneity, requires additional time, and leads to higher RF power deposition. Alternatively, water selective excitation using binomial pulses has also been explored in the context of spiral 4D flow imaging,26 where fat mitigation is required to remove the substantial off resonance blurring inherent to spiral sampling. Water excitation techniques can reduce acquisition time limitations compared to fat saturation techniques27; however, their performance suffers from both magnetic field inhomogeneity and flow artifacts.28 Chemical shift encoded (CSE) water-fat separation is an effective method to reduce fat signal by acquiring images at multiple TEs and utilizing modeling to separate fat and water retrospectively. CSE is insensitive to magnetic field inhomogeneities, using multiple repeated measurements to separate fat and water. In prior work, Johnson et al investigated the combination of velocity and CSE-MRI, applied this method to 3D radial imaging, and determined methods to reduce the number of encodings and consequently acquisition time.23 This method provided excellent fat suppression and improved vessel visualization; however, it required complex reconstruction methods and markedly increased acquisition times.
This work explores 2D selective excitation of a target volume of interest as a means to reduce the high signal from peripheral fat.29 Such inner volume excitation methods (IVE) have been widely applied to reduce artifacts and accelerate acquisitions. For example, Wargo et al demonstrated that use of two-dimensional selective rectangular spiral RF pulse in higher strength systems operating at 7T leads to lower artifact power and high apparent SNR in multi-slice acquisitions.30 Recently, Wink et al demonstrated the application of 2D selective RF pulse for accelerating 4D Flow MRI acquisition and reducing swallowing artifacts in neurovascular imaging applications.31 However, these techniques have not been investigated for abdominal imaging or in the context of obese patients. Here, we introduce a radial 4D flow MRI with inner volume excitation (IVE) as a method to excite the abdominal vasculature of interest while mitigating the signal from subcutaneous fat arising from the limbs and body of a subject. We then perform a comprehensive test-rest comparison in obese participant of the proposed IVE 4D flow technique to 4D flow with slab selective excitation (SSE) and 4D flow with intermittent fat saturation (FS). We rigorously evaluate the quantitative and qualitative differences in portal venous blood flow measures.
METHODS
Study Cohort
17 obese volunteers with a body mass index (BMI) above 35 and no known liver pathologies were recruited in this Health Insurance Portability and Accountability Act (HIPAA)-compliant and Institutional Review Board (IRB)-approved study. One subject was unable to complete the acquisition due to claustrophobia and one subject was excluded due to sequence settings inconsistent with the other subjects. Consequently, the final cohort for this study consisted of 15 participants, with 9 females (60%) and 6 males. Subjects' ages ranged from 34 to 64 years old (M = 51, SD = 8), and their weights varied from 95 kg to 160 kg (M = 119, SD = 16) with BMI between 36.9 and 50.7 (M = 41.7, SD = 4.1). Informed written consent was obtained from the volunteers prior to inclusion in the study. Volunteers were instructed to fast for five hours prior to the exam to avoid the well documented effects of a meal on flow during the exam.32
Imaging Protocol
Abdominal 4D flow MRI exams are frequently acquired after the administration of a contrast agent, which is required for the diagnosis of many liver pathologies. For this study, we administered 3mg/kg of ferumoxytol (Feraheme, AMAG Pharmaceuticals, diluted 5:1 in normal saline) prior to imaging. Ferumoxytol’s long intravascular half-life (14-15 hours) enables a high and consistent vascular signal for the duration of the imaging exam.33 It was administered intravenously over 15 minutes prior to the MRI exam with safety precautions following ISMRM guidelines (off-label use).34 Participants were examined with their arms positioned next to the body at 3T (bore diameter: 70 cm, Signa Premier, GE Healthcare, WI, USA) using an anterior array coil (Air Coil, GE Healthcare) and embedded table coils.
The imaging protocol consisted of three separate radial 4D flow MRI acquisitions, all of which used 5-point flow encoding and 3D radial (kooshball) sampling35 covering the abdomen. The protocol was designed to compare standard slab selective excitation (SSE) and fat mitigated 4D flow based on intermittent fat saturation (FS) and inner volume excitation (IVE) based on 2D selective excitation. These three sequences were collected back-to-back and then all three were repeated to investigate the test-retest repeatability. Between imaging sessions, the participant was removed from the MRI system, requested to sit up and lie back down, the coil was repositioned, the participant placed back in the bore of the MRI table, and new localizer sequences were acquired. This resulted in two sets of MRI exams for each acquisition and a total of six data sets for each participant. The sequences are described as follows below with Figure 1 providing sequence diagrams for each. More detailed sequence diagrams are provided in Supporting Figure S1-3.
Figure 1.
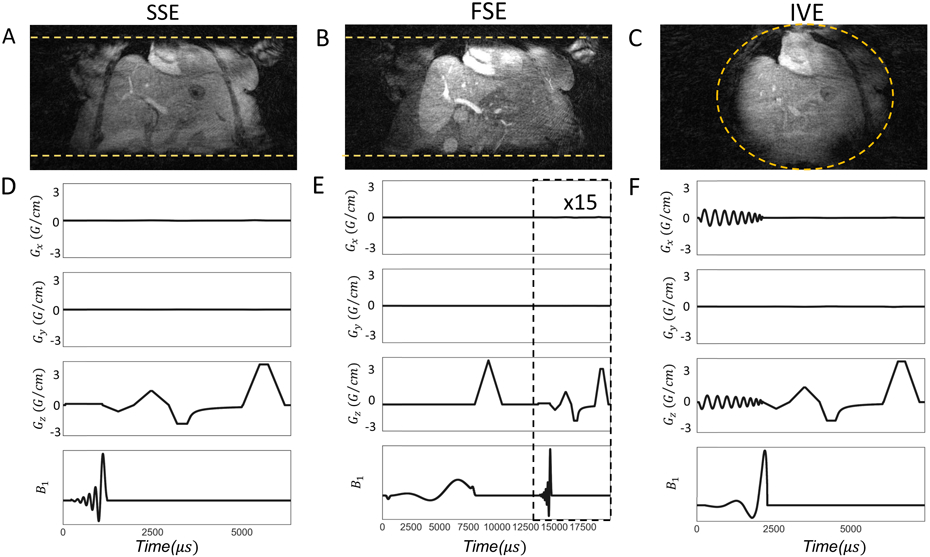
Coronal reformats acquired by each excitation scheme are depicted in 1(A)-1(C). The yellow horizontal lines in 1(A),1(B) and the circle in 1(C) represent the excited imaging volume. Gradient waveforms (Gx, Gy, Gz) and B1 pulse sequences for SSE, FS and IVE are illustrated in 1(D)-1(F) respectively. For representative purposes, a single projection along the z axis is shown with flow compensation. Sequence diagrams with additional details can be found in the Supporting Figure S1-3.
A target imaging volume of 48x48x24cm3 in R/L, A/P and S/I directions respectively was used for all the sequences. 3D radial sampling was performed with density adapted sampling36 with a 75% fractional echo to shorten echo times.
The Velocity encoding (VENC) was set to 60cm/s to achieve a reasonable balance between velocity-to-noise ratio (VNR) and velocity aliasing. During the acquisition, respiratory positions and cardiac phases were recorded with a respiratory belt and peripheral pulse gating, respectively.
Standard Selective Excitation (SSE)
This standard selective excitation sequence was included in the protocol as a control to compare image quality without any form of fat mitigation. This sequence utilizes a 1D slab selection in the superior/inferior direction with a width of 240mm followed by the radial 4D flow acquisition. Imaging parameters include TE/TR = 2.4ms/6.5ms, flip angle = 14°, 18300 projection angles, 1.25mm isotropic spatial resolution, and 10 minutes of acquisition time.
Fat Saturation (FS)
The fat saturation sequence was similar to the standard sequence but intermittently applied a spectrally selective fat saturation using an 8ms, 90-degree pulse followed by a strong spoiler gradient. 15 imaging excitations were performed consisting of 3 unique projection angles with 5 flow encodings each between fat suppression pulses. The rate of fat saturation was tuned empirically to balance the increase in acquisition time, RF deposition, and fat saturation efficacy. All parameters were similar to the standard sequence; however, only 16300 projections were collected to match the acquisition times.
Inner Volume Excitation (IVE)
Pauly et al37 introduced the 2D spatially selective excitation based on the excitation k-space paradigm and small flip angle approximation. Later, selective excitation was employed in phase contrast velocimetry with one-dimensional velocity encoding.38-40 Recently, Wink et al31 devised an approach for the incorporation of 2D-selective excitation in combination with 3-directional velocity encoding such as 4D flow MRI, accounting for the isophase time point of excitation. In 4D flow the location of isophase time point in the 2D selective excitation in the presence of flow is vital but ambiguous in different reports.6,7 Wink et al31 thus defined isophase time point as the virtual time point during excitation at which all spins are in phase. The implementation of the inner volume excitation sequence was inspired by Wink et al.31 The selective radio frequency (RF) pulse for inner volume excitation was designed in SigPy.42 The excitation RF pulse was computed using a center-in Archimedean spiral k-space trajectory based on the small flip angle approximation,37 with field of excitation(FOX)= 50 cm and a resolution= 3 cm, rotations= 8.33 and a maximum k-space, kmax=0.166 1/cm. The gradient waveforms were designed using arc length-based principles.43 A circular excite pattern with a 24cm diameter was calculated based on a Non-Uniform Fast Fourier Transform (NUFFT) and used as the RF waveform with a Gaussian window applied to reduce Gibbs ringing. To avoid excitation of the arms and reduce the excited FOV, the IVE pulse was applied in R/L and S/I directions, exciting a cylindrical volume perpendicular to the direction of the magnet bore. Again, the sequence used matched parameters to the standard sequence but with a differing TE/TR (2.2ms/7.6ms) as required for the 2D excitation and fewer projections (16000) to match acquisition time of 10 minutes.
Reconstruction
Raw data along with physiological gating files were stored for each acquisition for offline reconstruction. The reconstruction procedure used the measurements from the sequence to correct the trajectory using a thin slice calibration method for each volunteer.44 Images were reconstructed using a NUFFT followed by coil combination using sensitivity estimates from low resolution images reconstructed from the same data.7 Retrospective respiratory gating was utilized to include 50% of the data representing end expiration data based on a 10 seconds moving window analysis, and combined across the entire cardiac cycle to represent a time-averaged reconstruction.45 The reconstruction yielded five imaging volumes: velocity images in three separate orthogonal directions, signal magnitude, and a complex difference angiogram. Velocity images were corrected for Maxwell terms as part of the reconstruction process.46
Flow Measurements
Time-averaged velocity vectors and angiograms were imported into GTFlow (v4.8.4 Gyrotools, Zurich, Switzerland) for hemodynamic visualization and interactive flow measurements. Background phase correction was applied using a bicubic fit algorithm to background tissues. Background tissue masks were set based on thresholding the complex difference angiogram. Time-averaged volumetric flow rate at six separate planes orthogonal to the vessels in the portal venous system was measured. Using the complex difference angiogram, the planes were positioned carefully in the superior mesenteric vein (SMV), splenic vein (SV), caudal portal vein (PV1), cranial portal vein (PV2), right portal vein (RPV) and left portal vein (LPV). Figure 2 is a schematic of the central portal venous anatomy, including the splenomesenteric confluence and the portal bifurcation, and shows the positions of the cut-planes used for flow analysis. Cut-planes were positioned as close as possible to the confluence/bifurcation to exclude bias due to small tributary vessels. Each vessel was segmented manually on the complex difference angiogram. A colored overlay of through-plane velocities above 3cm/s served as auxiliary tool to consistently delineate the vessel contour.
Figure 2.
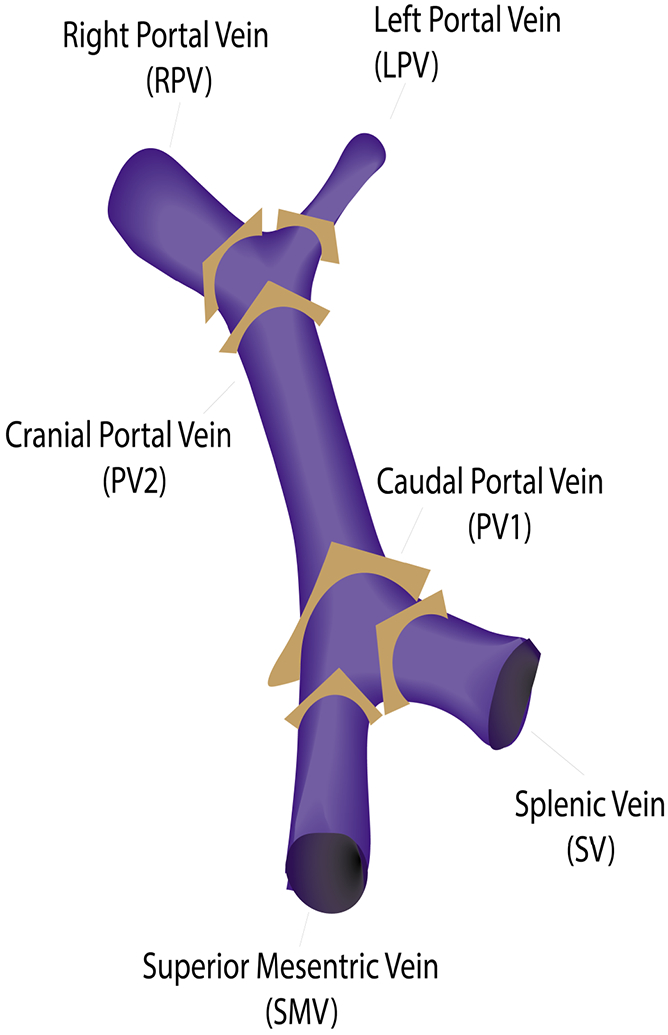
Orthogonal cut-planes were positioned closely to the splenomesenteric confluence [superior mesenteric vein (SMV), splenic vein (SV), caudal portal vein (PV1)], and the portal bifurcation [cranial portal vein (PV2), right portal vein (RPV) and left portal vein (LPV)].
Analysis
The three sequences were evaluated quantitatively based on conservation of mass, test-retest repeatability, and a flow quality metric based on divergence. For qualitative evaluation, expert ratings and divergent error vector maps were analyzed. Pearson correlation, regression and Bland Altman analysis were used to evaluate the differences of the measures between the different sequences. Flow differences in all 6 cut planes were evaluated across sequences, repeated scans, and through conversation of mass analysis.
Conservation of mass analysis
Internal consistency of flow measurements was evaluated with conservation of mass analysis at the confluence and bifurcation of the portal vein. Conservation of mass analysis was based on the flow continuity principle and analyzed using the measured blood flows () such that inbound flow equals outbound flow at both the confluence and the bifurcation (; , respectively).
Visual Quality Ranking
Two board-certified radiologists both with 9 years of experience in vascular imaging conducted qualitative assessment of the complex difference-based angiograms. Readers were presented with 62.5 mm thick scrollable coronal limited maximum intensity projection (MIP) images for all three sequences with the order of the images coded and randomized. The blinded evaluation process involved each radiologist ranking 30 scan sessions generated from 15 test sessions and 15 retest sessions resulting in a combined total of 60 ratings of the three sequences. Images were ranked based on three separate criteria: presence of streaking artifacts, delineation of small vessel structures, and overall image quality. Overall image quality and delineation of small vessels were assessed as best, medium, and worst, while presence of streaking artifacts was graded as lowest, medium, and highest.
Divergence-Free Quality Metric
To provide a semi-quantitative metric of pixelwise velocity quality, velocity fields generated by the 3 approaches were compared using a divergence-free quality metric. Blood flow can be deemed divergent-free.47 Consequently, any divergence in the 4D flow acquisition can be attributed to corruption due to noise,48 acceleration, incomplete background phase correction, insufficient spatial resolution, or other artifacts. We calculated a metric based on the comparison of the original velocity field with the velocity processed through divergence-free denoising. We specifically computed the normalized root mean square error velocity ( according to the standard definition.48 This metric is expressed as:
where, N stands for the number of segmented voxels, , represent the velocity vectors before and after denoising, respectively. If a velocity field is noise and divergent free, this metric will return 0. Realistically, the metric is impacted by the combination of noise, divergence-related artifacts, and errors in divergence-free denoising. Divergence-free denoising was accomplished using a finite difference method (FDM) performed in MATLAB (2021b, MathWorks, USA).49 Vessel segmentations are required for projection based divergent denoising like FDM based approaches to avoid undesirable boundary effects near edges.48 Considering this limitation, the reconstructed angiograms of the acquisitions were segmented similarly before denoising. Volumes were cropped to include the portal venous anatomy. Subsequently, the portal vasculature was segmented using complex difference-based image and a threshold set manually for each case. Following segmentation, velocity fields were masked and denoised using an FDM method. Error vectors were calculated from subtracting the denoised flow field from the original flow field. For exemplary visualization of denoised flow vectors and the error vectors, vector visualization was performed in EnSight (v2020 R1, ANSYS, USA) with portal venous segmentation performed in MIMICS (v18.0, Materialise Interactive Medical Image Control System, Belgium).
RESULTS
Qualitative Evaluation
Figure 3 illustrates the streaking artifacts, small vessel delineation, and the overall image quality in the magnitude image and angiogram for an exemplary volunteer in the three acquisitions. Source images are provided in Supporting Figure S4. SSE and FS have substantial horizontal streaking artifacts, appearing to originate from the subject’s arms. IVE is less affected by streak artifacts and also delineates small vessels better. Detailed results from qualitatively ranking by two radiologists are shown in Figure 4. Each radiologist rated both test-retest exams of MIP images of 15 volunteers for both sessions resulting in a total of 60 ratings. IVE images were rated to be of the best overall image quality in 35 instances out of 60 (58%) followed by SSE (37%) and FS (5%). IVE exhibited the lowest streaking artifacts in 29 instances out of 60 (48%) followed by FS (28%) and SSE (23%). IVE also delineated the small vessels best in 23 cases out of 60 (38%) followed by SSE 21 (35%) and FS 16 (27%).
Figure 3.
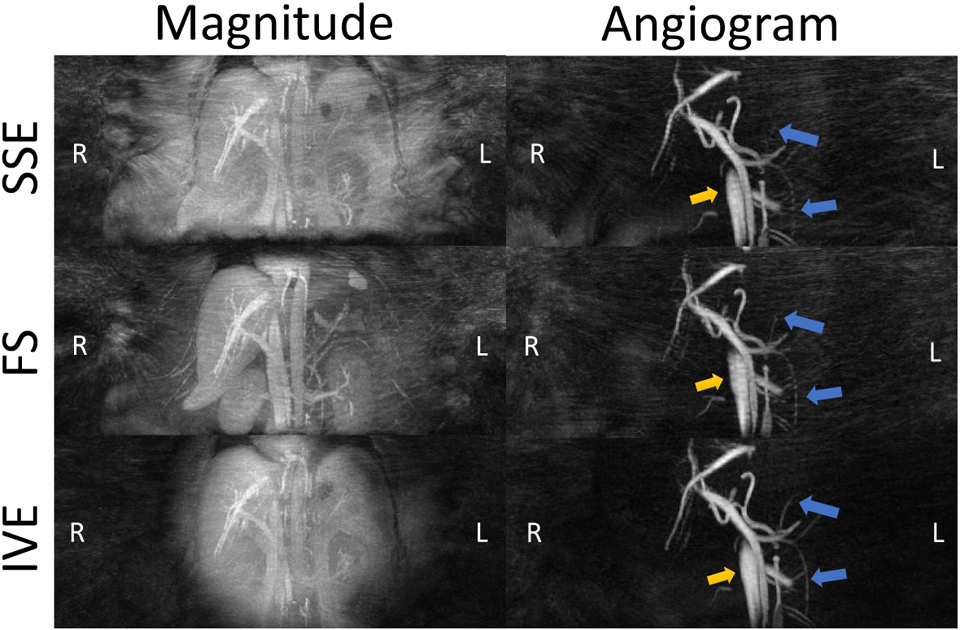
Maximum Intensity Projected (MIP) magnitude images and complex difference angiograms of a volunteer (mass =129kg and BMI = 42.7) acquired with Standard (SSED), Fat Saturation (FS) and Inner Volume Excitation (IVE). Background streaking artifacts are significantly less prevalent in IVE compared to the other sequences. In addition, IVE demonstrates minimal streaking artifacts in the vessel (yellow arrows) and delineates the smaller vessels clearly (blue arrows). Source images can be found in Supporting Figures S4.
Figure 4.
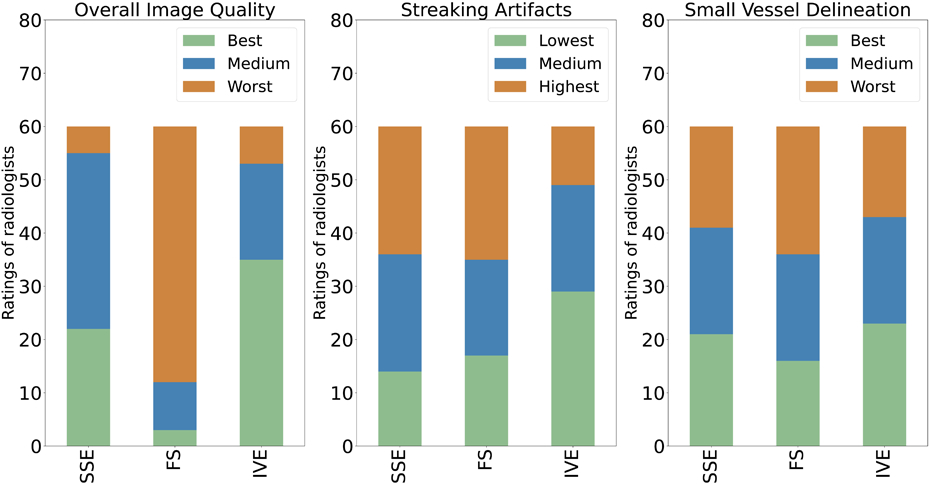
Ratings of radiologists based on Overall image quality (left), Streaking Artifacts (middle), Small Vessel Delineation (right). Rating criteria for overall image quality and small vessel delineation were best, medium, and worst. Streaking artifacts were rated as lowest, medium, and highest. SSE: Standard; FS: Fat Saturated; IVE: Inner Volume Excitation.
Mass Conservation
Flow analysis was successful for all subjects in a total of 90 4D flow MRI acquisitions across 15 obese subjects. Figure 5 and Figure 6 illustrate the internal consistency of the measured flows based on the conservation of mass for each sequence using regression and Bland Altman analysis in the confluence and the bifurcation, respectively. Figure 5 shows that the results from the regression analysis were best for IVE [slope = 0.98 (95% CI 0.88 to 1.08); intercept = 1.3 (95% CI −0.27 to 3.01)], followed by FS [slope = 0.89 (95% CI 0.68 to 1.1); intercept = 3.18 (95% CI −0.39 to 6.75)] and SSE [slope = 0.80 (95% CI 0.63 to 1.03); intercept =5.28 (95% CI 1.67 to 8.89)]. The Pearson correlation coefficient was highest for IVE (r=0.97), followed by FS (r=0.86) and SSE (r=0.81). The limits of agreement for SSE, FS, and IVE in the Bland Altman analysis were (−6.94, 2.40) mL/s, (−5.87, 3.25) mL/s, and (−3.20 to 1.07) mL/s with the estimated bias at −2.27 mL/s, −1.31 mL/s, and −1.07 mL/s, respectively. Figure 6 summarizes the conservation of mass analysis at the bifurcation with similar results to the confluence. The Pearson correlation coefficients for SSE [slope = 0.90 (95% CI 0.75 to 1.05); bias = 1.16 (95%CI 1.81 to 4.13)], FS [ slope = 0.89 (95%CI 0.78 to 0.99); bias = 1.40 (95% CI 1.04 to 3.84)], and IVE [slope = 0.94 (95%CI 0.85 to 1.03); bias = 1.09 (95%CI 0.58 to 2.76)] were 0.92-mL/s, 0.95 -mL/s, and 0.98-mL/s respectively. For SSE, FS, and IVE, the mean differences were −0.75 mL/s, −0.86 mL/s, and −0.04 mL/s while the corresponding limits of agreement ranged from (−3.85 to 2.36) mL/s, (−3.73 to 2.02) mL/s, and (−1.84 to 1.76) mL/s respectively.
Figure 5.
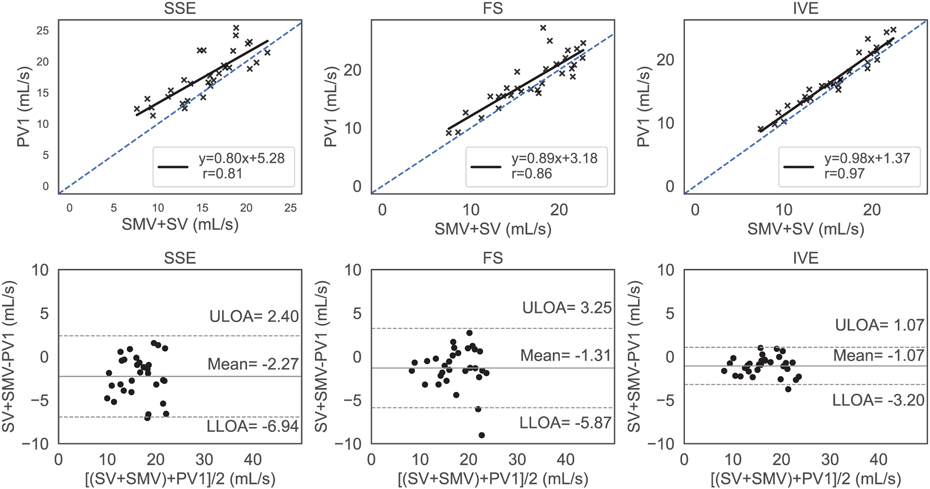
Conservation of mass at the confluence analyzed with regression analysis (top row) and Bland Altman plots (lower row) for standard (SSE), fat saturated (FS) and inner volume excitation (IVE) 4D flow sequences. The blue dashed line represents identity with the solid black line representing the linear fit. The top, bottom dashed horizontal black lines and the center horizontal solid black line represent the upper limits of agreement (ULOA) and lower limits of agreement (LLOA) and the mean line in the Bland Altman plots (bottom row). The IVE acquisition had the highest level of agreement between inbound and outbound flow with the lowest limits of agreement and the highest correlation.
Figure 6.
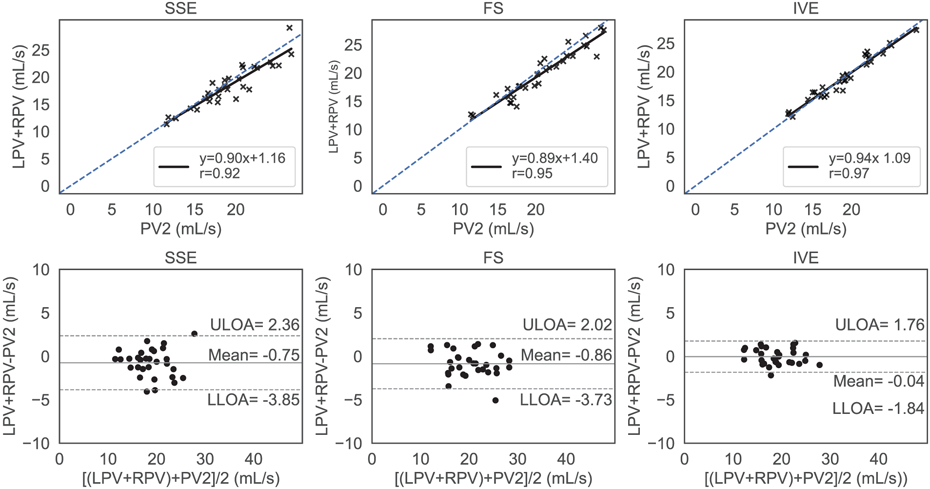
Conservation of mass at the bifurcation analyzed with regression analysis (top row) and Bland Altman plots (bottom row) for standard (SSE), fat saturated (FS) and inner volume excitation (IVE) 4D flow sequences, respectively. The blue dashed line represents identity with the solid black line representing the linear fit. The top, bottom dashed horizontal black lines and the center horizontal solid black line represent the upper limits of agreement (ULOA) and lower limits of agreement (LLOA) and the mean line in the Bland Altman plots (bottom row). IVE exhibited the highest level of agreement between inbound and outbound flow with lowest limits of agreements in the Bland Altman plots
Divergence Free Error
Figure 7 shows the comparison of the sequences using the divergence free quality metric. The estimated root mean squared velocity error for SSE, FS, and IVE were (4.05 ± 1.10) %, (4.29 ± 1.25) %, and (3.23 ± 0.73) % respectively. The error rate in IVE was significantly lower than both FS (p = 0.0002) and SSE (p = 0.0014), while no significant difference were observed between FS and SSE (p = 0.45). Vector flow plots prior to denoising and after denoising along with the error plots are illustrated in Figure 8. Except for some discontinuities in the edges, the divergent free flow filed of IVE closely resembled the original flow field. Consequently, the error vectors for IVE were more sparse and smaller in magnitude compared to the other methods.
Figure 7.
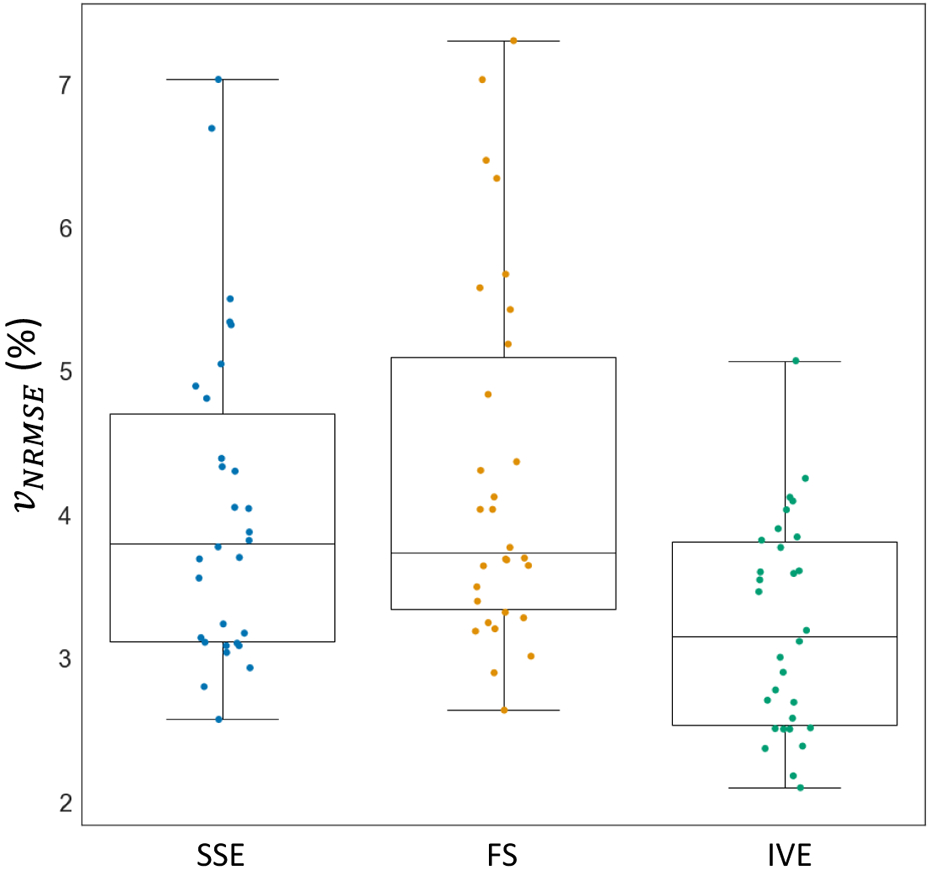
Divergence-free error metric analysis to compare the normalized root mean squared velocity error () among Standard (SSE), Fat Saturation (FS), and Inner Volume Excitation (IVE) acquisitions. IVE exhibited significantly lower error rates in both measures compared to SSE and FS, while SSE and FS showed no significant differences in the metrics.
Figure 8.
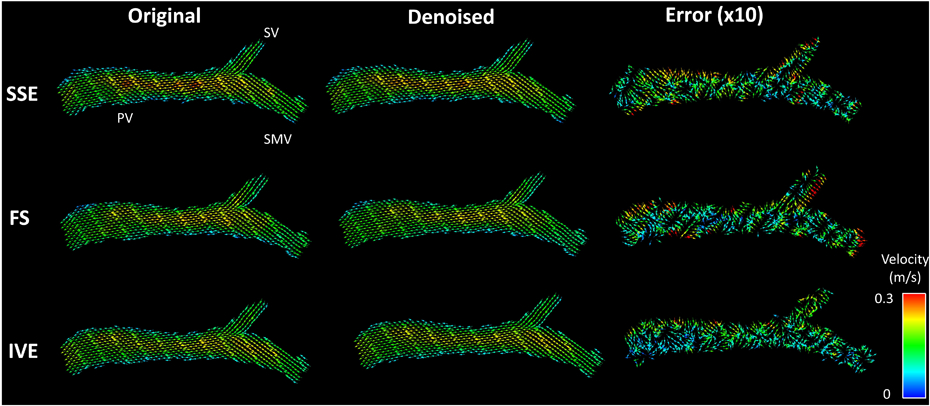
Visualization of divergent free denoising: Original, Denoised represents the vector flow fields before and after finite difference method (FDM) denoising. The error between the original and denoised flow field is magnified ten times before plotting. Inner Volume Excitation (IVE) acquisition demonstrates least errors with the sparsest error flow vector field followed by standard (SSE) and Fat Saturation (FS) acquisitions, respectively. SV, SMV and PV denote splenic vein, superior mesenteric vein and portal vein, respectively.
Test-retest Reproducibility
Figure 9 summarized the results of test-retest repeatability of each sequence. In the regression analysis, all sequences performed comparably with SSE [slope = 0.90 (95% CI 0.83 to 0.97); bias = 0.66 (95% CI −0.29 to 1.61)] showing Pearson correlation coefficient (r = 0.94), FS demonstrating [slope = 0.87 (95% CI 0.80 to 0.94); bias = 1.00 (95% CI −0.96 to 2.04); and r = 0.94], and IVE exhibiting [slope = 0.88 (95% CI 0.82 to 0.94); bias = 0.74 (95% CI −0.15 to 1.63 ); and r = 0.95]. The limits of agreement of the Bland Altman analysis for SSE, FS, IVE were (−3.7 to 4.8) mL/s, (−4.2 to 5.6) mL/s and (−3.4 to 4.9) mL/s with the mean differences centered at 0.5 mL/s, 0.6 mL/s and 0.74 mL/s respectively. The heart rates were similar for the sequences with some variabilities overtime. The heart rates observed for the SSE had (M = 72.09, SD = 13.86) for test and (M = 74.59, SD = 9.99) for retest. FS demonstrated heart rates of (M = 70.71, SD = 13.06) during test and (M = 72.34, SD = 13.48) during retest. On the other hand, the heart rates measured for the IVE- test and retest were (M = 70.67, SD = 12.20) and (M = 73.67, SD = 11.61) respectively.
Figure 9.
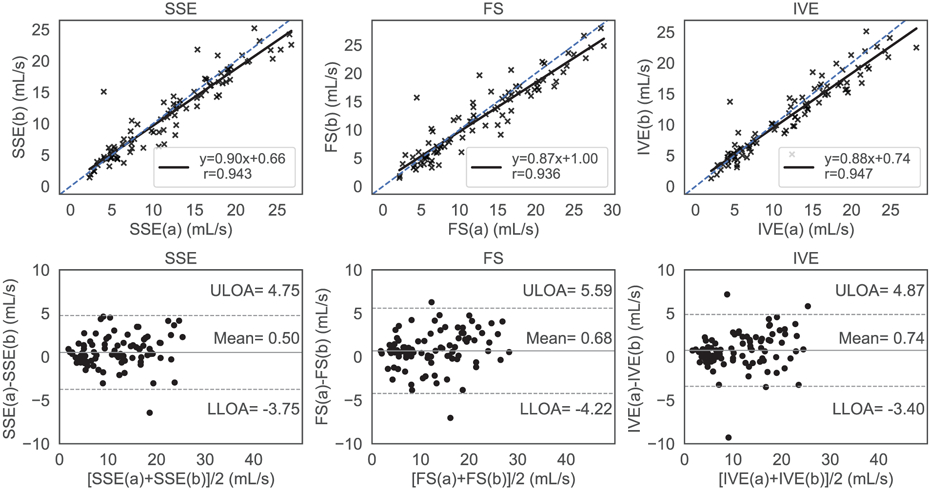
Test-retest repeatability analysis with regression analysis and Bland Altman plots for Standard (SSE), Fat Saturation (FS) and Inner Volume Excitation (IVE), respectively. The blue dashed line represents the ideal regression line with slope=1, bias=0, whereas the solid black line represents the sequence’s performance in the regression plots (top row). The top, bottom dashed horizontal black lines and the center horizontal solid black line represent the upper limits of agreement (ULOA) and lower limits of agreement (LLOA) and the mean line in the Bland Altman plots (bottom row). All methods exhibited a similar level of agreement between the first (a) and the second (b) acquisition with consistently lower velocity values in the second (b) acquisition.
Cross Sequence Comparison
The flow rates of the individual cut-planes between the sequences are compared in Figure 10 and was found to be in with good agreement between all sequences. Regression and Pearson correlation analysis resulted in [slope = 1.04 (95 % CI 1.00 to 1.08), bias = 0.27 (95 % CI-0.28 to 0.82) , r = 0.969] between [FS and SSE]; [slope = 0.97 (95% CI 0.94 to 1.03, bias = 0.37 (95 % CI −0.08 to 0.82), r = 0.975] between (IVE,SSE) and [slope = 0.90 (95 % CI 0.97 to 0.93), bias = 0.44 (95% CI 0.02 to 0.86), r = 0.978] between (IVE,FS). The limits of agreement amongst the pairs were (4.18, −2.60) mL/s, (2.79, −2.82) mL/s, and (2.10, - 3.71) mL/s with means centered at 0.79 mL/s, −0.01 mL/s, and −0.81 mL/s respectively.
Figure 10.
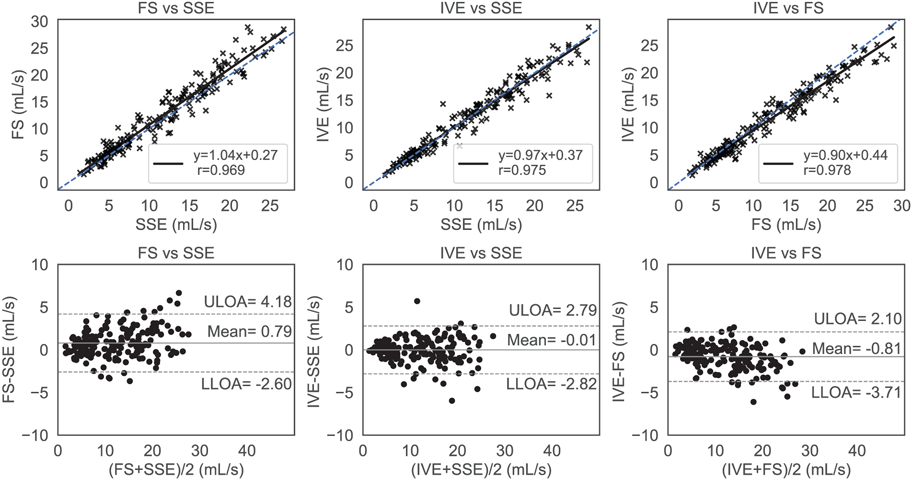
Regression and Bland Altman analysis for comparing the cross-sequence flow rates. The blue dashed line represents the ideal regression line with slope=1, bias=0, whereas the solid black line represents the sequence’s performance in the regression plots (top row). The top, bottom dashed horizontal black lines and the center horizontal solid black line represent the upper limits of agreement (ULOA) and lower limits of agreement (LLOA) and the mean line in the Bland Altman plots (bottom row). There was overall a high level of agreement among the acquisitions, with Fat Saturation (FS) trending to have slightly higher flow values.
DISCUSSION
This study conducted a test-retest comparison of fat mitigation techniques for portal venous flow measures in obese subjects and found improved measures with inner volume excitation (IVE) but not with spectral fat suppression (FS). For example, IVE demonstrated significantly lower flow discrepancies at the confluence and bifurcation. The improved flow field was supported by lower divergence error quality metrics with IVE. Quantitatively, FS performed similar to the SSE sequence in terms of the conservation of mass analysis and in divergence error quality metrics analysis. In the qualitative, blind subjective image quality ranking, IVE also outperformed other sequences in terms of the overall image quality, producing the least streaking artifacts, and the best delineation of small vessels. In terms of repeatability analysis, all the sequences fared excellently with no differences observed between the sequences, despite the high image quality in the IVE images.
The imaging of obese subjects will be a requirement for clinically deployed 4D flow imaging of the abdomen, and this study suggests that using IVE improves image quality for radial 4D flow MRI. In past work, the spatial shift of fat has been identified as a confounding factor for the quantification of flow.24 These past experiments suggested high receiver bandwidth readout and in-phase echo times improve quantification; however, these experiments did not address the challenges in collecting high quality images with accelerated (highly undersampled) 4D flow. Adjusting the imaging protocol to image obese subjects requires higher undersampling or longer scan times due to larger imaging volumes and sensitivity to fat artifacts. The IVE method addressed the challenges of imaging obese patients by reducing the FOV to the central region. This excluded the signal from the arms of the patient which are near the edge of the bore, where gradient non-linearity, concomitant fields, and B0 heterogeneity are the highest. In the case of radial imaging, these challenges are known to cause streaking artifacts which have been addressed using tailored RF excitation36 and coil combination strategies.50 This resulted in improved image quality for radial imaging, although the improvements were not shown for more common Cartesian 4D flow protocols or other non-cartesian trajectories. The combination of IVE and Cartesian imaging would provide three dimensions of frequency based selectivity (2 RF, 1 frequency encoding) which may further reduce artifacts.
Streak artifacts from the arms could alternatively be avoided by positioning patients with one or both arms above their head; however, this is not well tolerated by all patients and can be logistically challenging for obese subjects.
The fat saturation method employed in this study did not significantly improve the image quality or metrics derived from the data. This is despite the overall improved image quality observed in the magnitude images. Fat saturation is sensitive to B0 field heterogeneities and with obese patients there is residual fat signal in the peripheral regions. Thus, FS 4D flow remains sensitive to potential aliasing, motion and other artifacts from the patient's arms and unsuppressed fat. The FS 4D flow in this study was also applied intermittently every 15 TRs to limit RF energy deposition and scan time increases. It is possible the intermittent nature suppression led to subtle phase artifacts that were not detectable in phantoms or magnitude images. Repeating the RF fat suppression pulse more frequently may address this concern but is severally limited due to the scan time increases and RF energy deposition. Past works using chemical shift encoded imaging with 4D flow MRI have demonstrated improved image quality for the same 3D radial imaging.23 Chemical shift encoding allows for B0 heterogeneity to be modeled during reconstruction and can also consider the multiple peaks of fat.51 This leads to exceptional fat suppression and from both the visceral and subcutaneous fat. However, the method23 comes at the cost of increased acquisition time from the required encodings for echo time (6 vs 4), extends the TR, and increases the complexity of estimating velocity. IVE requires a minimal increase in scan time but also has some level of sensitivity to errors from delays between the gradient and RF waveforms, off-resonance, and the reduced selectivity in the S/I direction. In simulation (Supporting Figure S4), we found the designed 2D RF pulse to be insensitive to off-resonance but other factors remain under investigated. Further work is needed to compare 4D flow with fat saturation to chemical shift encoded variants.
In this study, the reproducibility of the measures was high but independent of the acquisition, despite differences in image quality and quantitative metrics. Test-retest flow measurements in this study were performed in the same session with participants removed from the bore. The participants also fasted before the exam to reduce the physiologic variation from flow due to postprandial hyperemia. The flow rates for the retest were found to be trend lower than the test across all sequences; however, we did observe variability in the HR and flow trends across subjects. This may potentially indicate a physiological source of this flow variation, potentially due to the prolonged effect of fasting, lying supine, and/or effects from contrast agent kinetics. There may also be psychological effects from training effects due to familiarization with the MRI procedure. More work is needed to separate technical and physiological differences in the flow measures; however, this can be challenging as the variations co-occur.
The individual flow rates measured by each of the sequences were also in close agreement to each other in the pair wise testing with high correlation coefficients (r≥0.969) and narrow limits of agreements. However, slight differences could have compounded leading to detectable difference amongst the sequence in the abovementioned analyses. The comparison of SSE with IVE had the narrowest limits of agreement indicating that the SSE sequence can be replaced by IVE. Measuring low flow rates in individual cut planes due to manual free form contour positioning may have also led to inaccuracies in flow assessment and the consequent analysis mentioned above.
In previous studies,8,9,45 the bias in the conservation of mass analysis was lower overall. This is likely attributable to lower image quality caused by the high fat signals and overall lower SNR performance of this obese cohort. None of the approaches investigated addresses the B1 heterogeneity and lower SNR from coil proximity experienced in obese subjects.
This study is limited by the inclusion of a small cohort of obese volunteers only, imaging only after a contrast agent, and focus only on portal venous imaging. Contrast agents increase the SNR in vessels for 4D flow MRI and the feasibility of imaging the hepatic vasculature in obese patients without contrast requires further investigation. In our clinical practice, gadolinium-based contrast is commonly used for abdominal imaging applications where 4D flow may also be of interest. We therefore utilized Ferumoxytol to simulate gadolinium-based enhancement without the confounding effects of washout. Future studies are needed in patients with a variety of liver pathologies and in cases without contrast to elicit the clinical value of IVE in providing vital hemodynamic differentiating parameters. Studies are also needed to evaluate these techniques for the evaluation of the arterial system which was limited in this study by the low VENC, optimized for portal venous flow imaging. Future studies are needed in patients with a variety of liver pathologies to elicit the clinical value of IVE in providing vital hemodynamic differentiating parameters. Studies are also needed to evaluate these techniques for the evaluation of the arterial system which was limited in this study by the low VENC, optimized for portal venous flow imaging.
CONCLUSION
In this study, spectral fat suppression and inner volume excitation based on selective excitation were investigated to address the technical challenges of imaging obese subjects with radial 4D flow MRI. The proposed inner volume excitation provided superior hemodynamic assessment of the portal vein in both quantitative and qualitative evaluations, compared with two other strategies. This study forms the basis for future clinical deployment of radial 4D flow MRI to image obese patients with improved image quality and more reliable flow quantification.
Supplementary Material
ACKNOWLEDGEMENTS
The authors wish to acknowledge the NIH (R01 DK125783) for supporting this study, as well as GE Healthcare which provides research support to the University of Wisconsin. Dr. Oechtering receives funding from the German Research Foundation (OE 746/1-1). Dr. Reeder is a Romnes Faculty Fellow and has received an award provided by the University of Wisconsin-Madison Office of the Vice Chancellor for Research and Graduate Education with funding from the Wisconsin Alumni Research Foundation.
REFERENCES
- 1.Ioannou GN, Weiss NS, Kowdley KV, Dominitz JA. Is obesity a risk factor for cirrhosis-related death or hospitalization? a population-based cohort study. Gastroenterology. 2003;125(4):1053–1059. doi: 10.1016/S0016-5085(03)01200-9 [DOI] [PubMed] [Google Scholar]
- 2.Schiavo L, Busetto L, Cesaretti M, Zelber-Sagi S, Deutsch L, Iannelli A. Nutritional issues in patients with obesity and cirrhosis. World J Gastroenterol. 2018;24(30):3330–3346. doi: 10.3748/wjg.v24.i30.3330 [DOI] [PMC free article] [PubMed] [Google Scholar]
- 3.Tsochatzis EA, Bosch J, Burroughs AK. Liver cirrhosis. The Lancet. 2014;383(9930):1749–1761. doi: 10.1016/S0140-6736(14)60121-5 [DOI] [PubMed] [Google Scholar]
- 4.Oechtering T, Roberts G, Panagiotopoulos N, Wieben O, Reeder S, Roldán-Alzate A. Clinical Applications of 4D Flow MRI in the Portal Venous System. Magnetic Resonance in Medical Sciences. 2022;21. doi: 10.2463/mrms.rev.2021-0105 [DOI] [PMC free article] [PubMed] [Google Scholar]
- 5.Bannas P, Roldán-Alzate A, Johnson KM, et al. Longitudinal Monitoring of Hepatic Blood Flow before and after TIPS by Using 4D-Flow MR Imaging. Radiology. 2016;281(2):574–582. doi: 10.1148/radiol.2016152247 [DOI] [PMC free article] [PubMed] [Google Scholar]
- 6.Stankovic Z, Frydrychowicz A, Csatari Z, et al. MR-based visualization and quantification of three-dimensional flow characteristics in the portal venous system. J Magn Reson Imaging. 2010;32(2):466–475. doi: 10.1002/jmri.22248 [DOI] [PubMed] [Google Scholar]
- 7.Frydrychowicz A, Landgraf BR, Niespodzany E, et al. Four-dimensional velocity mapping of the hepatic and splanchnic vasculature with radial sampling at 3 tesla: a feasibility study in portal hypertension. J Magn Reson Imaging. 2011;34(3):577–584. doi: 10.1002/jmri.22712 [DOI] [PMC free article] [PubMed] [Google Scholar]
- 8.Roldán-Alzate A, Frydrychowicz A, Niespodzany E, et al. In vivo validation of 4D flow MRI for assessing the hemodynamics of portal hypertension. Journal of Magnetic Resonance Imaging. 2013;37(5):1100–1108. doi: 10.1002/jmri.23906 [DOI] [PMC free article] [PubMed] [Google Scholar]
- 9.Roldán-Alzate A, Frydrychowicz A, Said A, et al. Impaired regulation of portal venous flow in response to a meal challenge as quantified by 4D flow MRI. Journal of Magnetic Resonance Imaging. 2015;42(4):1009–1017. doi: 10.1002/jmri.24886 [DOI] [PMC free article] [PubMed] [Google Scholar]
- 10.Brunsing RL, Brown D, Almahoud H, et al. Quantification of the Hemodynamic Changes of Cirrhosis with Free-Breathing Self-Navigated MRI. Journal of Magnetic Resonance Imaging. 2021;53(5):1410–1421. doi: 10.1002/jmri.27488 [DOI] [PMC free article] [PubMed] [Google Scholar]
- 11.Stankovic Z Four-dimensional flow magnetic resonance imaging in cirrhosis. World J Gastroenterol. 2016;22(1):89–102. doi: 10.3748/wjg.v22.i1.89 [DOI] [PMC free article] [PubMed] [Google Scholar]
- 12.Haarbye SO, Nielsen MB, Hansen AE, Lauridsen CA. Four-Dimensional Flow MRI of Abdominal Veins: A Systematic Review. Diagnostics (Basel). 2021;11(5):767. doi: 10.3390/diagnostics11050767 [DOI] [PMC free article] [PubMed] [Google Scholar]
- 13.Hyodo R, Takehara Y, Naganawa S. 4D Flow MRI in the portal venous system: imaging and analysis methods, and clinical applications. Radiol Med. Published online September 19, 2022. doi: 10.1007/s11547-022-01553-x [DOI] [PMC free article] [PubMed] [Google Scholar]
- 14.Roldán-Alzate A, Francois CJ, Wieben O, Reeder SB. Emerging Applications of Abdominal 4D Flow MRI. AJR Am J Roentgenol. 2016;207(1):58–66. doi: 10.2214/AJR.15.15995 [DOI] [PMC free article] [PubMed] [Google Scholar]
- 15.Oechtering TH, Roberts GS, Panagiotopoulos N, Wieben O, Roldán-Alzate A, Reeder SB. Abdominal applications of quantitative 4D flow MRI. Abdom Radiol. Published online November 27, 2021. doi: 10.1007/s00261-021-03352-w [DOI] [PMC free article] [PubMed] [Google Scholar]
- 16.Hall Barrientos P, Knight K, Black D, Vesey A, Roditi G. A pilot study investigating the use of 4D flow MRI for the assessment of splanchnic flow in patients suspected of mesenteric ischaemia. Sci Rep. 2021;11(1):5914. doi: 10.1038/s41598-021-85315-1 [DOI] [PMC free article] [PubMed] [Google Scholar]
- 17.Roberts GS, François CJ, Starekova J, Roldán-Alzate A, Wieben O. Non-invasive assessment of mesenteric hemodynamics in patients with suspected chronic mesenteric ischemia using 4D flow MRI. Abdom Radiol. 2022;47(5):1684–1698. doi: 10.1007/s00261-020-02900-0 [DOI] [PubMed] [Google Scholar]
- 18.Bane O, Said D, Weiss A, et al. 4D flow MRI for the assessment of renal transplant dysfunction: initial results. Eur Radiol. 2021;31(2):909–919. doi: 10.1007/s00330-020-07208-7 [DOI] [PubMed] [Google Scholar]
- 19.European obesity and the radiology department. What can we do to help? ∣ SpringerLink. Accessed July 7, 2022. https://link.springer.com/article/10.1007/s00330-008-1154-z [Google Scholar]
- 20.Uppot RN, Sahani DV, Hahn PF, Gervais D, Mueller PR. Impact of Obesity on Medical Imaging and Image-Guided Intervention. American Journal of Roentgenology. 2007;188(2):433–440. doi: 10.2214/AJR.06.0409 [DOI] [PubMed] [Google Scholar]
- 21.Collins CM, Wang Z. Calculation of radiofrequency electromagnetic fields and their effects in MRI of human subjects. Magnetic Resonance in Medicine. 2011;65(5):1470–1482. doi: 10.1002/mrm.22845 [DOI] [PMC free article] [PubMed] [Google Scholar]
- 22.Homann H, Börnert P, Eggers H, Nehrke K, Dössel O, Graesslin I. Toward individualized SAR models and in vivo validation. Magnetic Resonance in Medicine. 2011;66(6):1767–1776. doi: 10.1002/mrm.22948 [DOI] [PubMed] [Google Scholar]
- 23.Johnson KM, Wieben O, Samsonov AA. Phase-contrast velocimetry with simultaneous fat/water separation. Magnetic Resonance in Medicine. 2010;63(6):1564–1574. doi: 10.1002/mrm.22355 [DOI] [PMC free article] [PubMed] [Google Scholar]
- 24.Middione MJ, Ennis DB. Chemical shift-induced phase errors in phase-contrast MRI. Magnetic Resonance in Medicine. 2013;69(2):391–401. doi: 10.1002/mrm.24262 [DOI] [PMC free article] [PubMed] [Google Scholar]
- 25.Shreyas S, Vasanawala MTA. Reduction of Respiration Artifacts in 3D Phase Contrast Imaging with Intermittent Fat Saturation. In: Proc. Intl. Soc. Mag. Reson. Med 20 (2012). ISMRM. https://cds.ismrm.org/protected/12MProceedings/PDFfiles/1195.pdf [Google Scholar]
- 26.Dyvorne H, Knight-Greenfield A, Jajamovich G, et al. Abdominal 4D Flow MR Imaging in a Breath Hold: Combination of Spiral Sampling and Dynamic Compressed Sensing for Highly Accelerated Acquisition. Radiology. 2015;275(1):245–254. doi: 10.1148/radiol.14140973 [DOI] [PMC free article] [PubMed] [Google Scholar]
- 27.Hauger O, Dumont E, Chateil JF, Moinard M, Diard F. Water excitation as an alternative to fat saturation in MR imaging: preliminary results in musculoskeletal imaging. Radiology. 2002;224(3):657–663. doi: 10.1148/radiol.2243011227 [DOI] [PubMed] [Google Scholar]
- 28.Gizewski ER, Ladd ME, Paul A, Wanke I, Göricke S, Forsting M. Water excitation: a possible pitfall in cerebral time-of-flight angiography. AJNR Am J Neuroradiol. 2005;26(1):152–155. [PMC free article] [PubMed] [Google Scholar]
- 29.Feinberg DA, Hoenninger JC, Crooks LE, Kaufman L, Watts JC, Arakawa M. Inner volume MR imaging: technical concepts and their application. Radiology. Published online September 1, 1985. doi: 10.1148/radiology.156.3.4023236 [DOI] [PubMed] [Google Scholar]
- 30.Wargo CJ, Moore J, Gore JC. A Comparison and Evaluation of Reduced-FOV Methods for Multi-Slice 7 Tesla Human Imaging. Magn Reson Imaging. 2013;31(8):1349–1359. doi: 10.1016/j.mri.2013.05.003 [DOI] [PMC free article] [PubMed] [Google Scholar]
- 31.Wink C, Ferrazzi G, Bassenge JP, et al. 4D flow imaging with 2D-selective excitation. Magnetic Resonance in Medicine. 2019;82(3):886–900. doi: 10.1002/mrm.27769 [DOI] [PubMed] [Google Scholar]
- 32.Roldán-Alzate A, Campo CA, Mao L, Said A, Wieben O, Reeder SB. Characterization of mesenteric and portal hemodynamics using 4D flow MRI: the effects of meals and diurnal variation. Abdom Radiol (NY). 2022;47(6):2106–2114. doi: 10.1007/s00261-022-03513-5 [DOI] [PMC free article] [PubMed] [Google Scholar]
- 33.Bashir MR, Bhatti L, Marin D, Nelson RC. Emerging applications for ferumoxytol as a contrast agent in MRI. J Magn Reson Imaging. 2015;41(4):884–898. doi: 10.1002/jmri.24691 [DOI] [PubMed] [Google Scholar]
- 34.Vasanawala SS, Nguyen KL, Hope MD, et al. Safety and Technique of Ferumoxytol Administration for MRI. Magn Reson Med. 2016;75(5):2107–2111. doi: 10.1002/mrm.26151 [DOI] [PMC free article] [PubMed] [Google Scholar]
- 35.Johnson KM, Markl M. Improved SNR in Phase Contrast Velocimetry with 5-Point Balanced Flow Encoding. Magn Reson Med. 2010;63(2):349–355. doi: 10.1002/mrm.22202 [DOI] [PMC free article] [PubMed] [Google Scholar]
- 36.Johnson KM, Fain SB, Schiebler ML, Nagle S. Optimized 3D Ultrashort Echo Time Pulmonary MRI. Magn Reson Med. 2013;70(5):1241–1250. doi: 10.1002/mrm.24570 [DOI] [PMC free article] [PubMed] [Google Scholar]
- 37.Pauly J, Nishimura D, Macovski A. A k-space analysis of small-tip-angle excitation. Journal of Magnetic Resonance (1969). 1989;81(1):43–56. doi: 10.1016/0022-2364(89)90265-5 [DOI] [PubMed] [Google Scholar]
- 38.Hardy CJ, Pearlman JD, Moore JR, Roemer PB, Cline HE. Rapid NMR cardiography with a half-echo M-mode method. J Comput Assist Tomogr. 1991;15(5):868–874. doi: 10.1097/00004728-199109000-00032 [DOI] [PubMed] [Google Scholar]
- 39.Butts K, Hangiandreou NJ, Riederer SJ. Phase velocity mapping with a real time line scan technique. Magn Reson Med. 1993;29(1):134–138. doi: 10.1002/mrm.1910290125 [DOI] [PubMed] [Google Scholar]
- 40.Hardy CJ, Darrow RD, Nieters EJ, et al. Real-time acquisition, display, and interactive graphic control of NMR cardiac profiles and images. Magn Reson Med. 1993;29(5):667–673. doi: 10.1002/mrm.1910290514 [DOI] [PubMed] [Google Scholar]
- 41.Cline HE, Hardy CJ, Pearlman JD. Fast MR cardiac profiling with two-dimensional selective pulses. Magn Reson Med. 1991;17(2):390–401. doi: 10.1002/mrm.1910170211 [DOI] [PubMed] [Google Scholar]
- 42.Ong F, Martin J, Grissom W, et al. mikgroup/sigpy: Minor release to trigger Zenodo for DOI. Published online January 23, 2022. doi: 10.5281/zenodo.5893788 [DOI] [Google Scholar]
- 43.Lustig M, Kim SJ, Pauly JM. A Fast Method for Designing Time-Optimal Gradient Waveforms for Arbitrary k-Space Trajectories. IEEE Trans Med Imaging. 2008;27(6):866–873. doi: 10.1109/TMI.2008.922699 [DOI] [PMC free article] [PubMed] [Google Scholar]
- 44.Johnson KM, Lum DP, Turski PA, Block WF, Mistretta CA, Wieben O. Improved 3D phase contrast MRI with off-resonance corrected dual echo VIPR. Magn Reson Med. 2008;60(6):1329–1336. doi: 10.1002/mrm.21763 [DOI] [PMC free article] [PubMed] [Google Scholar]
- 45.Landgraf BR, Johnson KM, Roldán-Alzate A, Francois CJ, Wieben O, Reeder SB. Effect of Temporal Resolution on 4D Flow MRI in the Portal Circulation. J Magn Reson Imaging. 2014;39(4):819–826. doi: 10.1002/jmri.24233 [DOI] [PMC free article] [PubMed] [Google Scholar]
- 46.Bernstein MA, Zhou XJ, Polzin JA, et al. Concomitant gradient terms in phase contrast MR: analysis and correction. Magn Reson Med. 1998;39(2):300–308. doi: 10.1002/mrm.1910390218 [DOI] [PubMed] [Google Scholar]
- 47.Loecher M, Kecskemeti S, Johnson KM, Turski P, Wieben O. Evaluation of divergence-free correction algorithms in high resolution 4-D flow images of cranial vasculature. :1. [Google Scholar]
- 48.Ong F, Uecker M, Tariq U, et al. Robust 4D Flow Denoising Using Divergence-Free Wavelet Transform. Magn Reson Med. 2015;73(2):828–842. doi: 10.1002/mrm.25176 [DOI] [PMC free article] [PubMed] [Google Scholar]
- 49.Song SM, Napel S, Glover GH, Pelc NJ. Noise reduction in three-dimensional phase-contrast MR velocity measurementsl. Journal of Magnetic Resonance Imaging. 1993;3(4):587–596. doi: 10.1002/jmri.1880030407 [DOI] [PubMed] [Google Scholar]
- 50.Cancellation of streak artifacts in radial abdominal imaging using interference null space projection - Fu - 2022 - Magnetic Resonance in Medicine - Wiley Online Library. Accessed August 16, 2022. https://onlinelibrary.wiley.com/doi/10.1002/mrm.29285 [DOI] [PMC free article] [PubMed]
- 51.Yu H, Shimakawa A, McKenzie CA, Brodsky E, Brittain JH, Reeder SB. Multiecho water-fat separation and simultaneous R2* estimation with multifrequency fat spectrum modeling. Magn Reson Med. 2008;60(5):1122–1134. doi: 10.1002/mrm.21737 [DOI] [PMC free article] [PubMed] [Google Scholar]
Associated Data
This section collects any data citations, data availability statements, or supplementary materials included in this article.