

Abstract
Butterfly pea (Clitoria ternatea) flowers are widely used for culinary purposes in southern Asian countries. We assessed the optimal level of a butterfly pea petal extract (BPPE) to produce blue rice. Dried butterfly pea petals were extracted with water at 0.2, 0.4, 0.6, and 0.8% (w/v), and the extract was used to color boiled rice before cooking was completed. Rice cooked with BPPE acquired various shades of blue from light to dark. Significantly decreased lightness/darkness (L*), redness/greenness (a*), yellowness/blueness (b*), and color difference (∆E*) were observed in response to BPPE levels, while hue (h*) and chroma (C*) were significantly increased (p < 0.05). Total phenolic (TPC) and total anthocyanin (TAC) contents of cooked rice increased with BPPE levels (p < 0.05), and both constituents contributed significant radical scavenging activity (r = 0.886 to 0.994, p < 0.01, n = 20). Sensory evaluation by consumers indicated a suitable level of BPPE at 0.6%. The color of blue cooked rice was stable under an opaque cover for 8 days, whereas TPC and TAC decreased significantly with storage time. Findings from the current study can be used to produce blue rice in traditional cooking, and to produce other ready-to-use BPPE products.
Supplementary Information
The online version contains supplementary material available at 10.1007/s13197-023-05752-w.
Keywords: Anthocyanin, Antioxidant, Asian pigeonwings, Blue rice, C. ternatea, Phenolics
Introduction
Rice (Oryza sativa) provides a staple food source for almost half of the world’s population. It is primarily consumed in Southeast Asia, India, China, Japan, and Korea (Silva et al. 2017). Rice is a nutritious source of carbohydrates that meets recommended nutrient and energy requirements (Devi et al. 2015). Generally, rice is consumed without the bran, husk, and germ (Abdel-Aal et al. 2006). Rice prepared this way, as white rice, has little fiber and is not considered suitable for diabetics, causing increased blood glucose levels which lead to type 2 diabetes (Silva et al. 2017).
Herbs, fruits and flowers are sources of useful phytochemicals and bioactive compounds. Some studies have shown that the addition of certain plants to carbohydrate-rich food resulted in greater antioxidant capacity. Bhuyan and Sonowal (2021) reported that the phenolic and flavonoid contents of cooked rice, baked foods and sweets were higher if pandan leaf (Pandanus amaryllifolius) was included in the preparation. The benefits included anti-hyperglycemic, anti-viral, anti-oxidant and anti-cancer activities. Another recent work showed that soaking germinated Korean brown rice in curcuminoids-rich turmeric extract improved anti-oxidant, anti-inflammatory, anti-tumor, anti-viral, anti-cancer, and anti-mutagenic properties (Kim et al. 2021). In addition, adding oats (Avena sativa) and cinnamon to cookies not only gave the products a unique taste and smell but also improved anti-microbial and anti-oxidant activity, and recovered liver and kidney tissues damaged by carbon tetrachloride exposure (Aly et al. 2021).
The butterfly pea (Clitoria ternatea) is an edible herbal plant belonging to the family Fabaceae. It is found throughout the tropical zones of Asia, Australia, Central and South America, and Africa. The flowers of the butterfly pea, especially the petals, are a vivid deep blue color. They contain high amounts of anthocyanin, a phenolic compound containing flavonoid groups (Jeyaraj et al. 2021). This compound is water-soluble and can produce blue, purple, red, and orange colors. The flowers have various biological activities, including anti-diabetic, anti-pyretic, anti-helminthic, anti-leprosy, anti-asthmatic, anti-hyperlipidemic, anti-fungal, anti-depressant, anti-convulsant, and analgesic activities (Gupta et al. 2010; Hungerford et al. 2019).
In Southeast Asia, the flower of the butterfly pea is considered a natural food coloring generally used in cooked rice, desserts, and drinks. Since the color of food is an important influence on appetite and appeal to consumers, the use of butterfly pea flowers in food production is a viable choice. The addition of 3% butterfly pea flower was the most acceptable level for gummy candy products (Loñez and Banwa 2021). Blue rice produced with 1.25% of butterfly pea flower extract was considered generally acceptable, but with a proportion of the extract over 2.5%, the evaluation results were less favorable than the results for traditional white rice (Chusak et al. 2019). From observations of previous works, the suitable proportion of butterfly pea flowers depended on the preparation protocol and the color of the raw food materials, and the type of extraction solvent and extraction method directly affected the amount of active ingredients in the final product (Jeyaraj et al. 2021).
Since anthocyanin contributes various biological activities and health benefits, the replacement of artificial colorings with butterfly pea flowers in food manufacturing processes is a beneficial alternative approach. In the present study, we investigated the suitable proportion of butterfly pea petals to use in traditional rice cooking. Findings from the current study can be used to produce blue rice for domestic use.
Materials and methods
Preparation of dried butterfly pea petals
Fresh butterfly pea flowers were purchased from farms in Songkhla Province in Thailand. The flowers were washed twice with distilled water, and the petals were removed and dried at 50 °C for 24 h. Subsequently, the dried petals were ground into a fine powder which was sieved. The dried, sieved powder was packed in polyethylene bags, sealed, covered with opaque plastic and kept at 4 °C in darkness until used. The chemical composition of the dried butterfly pea petals is shown in Table S1.
Crude extract preparation and rice cooking
Dried butterfly pea petal powder samples weighing 0.26, 0.52, 0.78 and 1.04 g were mixed with distilled water (1: 28 w/v) for 10 min, stirred at 500 rpm for 20 min, filtered through Whatman No. 1 paper, and the filtrates were adjusted with distilled water to obtain final volumes of 30 mL. The various weights of dried petal powder produced extracts with final concentrations of 0.2, 0.4, 0.6%, and 0.8%, respectively. The obtained butterfly pea petal extracts (BPPE) were kept at room temperature until used in the cooking of rice. One hundred grams of Jasmine white rice (Royal Umbrella; C.P. Intertrade Co. Ltd., & Khao C.P. Co. Ltd., Bangkok, Thailand) were washed twice with clean water, drained, and then placed in an electric rice cooker (KSH-Q03; Sharp Corp., Osaka, Japan) with 100 mL of water. The rice was cooked at 230 W for 15 min. After 10 min, 30 mL of BPPE were added to the rice to give a final rice to water ratio of 1:3 w/v. The BPPE was mixed thoroughly into the rice and cooking then continued for 5 min. The control treatment was rice cooked without the addition of BPPE (0%) whereas the BPPE volume was replaced by 30 mL of water to obtain a net volume of 130 mL. The cooked rice was left to cool to room temperature before chemical analysis. Quadruplicate cooking (n = 4) was conducted at each BPPE concentration.
Color measurements
Samples of cooked rice were analyzed with a spectrophotometer (Miniscan EZ; Hunter Associates Laboratory, Reston VA, USA) which measured color parameters. The parameters measured included lightness/darkness (L*), redness/greenness (a*), yellowness/blueness (b*), chroma (C*), and hue (h*). The color difference (∆E*) was calculated from equation [(L*)2 + (a*)2 + (b*)2]1/2.
pH determination
The cooked rice samples were ground to a fine powder and the pH was measured using a pH meter (F20 Five Easy; Mettler Toledo, Ohio, USA) according to the method described by Sokhey and Chinnaswamy (1993).
Determination of total anthocyanin and total phenolic contents
Extraction of cooked rice
The extraction was performed as described in Mardiah et al. (2017). Briefly, using a micro-homogenizer (THP-220; Omni International, Kennesaw, GA, USA), 5 g of cooked rice were homogenized in 10 mL of methanol and then placed in an ultrasonic bath (Elmasonic EASY 60 H; Elma Schmidbauer GmbH, Singen, Germany) for 30 min. The sonicated homogenized mixture was centrifuged at 10,000 rpm at 15 °C for 30 min. The supernatant was collected and kept at – 20 °C for determination of total phenolics content (TPC) and total anthocyanin content (TAC).
TPC analysis
The TPC of the cooked rice was determined based on the method of Mardiah et al. (2017) with slight modifications. Briefly, 600 µL of rice extract were mixed with 2 mL of distilled water and 200 µL of 0.25 N Folin-Ciocalteu reagent. The samples were allowed to stand for 3 min, and then 1 mL of 7.5% Na2CO3 was added. The mixture was incubated in darkness at room temperature for 2 h. The obtained solution was measured spectrophotometrically (GenesysTM 10S; Thermo Fisher Scientific, Massachusetts, USA) at 765 nm against the linear range of gallic acid standard. TPC concentrations were expressed as gallic acid equivalents (GAE) per 100 g of dry weight.
TAC analysis
The TAC of the cooked rice was determined by the pH differential method described by Mardiah et al. (2017), with some modifications. In a tube, 8 mL of rice extract were mixed with 2 mL of 0.025 M KCl buffer (pH 1.0) and in another tube, 8 mL of crude extract were mixed with 2 mL of 0.4 M C2H3NaO2 buffer (pH 4.5). The mixtures were measured spectrophotometrically (Genesys™ 10S; Thermo Fisher Scientific, Massachusetts, USA) at 510 and 700 nm, respectively. The results were expressed as mg of cyanidin-3-glucoside equivalents (CGE) per 100 g of dry weight. TAC concentration was calculated using the formula (A × MW × DF × 1000)/ε × 1, where A = (A510 nm–A700 nm)pH 1.0–(A510 nm–A700 nm)pH 4.5, MW is the molecular weight of CGE (449.2 g/mol), DF is the dilution factor, is the molar extinction of CGE (26,900 L/mol/cm), and l is the cuvette width (cm).
Determination of radical scavenging activity
Extraction of cooked rice
The extraction procedure was based on the method of Sutharut and Sudarat (2012). Using a micro-homogenizer (THP-220; Omni International, Kennesaw, GA, USA), 2 g of cooked rice were homogenized in 6 mL of methanol and the obtained homogenate was incubated for 20 min in a water bath (SW23; Julabo GmbH, Allentown, USA) at 60 °C. Afterwards, the mixture was centrifuged at 10,000 rpm at 15 °C for 10 min. The supernatant was collected and kept at − 20 °C until used in 1, 1-diphenyl-2-picrylhydrazyl (DPPH) and 2,2-azino-bis-(3-ethylbenzothiazoline-6-sulfonic acid) (ABTS) radical scavenging assays.
DPPH radical scavenging activity
DPPH radical scavenging activity was determined according to the method of Leong and Shui (2002), in which 700 µL of sample extract were mixed with 1.3 mL of 0.1 mM DPPH. The mixture was incubated in darkness at room temperature for 30 min, and absorbance was measured at 517 nm. The radical scavenging activity (% inhibition) was calculated using the formula [(Ac − As)/Ac] × 100, where Ac is the absorbance of the control sample (extraction buffer in equal volume replacing the actual sample), and As is the absorbance of the extract sample.
ABTS radical scavenging activity
ABTS radical scavenging activity was assayed based on the method of Re et al. (1999) with some modifications. First, stock solutions of 7 mM ABTS+ and 2.4 mM K2SO4 were prepared. The stock solutions were mixed at 1:1 (v/v) and then incubated in darkness for 16 h at room temperature to obtain a working solution. Initially, 5 mL of ABTS+ were diluted with 145 mL of distilled water. The assay was performed by mixing 700 µL of the sample extract with 1.3 mL of ABTS+ solution, and absorbance was measured at 734 nm. The radical scavenging activity (% inhibition) was calculated using the formula [(Ac − As)/Ac] × 100, where Ac is the absorbance of the control sample (extraction buffer in equal volume replacing the actual sample), and As is the absorbance of the sample extract.
Characterization of cooked rice
Infrared spectra
Freshly cooked rice was freeze-dried for 24 h (Delta 2–24 LSC; Martin Christ Gefriertrocknungsanlagen GmbH, Osterode am Harz, Germany) to eliminate excess moisture. The freeze-dried rice was ground and sieved. Samples of ground rice were then analyzed by Fourier transform infrared spectroscopy (FT-IR; Vertex 70, Bruker, Bremen, Germany). Pellets were prepared by mixing ground, dried samples (1 mg) with potassium bromine (100 mg). The pellets were scanned within a range of 4000–400 cm−1 at room temperature.
Thermal properties
Thermal properties of freeze-dried samples were analyzed using a differential scanning calorimeter (DSC7; PerkinElmer, Waltham, Massachusetts, USA). Twenty milligrams of sample were placed in an aluminum pan, sealed, equilibrated to room temperature, and then heated from 20 to 120 °C at a ramp rate of 5 °C/min against an empty pan. The thermal parameters were automatically recorded from thermograms, showing onset temperature (To), peak temperature (Tp), conclusion temperature (Tc) and enthalpy (ΔH).
Nutritional composition of cooked rice
Proximate chemical compositions of cooked rice samples were analyzed according to the method of the AOAC (2005). The results included moisture, crude protein, crude lipid, ash and crude fiber. The samples were first dried in a hot air oven (WOF-155; Wisd Laboratory Instruments, Wertheim, Germany) at 105 °C for 24 h for moisture analysis. Crude protein was analyzed using the Kjeldahl analyzer (Kjeltec™ 8100, FOSS, Tecator, Sweden). Crude lipid was extracted using a Soxhlet extraction unit (Soxtec™ 8000; Foss, Hillerød, Denmark). Ash was gravimetrically determined after burning at 600 °C for 2 h in a muffle furnace (E30-HT; Thai Furnaces Engineering, Lampang, Thailand). Fiber was determined using a fiber analyzer (Kjeltec™ 8000; Foss, Hillerød, Denmark). Nitrogen-free extract (NFE, %) was calculated as [100 – (moisture + crude protein + crude lipid + crude fiber + ash)].
Sensory evaluation
The sensory evaluation of the cooked rice was performed using a panel of 50 untrained consumers aged 20 to 60 years. Drinking water was provided to clean the palate and tongue between samples. The panelists were required to assess each sample based on attributes that included appearance, color, aroma, texture, taste, hardness, stickiness and overall acceptability. The rating was based on the nine-point hedonic scale ranging from 1 “dislike extremely” to 9 “like extremely”. The central hedonic term of “neither like nor dislike” carried a value of 5 in the evaluation.
Stability test
Rice cooked with 0.6% BPPE was chosen for the stability test. Cooked rice was left to cool to room temperature and then placed in plastic boxes which were covered with either transparent plastic or opaque plastic. The boxes of cooked rice were stored in a refrigerator at 0 to 2 °C. Stored samples were harvested on days 0, 2, 4, 6, and 8 to determine the key parameters b*, TPC, and TAC.
Statistical analysis
This trial was set up in a completely randomized design. The results are expressed as means ± standard errors of means (SEM). The Statistical Package for Social Science (SPSS) Version 14 (SPSS Inc., Chicago, USA) was used for all statistical evaluations. The statistical significance (p < 0.05) of the means between treatments was tested with One-Way Analysis of Variance, followed by a post hoc Duncan’s new multiple range test. The relationships between each pair of measured variables were expressed in terms of Pearson correlation coefficients (r). An independent t-test was used to compare means between groups in the stability test.
Results and discussion
Color appearance
Within the studied concentration range of 0.2 to 0.8%, the anthocyanin in BPPE produced cooked rice that varied in color from light blue to dark blue. Photographs of cooked rice containing the studied concentrations of BPPE are shown in Fig. 1 accompanied by charts that illustrate the levels of the color parameters L*, a*, b*, C*, h*, and ∆E* in each sample of cooked rice. L* indicates darkness (0) to brightness (100), a* indicates the degree of redness (+ a) to greenness (− a), and b* indicates the degree of yellowness (+ b) to blueness (− b), while ∆E* indicates total color differences from no change (0) to complete change (100) (Nugroho 2008). These values significantly decreased with increments of BPPE (p < 0.05), indicating that the darkness, greenness, and blueness of the cooked rice increased as the concentration of BPPE increased. On the other hand, h* and C* were significantly higher in the presence of BPPE. These two-color characteristics, chroma and hue, indicate color differences due to wavelength, from red (0°) to blue (270°), and color purity, from vividness (+ C) to dullness (− C), respectively (Nugroho 2008). Therefore, the obtained values of these parameters indicated that adding BPPE increased the blueness and vividness of the cooked rice.
Fig. 1.

Color appearance (a) and color parameters of cooked rice containing various proportions of dried butterfly pea petal extract: lightness/darkness (b), redness/greenness (c), yellowness/blueness (d), chroma (e), hue (f), and color difference (g). Data are expressed as means ± SEM (n = 4). Different superscripts indicate a significant difference (p < 0.05) between treatments
pH, TPC, TAC, and radical scavenging activity
pH, TPC, TAC, and radical scavenging activity of cooked rice samples are shown in Table 1. The pH of the cooked rice was generally similar across all five concentrations of BPPE (p > 0.05). Although some variations were observed (4.07% coefficient of variation), the pH levels were within the normal pH range of freshly cooked rice (Heo et al. 2009). The other parameters were significantly higher than control at all BPPE concentrations (p < 0.05). These increases indicate the benefits of adding BPPE to cooked rice.
Table 1.
pH, total phenolic content (TPC), total anthocyanin content (TAC) and antioxidant activity of rice cooked with various concentrations of butterfly pea petal extract (BPPE)
| Parameter | % BPPE | p-value | ||||
|---|---|---|---|---|---|---|
| 0 | 0.2 | 0.4 | 0.6 | 0.8 | ||
| pH | 8.45 ± 0.09 | 7.85 ± 0.26 | 8.23 ± 0.25 | 7.61 ± 0.14 | 8.10 ± 0.25 | 0.095 |
| TPC (mg GAE/100 g DW) | 0.55 ± 0.03d | 1.16 ± 0.08c | 1.53 ± 0.01b | 1.70 ± 0.04b | 2.11 ± 0.10a | < 0.001 |
| TAC (mg CGE/100 g DW) | 0.03 ± 0.00d | 0.07 ± 0.01c | 0.11 ± 0.01b | 0.15 ± 0.01a | 0.15 ± 0.02a | < 0.001 |
| DPPH (% inhibition) | 48.2 ± 0.4d | 55.9 ± 0.4c | 60.7 ± 0.3b | 61.9 ± 0.4b | 64.3 ± 0.9a | < 0.001 |
| ABTS (% inhibition) | 64.9 ± 0.7d | 79.4 ± 0.1c | 89.7 ± 0.5b | 91.1 ± 1.1b | 97.1 ± 1.2a | < 0.001 |
GAE gallic acid equivalent, DW dry weight, CGE cyanidin-3-glucoside equivalents, DPPH 1,1-diphenyl-2-picrylhydrazyl radical scavenging capacity, ABTS 2,2-Azino-bis-(3-ethylbenzothiazoline-6-sulfonic acid radical scavenging capacity
Data are expressed as means ± SEM (n = 4)
Significant differences in each row are indicated by different superscripts (p < 0.05)
TPC and TAC contributed to improved antioxidant capacity, as indicated by the highly positive correlation (p < 0.01, Table 2) between both chemical groups and radical scavenging activity (DPPH and ABTS). TPC and TAC include phenol and glycosides that act as antioxidants. These compounds can prevent oxidative stress from reactive oxygen species by restoring redox reaction balance. These molecules donate electrons to neutralize free radicals and lower levels of free radicals reduce lipids, proteins, and DNA damage. Phenolic compounds and anthocyanins are generally considered bioactive compounds with antioxidant activity. They are associated with anti-inflammatory effects, and reduced risk of cancers, heart ischemia–reperfusion injury, strokes, arthritis, diabetes, and obesity, as well as immune system reinforcement (Vareed et al. 2006; Hou et al. 2013; Zhu et al. 2013). Highly significant relationships have been reported between TPC, TAC, and radical scavenging activity across a range of foods, including colored barley (Kim et al. 2007) and red and blue maize (Žilić et al. 2012).
Table 2.
The table compares total phenolic content (TPC), total anthocyanin content (TAC) and antioxidant activity of rice cooked with various concentrations of butterfly pea petal extract
| Parameter | Regression equation | r | n | p-value |
|---|---|---|---|---|
| TPC vs TAC | y = 10.570x − 5.969 | 0.886 | 20 | < 0.001 |
| TPC vs DPPH | y = 10.642x + 43.213 | 0.973 | 20 | < 0.001 |
| TPC vs ABTS | y = 21.148x + 54.653 | 0.966 | 20 | < 0.001 |
| TAC vs DPPH | y = 0.945x + 49.773 | 0.901 | 20 | < 0.001 |
| TAC vs ABTS | y = 1.882x + 67.654 | 0.909 | 20 | < 0.001 |
| DPPH vs ABTS | y = 1.978x − 30.706 | 0.994 | 20 | < 0.001 |
Relationships between pairs of variables are expressed by Pearson correlation coefficients (r). Twenty data points from five concentrations with quadruplicate determination were used for calculations
DPPH 1,1-diphenyl-2-picrylhydrazyl radical scavenging capacity, ABTS 2,2-Azino-bis-(3-ethylbenzothiazoline-6-sulfonic acid radical scavenging capacity
Characteristics of cooked rice
FT-IR spectra illustrated the characteristics of specific chemical groups in cooked rice containing BPPE (Fig. 2). Scanning in a range from 4000 to 400 cm–1 produced sixteen spectral peaks and slight differences were observed between control and rice cooked with BPPE. In particular, anthocyanin compounds produced the spectral peak at 3423 cm–1, which indicates hydroxyl and O–H stretching of phenols and alcohols (Lakshmi et al. 2014). The peak at 2918 cm–1 indicates C–H and was attributed to the aliphatic stretching of alkane compounds (Wahyuningsih et al. 2017) while the peak at 1651 cm–1 was attributed to the C=C stretching of carboxylic acids (Lakshmi et al. 2014). Some changes in phenolic compounds are indicated by the band of C–H stretching of a phenolic aromatic at 1153 cm–1 (Lupoi et al. 2015), and the absorption band of benzoxazine at 935 cm–1 (Li et al. 2011). Some spectral changes are also indicated in slight modifications of protein characteristics, such as the N–H bending and C–N stretching of amide II at 1535 cm–1, and the vibration of amide III in C–N and N–H groups at 1253 cm–1 (Rawdkuen et al. 2012; Kaewprachu et al. 2016). Modifications of carbohydrates were observed in the spectral peaks at 1456 and 611 cm–1 that respectively indicate C–H bending in –CH2 and C–C stretching in CH2 of polysaccharides (Wang et al. 2016). Carbohydrate modification is also detected at 1074 and 1008 cm–1 where the peaks are attributed to C–O stretching (Mansour et al. 2020; Mary et al. 2020). Antisymmetric and symmetric stretching vibrations of methylene and methyl groups at 721 cm–1 indicate some changes in lipid profiles (Socaciu et al. 2020). Other published spectra have indicated modifications of lignocellulosic materials and ash (Theodosolou et al. 2010; Roldan et al. 2014).
Fig. 2.

FT-IR spectra are of rice cooked with various proportions of dried butterfly pea petal extract
The thermal behavior of starch has been characterized by DSC, in terms of To, Tp, Tc, and ΔH. In the present study, thermal peaks were absent between 20 and 120 °C. This indicates the absence of native starch after cooking. The addition of BPPE had no effect on the thermal behavior of cooked rice.
Nutritional composition
Adding BPPE had no significant effects on moisture, crude protein, crude lipid, crude fiber, ash, and NFE contents in cooked rice (p > 0.05). The cooked rice contained 58.5 ± 0.8% moisture on fresh weight, and 8.50 ± 0.05% crude protein, 0.11 ± 0.01% crude lipid, 0.53 ± 0.03% crude fiber, 0.53 ± 0.03% ash, and 31.8 ± 0.2% NFE on a dry matter basis. No effects were observed on nutritional composition but functional properties were significantly improved. These desirable characteristics promote the use of BPPE as an additive (colorant) when cooking rice.
Sensory evaluation and stability
Since the color of a food product influences the perception of taste, attractiveness, acceptance, and willingness to eat of consumers, the effects of BPPE on consumer responses to appearance, color, aroma, texture, taste, hardness, stickiness, and overall acceptability of cooked rice, were assessed (Table 3). No significant differences (p > 0.05) were perceived in the texture, hardness, and stickiness among all treatments. Responses to the appearance, color, aroma, and taste were similar between the control white rice and rice cooked with 0.6 or 0.8% BPPE. Compared to white rice, only the rice cooked with 0.6% BPPE produced a significantly higher overall level of acceptability. This indicates that the consumers generally preferred the specific shade of blue rice produced by 0.6% BPPE over conventional white rice.
Table 3.
Sensory attributes of cooked rice containing various concentrations of butterfly pea petal extract (BPPE) were judged by a panel of 50 consumers
| Sensory attribute | % BPPE | p-value | ||||
|---|---|---|---|---|---|---|
| 0 | 0.2 | 0.4 | 0.6 | 0.8 | ||
| Appearance | 6.32 ± 0.21a | 5.42 ± 0.25b | 5.74 ± 0.25ab | 6.40 ± 0.19a | 6.28 ± 0.22a | 0.007 |
| Color | 5.88 ± 0.20ab | 5.00 ± 0.26c | 5.72 ± 0.27b | 6.44 ± 0.21a | 6.32 ± 0.22ab | < 0.001 |
| Aroma | 6.44 ± 0.22a | 5.46 ± 0.28b | 5.56 ± 0.26b | 6.42 ± 0.26a | 6.12 ± 0.25ab | 0.011 |
| Texture | 6.64 ± 0.20 | 6.16 ± 0.22 | 6.10 ± 0.22 | 6.68 ± 0.19 | 6.54 ± 0.21 | 0.153 |
| Taste | 6.74 ± 0.18a | 6.02 ± 0.21b | 5.76 ± 0.19b | 6.64 ± 0.19a | 6.28 ± 0.24ab | 0.003 |
| Hardness | 6.36 ± 0.20 | 6.20 ± 0.20 | 6.16 ± 0.16 | 6.30 ± 0.18 | 5.96 ± 0.23 | 0.648 |
| Stickiness | 6.46 ± 0.22 | 6.10 ± 0.17 | 6.08 ± 0.19 | 6.44 ± 0.21 | 6.32 ± 0.22 | 0.521 |
| Overall acceptability | 6.60 ± 0.20bc | 6.40 ± 0.19c | 6.60 ± 0.20bc | 7.16 ± 0.17a | 6.96 ± 0.17ab | 0.027 |
Data are expressed as means ± SEM (n = 50)
Significant differences in each row are indicated by different superscripts (p < 0.05)
In a previous study based on rice, using an extract from whole butterfly pea flowers at 1.25% (w/v) either maintained or reduced a number of sensory evaluation scores relative to conventional white rice, and the values were significantly reduced at a concentration of 2.5% (Chusak et al. 2019). This study differed from our investigations since extracting whole flowers causes a dilution of the pigment, and all the extract was added at the start of cooking and then heated until the end of cooking. This long-term hydrothermal treatment might also reduce the effect of the colorant. In our cooking method, BPPE was added 5 min before the end of cooking, to reduce the damage caused by heating. Across a range of products, the proportion of butterfly pea flower used can change depending on the preparation protocol, the background color of other ingredients, and the acceptance of a particular color in specific products or markets. For instance, a study of the manufacture of gummy candy (Loñez and Banwa 2021) used a relatively high proportion of butterfly pea flower (3% w/v).
In terms of stability, cooked rice can generally be stored in the refrigerator for 6 to 7 days (Boyer and McKinney 2018). The stability of ready-to-eat blue rice studied rice cooked with 0.6% BPPE kept in refrigerated conditions (0 to 2 °C) under a transparent or opaque cover. The blueness of cooked rice was stable over 8 days under an opaque cover (p > 0.05) whereas under a transparent cover, the blueness was significantly lower on day 6 (p < 0.05, Fig. 3a). The loss of blueness was due to the extremely unstable structure of monomeric anthocyanins in cooked rice. Their blue color is easily degraded by light and heat, eventually disappearing altogether (Martynenko and Chen 2016). Values of TPC and TAC, significantly decreased with storage time (p < 0.05, Fig. 3b, c), and the opaque cover generally preserved levels of both constituents more than the transparent cover. However, TPC and TAC contents on day 8 under the opaque cover were statistically better than the TPC and TAC of white rice (by 204 and 1,078%, respectively). The quality of blue rice in storage, especially the stability of TPC and TAC can be maintained not only by an opaque cover but also by sterile-packaging, vacuum-packing, or treatment with atmospheric pressure plasma (Lee et al. 2018; Federici et al. 2021).
Fig. 3.
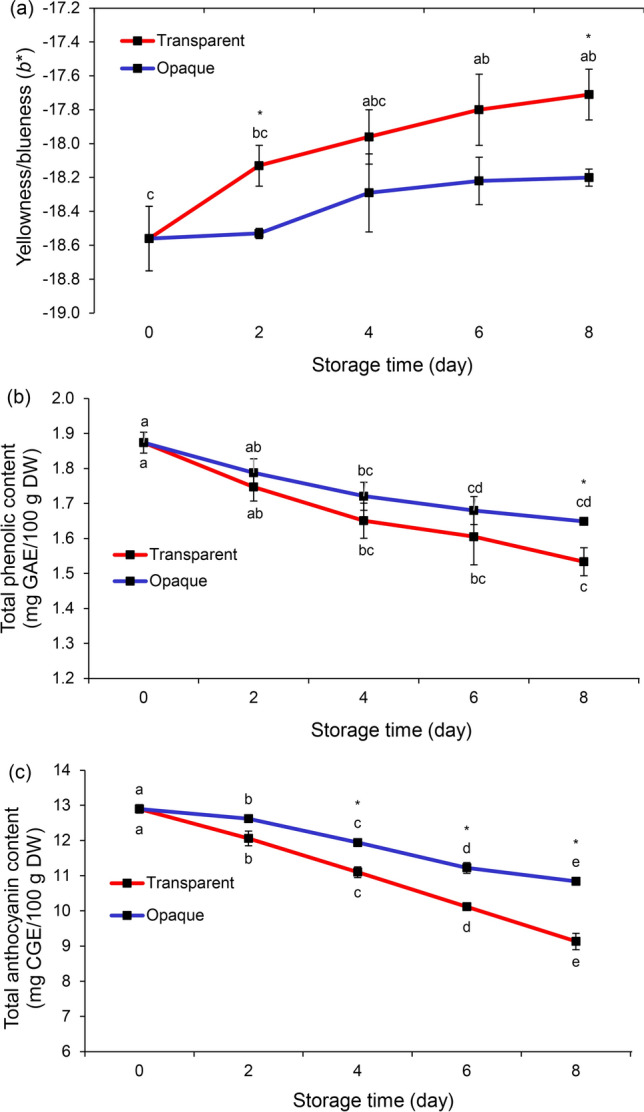
The stability of ready-to-eat blue rice was evaluated under refrigerated conditions over 8 days: yellowness/blueness (a), total phenolic content (b), total anthocyanin content (c) were monitored every two days. Data are expressed as means ± SEM (n = 4). Different superscripts indicate a significant difference (p < 0.05) between treatments. An asterisk (*) indicates significant difference between transparent and opaque covers
Future development of BPPE product
Based on the consumer response to the blue rice in the present study, and since butterfly pea flower is acceptable for culinary purposes in southern Asian countries, we optimized the form of a ready-to-use BPPE product as shown in Figure S1. The BPPE was oven-dried at 50 °C for 24 h to eliminate moisture, and then mixed with an appropriate proportion of rice flour (1:1 w/w). The obtained glutinous dough was formed into a flat sheet, dried at 50 °C for 4 h, and stored in a refrigerator. The precise weight of 370 mg of this product was appropriate for 100 g of uncooked rice, obtaining the characteristics of color, TAC, TPC, and antioxidant capacity rated most desirable in the evaluation study. This product is easy-to-use, saves time and can be applied to other foods, drinks, and desserts.
Conclusion
The water-based extract of butterfly pea (Clitoria ternatea) petals significantly improved color characteristics, total phenolic content, total anthocyanin content, and radical scavenging activity of cooked rice, without altering thermal properties or nutritional composition. Based on a sensory evaluation study, consumers preferred the appearance, color, aroma, texture, taste, hardness, stickiness, and overall acceptability of rice cooked with 0.6% dried butterfly pea petal extract. This cooked rice was color stable under an opaque cover in refrigerated conditions for 8 days. Total phenolic content and total anthocyanin content decreased significantly with storage time. Findings from the current study can be used to produce blue rice for domestic or commercial purposes and could also be used to produce other products.
Supplementary Information
Below is the link to the electronic supplementary material.
The illustration shows the production process of ready-to-use butterfly pea petal extract for use in cooking blue rice.
Acknowledgements
This work was financially supported in part by research budgets for senior projects from the Division of Health and Applied Sciences, Faculty of Science, Prince of Songkla University. The authors acknowledge the International Relations Unit, Faculty of Science, Prince of Songkla University, for advice in manuscript preparation.
Abbreviations
- a*
Redness/greenness
- ABTS
2,2-Azino-bis-(3-ethylbenzothiazoline-6-sulfonic acid)
- b*
Yellowness/blueness
- BPPE
Butterfly pea petal extract
- C*
Chroma
- CGE
Cyanidin-3-glucoside equivalents
- DPPH
1, 1-Diphenyl-2-picrylhydrazyl
- DSC
Differential scanning calorimeter
- ∆E*
Color difference
- FT-IR
Fourier transform infrared spectroscopy
- GAE
Gallic acid equivalent
- h*
Hue
- ΔH
Enthalpy
- L*
Lightness/darkness
- NFE
Nitrogen-free extract
- To
Onset temperature
- Tc
Conclusion temperature
- Tp
Peak temperature
- TAC
Total anthocyanin content
- TPC
Total phenolic content
Author contributions
Conceptualization, OM and KT; Data curation, OM, WH and KT; Formal analysis, OM, WH, KT, NN and SB; Funding acquisition, KT; Investigation, OM, WH, KT and NN; Methodology, OM, WH, KT, NN and SB; Project administration, KT; Resources, KT and NN; Supervision, KT; Validation, KT; Visualization, KT; Roles/Writing—original draft, OM, KT and NN; Writing—review and editing, OM and KT.
Funding
The authors have not disclosed any funding.
Data availability
Available upon request.
Code availability
Not applicable.
Declarations
Conflict of interest
The authors declare that they have no conflict of interest.
Ethics approval
This study does not involve any human or animal testing.
Consent to participate
Not applicable.
Consent for publication
All authors agree to publish this draft.
Footnotes
Publisher's Note
Springer Nature remains neutral with regard to jurisdictional claims in published maps and institutional affiliations.
References
- Abdel-Aal ESM, Young JC, Rabalski I. Anthocyanin composition in black, blue, pink, purple, and red cereal grains. J Agric Food Chem. 2006;54:4696–4704. doi: 10.1021/jf0606609. [DOI] [PubMed] [Google Scholar]
- Aly AA, Zaky EA, Mahmoud HA, Alrefaei AF, Hameed AM, Alessa H, Alsimaree AA, Aljohani M, El-Bahy SM, Kadasah S. The impact of addition oats (Avena sativa) and cinnamon on cookies and their biological effects on rats treated with cirrhosis by CCl4. Saudi J Biol Sci. 2021;28:7142–7151. doi: 10.1016/j.sjbs.2021.08.010. [DOI] [PMC free article] [PubMed] [Google Scholar]
- AOAC (2005) Official method of analysis of AOAC international. Association of Official Analytical Chemists, Arlington
- Bhuyan B, Sonowal R. An overview of Pandanus maryllifolius Roxb. ex Lindl. and its potential impact on health. Curr Trends Pharm Res. 2021;8:138–157. [Google Scholar]
- Boyer RR, McKinney JM (2018) Food storage guidelines for consumers. Virginia State University, Virginia Cooperative Extension
- Chusak C, Ying JAY, Zhien JL, Pasukamonset P, Henry CJ, Ngamukote S, Adisakwattana S. Impact of Clitoria ternatea (butterfly pea) flower on in vitro starch digestibility, texture and sensory attributes of cooked rice using domestic cooking methods. Food Chem. 2019;295:646–652. doi: 10.1016/j.foodchem.2019.05.157. [DOI] [PubMed] [Google Scholar]
- Devi GN, Padmavathi G, Babu VR, Waghray K. Proximate nutritional evaluation of rice (Oryza sativa L.) J Rice Res. 2015;8:23–32. [Google Scholar]
- Federici E, Gentilucci V, Bernini V, Vittadini E, Pellegrini N. Ready to eat shelf-stable brown rice in pouches: effect of moisture content on product’s quality and stability. Eur Food Res Technol. 2021;247:2677–2685. doi: 10.1007/s00217-021-03790-2. [DOI] [PMC free article] [PubMed] [Google Scholar]
- Gupta GK, Chahal J, Bhatia M. Clitoria ternatea (L.): old and new aspects. J Pharm Res. 2010;3:2610–2614. [Google Scholar]
- Heo SK, Lee JY, Baek SB, Ha SD. A response surface model to describe the effect of temperature and pH on the growth of Bacillus cereus in cooked rice. J Food Prot. 2009;72:1296–1300. doi: 10.4315/0362-028x-72.6.1296. [DOI] [PubMed] [Google Scholar]
- Hou F, Zhang R, Zhang M, Su D, Wei Z, Deng Y, Zhang Y, Chi J, Tang X. Hepatoprotective and antioxidant activity of anthocyanins in black rice bran on carbon tetrachloride-induced liver injury in mice. J Funct Foods. 2013;5:1705–1713. doi: 10.1016/j.jff.2013.07.015. [DOI] [Google Scholar]
- Hungerford G, Lemos MA, Chu BS. Binding of Clitoria ternatea L. flower extract with α-amylase simultaneously monitored at two wavelengths using a photon streaming time-resolved fluorescence approach. Spectrochim Acta. 2019;211A:108–113. doi: 10.1016/j.saa.2018.11.062. [DOI] [PubMed] [Google Scholar]
- Jeyaraj EJ, Lim YY, Choo WS. Extraction methods of butterfly pea (Clitoria ternatea) flower and biological activities of its phytochemicals. J Food Sci Technol. 2021;58:2054–2067. doi: 10.1007/s13197-020-04745-3. [DOI] [PMC free article] [PubMed] [Google Scholar]
- Kaewprachu P, Osako K, Benjakul S, Rawdkuen S. Effect of protein concentrations on the properties of fish myofibrillar protein-based film compared with PVC film. J Food Sci Technol. 2016;53:2083–2091. doi: 10.1007/s13197-016-2170-7. [DOI] [PMC free article] [PubMed] [Google Scholar]
- Kim MJ, Hyun JN, Kim JA, Park JC, Kim MY, Kim JG, Lee SJ, Chun SC, Chung IM. Relationship between phenolic compounds, anthocyanins content and antioxidant activity in colored barley germplasm. J Agric Food Chem. 2007;55:4802–4809. doi: 10.1021/jf0701943. [DOI] [PubMed] [Google Scholar]
- Kim JH, Yoon YH, Kim ID, Dhungana SK, Park YS, Shin DH. Effect of turmeric extracts on nutritional and antioxidant properties of germinated Korean brown rice. Korean J Plant Resour. 2021;34:517–526. doi: 10.7732/kjpr.2021.34.6.517. [DOI] [Google Scholar]
- Lakshmi CHND, Raju BDP, Madhavi T, Sushma NJ. Identification of bioactive compounds by FTIR analysis and in vitro antioxidant activity of Clitoria ternatea leaf and flower extracts. Indo Am J Pharm Res. 2014;4:3894–3903. [Google Scholar]
- Lee KH, Woo KS, Yong HI, Jo C, Lee SK, Lee BW, Oh SK, Lee YY, Lee B, Kim HJ. Assessment of microbial safety and quality changes of brown and white cooked rice treated with atmospheric pressure plasma. Food Sci Biotechnol. 2018;27:661–667. doi: 10.1007/s10068-017-0297-6. [DOI] [PMC free article] [PubMed] [Google Scholar]
- Leong LP, Shui G. An investigation of antioxidant capacity of fruits in Singapore markets. Food Chem. 2002;76:69–75. doi: 10.1016/S0308-8146(01)00251-5. [DOI] [Google Scholar]
- Li S, Yan S, Yu J, Yu B. Synthesis and characterization of new benzoxazine-based phenolic resins from renewable resources and the properties of their polymers. J Appl Polym Sci. 2011;122:2843–2848. doi: 10.1002/app.34342. [DOI] [Google Scholar]
- Loñez HE, Banwa TP. Butterfly pea (Clitoria ternatea): a natural colorant for soft candy (gummy candy) Indian J Sci Technol. 2021;14:239–244. doi: 10.17485/IJST/v14i3.582. [DOI] [Google Scholar]
- Lupoi JS, Singh S, Parthasarathi R, Simmons BA, Henry RJ. Recent innovations in analytical methods for the qualitative and quantitative assessment of lignin. Renew Sustain Energy Rev. 2015;49:871–906. doi: 10.1016/j.rser.2015.04.091. [DOI] [Google Scholar]
- Mansour M, Salah M, Xu X. Effect of microencapsulation using soy protein isolate and gum Arabic as wall material on red raspberry anthocyanin stability, characterization, and simulated gastrointestinal conditions. Ultrason Sonochem. 2020 doi: 10.1016/j.ultsonch.2019.104927. [DOI] [PubMed] [Google Scholar]
- Mardiah Z, Septianingrum E, Handoko DD, Kusbiantoro B. Improvement of red rice eating quality through one-time polishing process and evaluation on its phenolic and anthocyanin content. Int J Agric for Plant. 2017;5:23–24. [Google Scholar]
- Martynenko A, Chen Y. Degradation kinetics of total anthocyanins and formation of polymeric color in blueberry hydrothermodynamic (HTD) processing. J Food Eng. 2016;171:44–51. doi: 10.1016/j.jfoodeng.2015.10.008. [DOI] [Google Scholar]
- Mary SK, Koshy RR, Daniel J, Koshy JT, Pothen LA, Thomas S. Development of starch based intelligent films by incorporating anthocyanins of butterfly pea flower and TiO2 and their applicability as freshness sensors for prawns during storage. RSC Adv. 2020;10:39822–39830. doi: 10.1039/D0RA05986B. [DOI] [PMC free article] [PubMed] [Google Scholar]
- Nugroho E. Pengenalan teori warna. Yogyakarta: Andi Publisher; 2008. [Google Scholar]
- Rawdkuen S, Suthiluk P, Kamhangwong D, Benjakul S. Mechanical, physico-chemical, and antimicrobial properties of gelatin-based film incorporated with catechin-lysozyme. Chem Cent J. 2012;6:1–10. doi: 10.1186/1752-153X-6-131. [DOI] [PMC free article] [PubMed] [Google Scholar]
- Re R, Pellegrini N, Proteggente A, Pannala A, Yang M, Rice-Evans C. Antioxidant activity applying an improved ABTS radical cation decolorization assay. Free Radic Biol Med. 1999;26:1231–1237. doi: 10.1016/S0891-5849(98)00315-3. [DOI] [PubMed] [Google Scholar]
- Roldan ML, Centeno SA, Rizzo A, van Dyke Y. Characterization of bistre pigment samples by FTIR, SERS, Py-GC/MS and XRF. Mater Res Soc Symp Proc. 2014;1656:139–148. doi: 10.1557/opl.2014. [DOI] [Google Scholar]
- Silva WMF, Biduski B, Lima KO, Pinto VZ, Hoffmann JF, Vanier NL, Dias ARG. Starch digestibility and molecular weight distribution of proteins in rice grains subjected to heat-moisture treatment. Food Chem. 2017;219:260–267. doi: 10.1016/j.foodchem.2016.09.134. [DOI] [PubMed] [Google Scholar]
- Socaciu C, Fetea F, Ranga F, Bunea A, Dulf F, Socaci S, Pintea A. Attenuated total reflectance-Fourier transform infrared spectroscopy (ATR-FTIR) coupled with chemometrics, to control the botanical authenticity and quality of cold-pressed functional oils commercialized in Romania. Appl Sci. 2020 doi: 10.3390/app10238695. [DOI] [Google Scholar]
- Sokhey AS, Chinnaswamy R. Chemical and molecular properties of irradiated starch extrudates. Cereal Chem. 1993;70:260–268. [Google Scholar]
- Sutharut J, Sudarat J. Total anthocyanin content and antioxidant activity of germinated colored rice. Int Food Res J. 2012;19:215–221. [Google Scholar]
- Theodosolou E, Koroneos A, Soldatos T, Zorba T, Paraskevopoulos K. Comparative Fourier transform infrared and X-ray powder diffraction analysis of naturally occurred K-feldspars. Bull Geol Soc Greece. 2010;43:2752–2761. doi: 10.12681/bgsg.11681. [DOI] [Google Scholar]
- Vareed SK, Reddy MK, Schutzki RE, Nair MG. Anthocyanins in Cornus alternifolia, Cornus controversa, Cornus kousa and Cornus florida fruits with health benefits. Life Sci. 2006;78:777–784. doi: 10.1016/j.lfs.2005.05.094. [DOI] [PubMed] [Google Scholar]
- Wahyuningsih S, Wulandari L, Wartono MW, Munawaroh H, Ramelan AH. The effect of pH and color stability of anthocyanin on food colorant. IOP Conf Ser Mater Sci Eng. 2017 doi: 10.1088/1757-899X/193/1/012047. [DOI] [Google Scholar]
- Wang H, Lv J, Jiang S, Niu B, Pang M, Jiang S. Preparation and characterization of porous corn starch and its adsorption toward grape seed proanthocyanidins. Starch-Stärke. 2016;68:1254–1263. doi: 10.1002/star.201600009. [DOI] [Google Scholar]
- Zhu Y, Ling W, Guo H, Song F, Ye Q, Zou T, Li D, Zhang Y, Li G, Xiao Y, Liu F, Li Z, Shi Z, Yang Y. Anti-inflammatory effect of purified dietary anthocyanin in adults with hypercholesterolemia: a randomized controlled trial. Nutr Metab Cardiovasc Dis. 2013;23:843–849. doi: 10.1016/j.numecd.2012.06.005. [DOI] [PubMed] [Google Scholar]
- Žilic S, Serpen A, Akıllıoğlu G, Gökmen V, Vančetović J. Phenolic compounds, carotenoids, anthocyanins, and antioxidant capacity of colored maize (Zea mays L.) kernels. J Agric Food Chem. 2012;60:1224–1231. doi: 10.1021/jf204367z. [DOI] [PubMed] [Google Scholar]
Associated Data
This section collects any data citations, data availability statements, or supplementary materials included in this article.
Supplementary Materials
The illustration shows the production process of ready-to-use butterfly pea petal extract for use in cooking blue rice.
Data Availability Statement
Available upon request.
Not applicable.