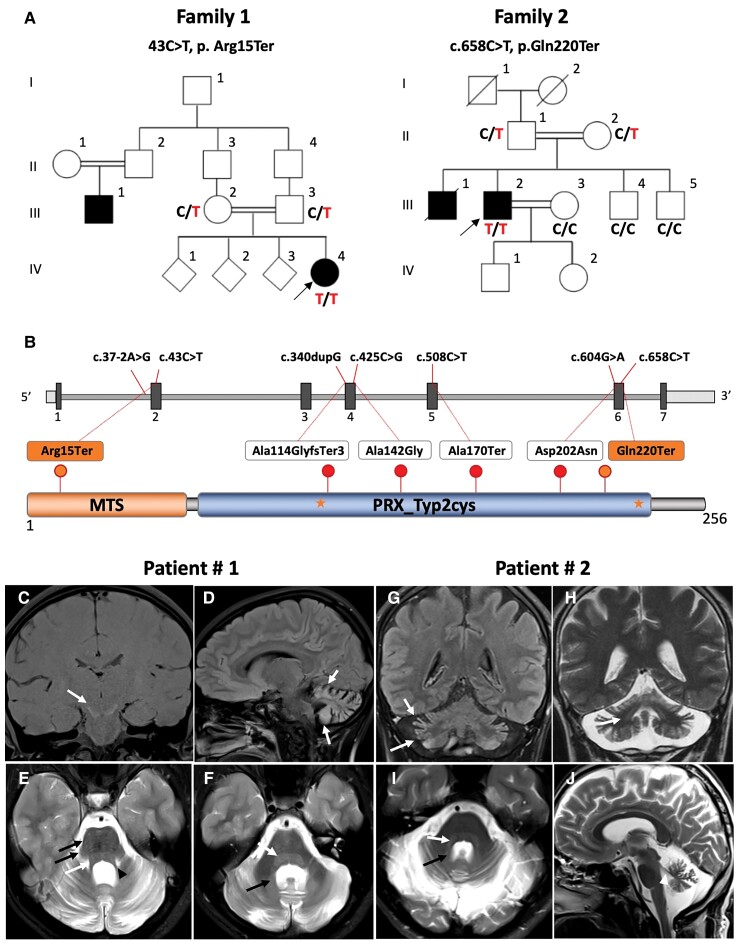
Figure 1.
Cerebellar ataxia families with novel homozygous loss-of-function variants in PRDX3. (A) Pedigree of families with infantile-onset (Family 1) and mid-adult onset (Family 2) cerebellar ataxia. The index patient of Family 1 is homozygous for PRDX3 variant c.43C>T, p.Arg15Ter. The index patient of Family 2 is homozygous for the variant c.658C<T, Gln220Ter. (B) Diagram illustrates the two novel variants (orange) and the previously reported variants (red) in PRDX3. cDNA variants positions are shown on top and their respective protein change below in the protein domain diagram. Stars represent active site resolving cysteines. (C–J) MRI signal changes in PRDX3 disease. MRI images from the index patient Family 1 (C–F) and index patient Family 2 (G–J). Patient 1: (C) Coronal T1-weighted image shows hyperintensity of the substantia nigra (white arrow). Atrophy and T2-hyperintensity of the cortical grey matter in the cerebellum seen on sagittal T2-fluid-attenuated inversion recovery (FLAIR) (D, white arrows) and on the axial T2-weighted scan (E and F). Also, the superior cerebellar peduncle shows a volume reduction (arrowhead, E). T2 hyperintensity of the formatio reticularis (white arrows in E and F), transversal stripes of the pons (black arrows, E) and T2 hyperintensity of the dentate nucleus (black arrow, I). Patient 2: Coronal T2-FLAIR-weighted image (G) shows hyperintensity of the cortical grey matter in the cerebellum and on the coronal and axial T2-weighted scans (F and G). T2 hyperintensity of the formatio reticularis (white arrow, G) and T2 hyperintensity of the dentate nucleus (white arrow H and I). The superior cerebellar peduncle shows a volume reduction (arrowhead, J).

