Figure 1.
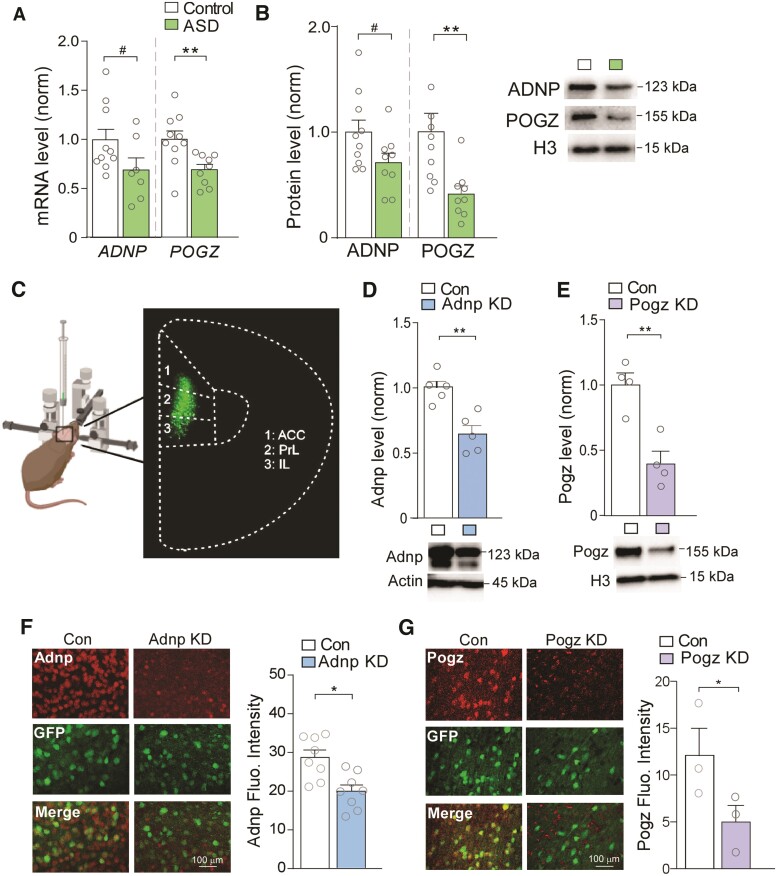
ADNP and POGZ are diminished in PFC of ASD patients, which is simulated by viral-based KD of these NDD risk factors in mouse PFC. (A) Bar graphs showing mRNA levels of ADNP and POGZ in human post-mortem PFC tissue from control (n = 10) and ASD subjects (ADNP: t = 1.86, P = 0.085, n = 7; POGZ: t = 3.05, P = 0.0082, n = 9; unpaired t-tests). (B) Bar graphs showing protein levels of ADNP and POGZ in nuclear fractions isolated from human control (n = 10) and ASD (n = 9) subjects (ADNP: t = 2.00, P = 0.062; POGZ: I = 3.08, P = 0.0093; unpaired t-tests). Inset: representative western blot images. (C) Schematic representation of stereotaxic injection of GFP-tagged shRNA AAV into mouse medial PFC. Inset: representative image of GFP signal in viral-infected PFC. (D and E) Bar graphs showing Adnp (D) or Pogz (E) protein levels in PFC from mice with stereotaxic injection of a control shRNA versus Adnp shRNA or Pogz shRNA AAV (Adnp: n = 5/group, t = 4.31, P = 0.0030, Pogz: n = 4/group, t = 4.57, P = 0.0038, unpaired t-tests). Inset: representative western blot images. (F and G) Immunostaining images and quantification of Adnp (red, F) or Pogz (red, G) in PFC slices from mice injected with a control shRNA versus Adnp shRNA (F) or Pogz shRNA (G) AAV (F: n = 8 images/group, t = 3.47, P = 0.0038, G: n = 3 images/group, t = 2.15, P = 0.049, unpaired t-test). Green, AAV-linked GFP signal. All data are presented as mean ± SEM. #P < 0.1, *P < 0.05, **P < 0.01.

