

Abstract
The fundamental aim of this project was to assess the sonophotocatalytic degradation of textile dyes mostly eluted from industries into wastewater. Such a pretreatment of wastewater makes the water suitable for drinking and irrigation purposes and thereby helps protect the ecosystem. The main objective of this research was to degrade real samples and laboratory-prepared samples sonophotocatalytically using a silver-impregnated ZnO photocatalyst. Reactive dyes, including Fast Yellow AB (FY AB) and Remazol Brilliant Violet-5R (RBV-5R), were degraded via this technique under optimum and enhanced conditions. The photocatalyst was synthesized through a wet impregnation process and characterized by scanning electron microscopy (SEM), energy-dispersive X-ray (EDX) analysis, Fourier transform infrared (FTIR) spectroscopy, and UV/vis spectroscopy to examine the morphology, composition, and functional groups of the photocatalyst. Parameters including pH, dosage, dye concentration, scavengers, and effects of oxidizing agents were considered. Under optimal conditions, the degradations were 95.7 and 88.9% for RBV-5R and FY AB, respectively, in 60 min. The pH and oxidizing agents played important roles in the degradation process. Only 43.8 and 32.5% of RBV-5R and FY AB, respectively, were degraded in the absence of an oxidizing agent. With the addition of oxidizing agents, 95.7 and 88.9% of RBV-5R and FY AB degradation occurred, respectively. The optimal pH values for RBV 5-R and FY-AB were 8 and 12, respectively. A comparison between the photocatalytic and sonophotocatalytic processes revealed degradation efficiencies of 41 and 33% for RBV-5R and FY-AB, respectively, by the photocatalytic process. Therefore, results indicate the productivity of the sonophotocatalytic degradation process.
1. Introduction
Zinc oxide is considered as a highly sensitive photocatalyst with high thermal stability and low toxicity. It has good biocompatibility and is thus preferred to be used as a photocatalyst and for biological applications.1 ZnO is commonly used as a photocatalyst in wastewater treatment because it is a versatile n-type semiconductor material with a high excitation binding energy of 60 meV and a wide bandgap energy of 3.3 eV.2,3 Because of its biological application, ZnO has long been considered for dye removal from wastewater. Upon impregnation of ZnO with Ag, the optimal photocatalytic activity of ZnO is increased by a factor of more than 25. ZnO-coated materials have also been used in biomedical applications and healthcare facilities as their coating enhances the photolytic killing of pathogens causing infections. Plants and microorganisms have biomolecules that stabilize the ZnO nanoparticles. These phytogenically synthesized ZnO materials can be used in energy production and environmental improvement in addition to medical uses.4,5
Overpopulation and industrial development have affected water quality all over the world severely.6 Besides its important role in the development of a country, technological advancement is responsible for life-threatening actions like the disposal of industrial effluents into water bodies without any pretreatment.7 The textile, pharmaceutical, papermaking, printing, cosmetics, and food-processing industries dispose of their wastes containing huge amounts of pigments and dyes.8
Dyes are color-imparting organic compounds that are widely used in the textile, plastic, painting, food, paper, leather, and pharmaceutical industries. They cause many environmental problems in the hydrosphere due to their stability, low biodegradability, and high aromaticity.5−7 Several techniques have been adopted to improvise the decorative and functional properties of ZnO, especially in altering its optical properties so that it can be used within the visible region of light. Such techniques include doping or impregnating with metals or nonmetals or forming composites with other semiconductors.8
Statistics show that about 700 000 tons of dyes are manufactured or extracted annually. Based on their applications and nature, commercially, there are more than 40 000 different types of dyes.6 It has been surveyed that the textile industry consumes a major part of the dyes, which is estimated as >100 tons of dye. The effluents of these industries contain about 15–20% of the dyes consumed, which are added to water bodies without pretreatment.9 The wastewater from industries contains a mixture of various substances, i.e., pesticides, nitrogenous compounds, and heavy metals.8 A small-sized textile production unit that yields 8 tons of fabric a day consumes ∼1.6 million liters of water, while 22% of this water is used in dying and printing processes. This dyed water is released into main water channels without pretreatment.10 The textile industry is said to be responsible for 20% of the water pollution globally.11 Therefore, environmental quality is compromised by the effluents from industries.12 Industrial wastes comprise dyes and other organic compounds that deteriorate the groundwater.13 The disposal of untreated wastewater into main water streams by commercial units has also threatened aquatic life.14 They not only disturb the photosynthesis and metabolism of living organisms, but most of these organic compounds are mutagenic and carcinogenic. In addition, dermal problems like irritation and allergic dermatitis are also reported to be caused by dyes.15 Some dyes are not biodegradable because of their complex aromatic molecular structure and immiscibility in water.16
After the establishment of the first wastewater treatment plant (WTP) in the United Kingdom (U.K.) in 1914, many techniques have been adopted to make water suitable for several domestic purposes and reduce the impact of effluents on the environment. These techniques comprise physical methods, i.e., adsorption, iteration, flocculation, and biological treatment.17 Many tools are used to select a suitable wastewater treatment process. Such tools provide useful information for the integration in a multicriteria decision analysis (MCDA), which helps in decision-making. For sustainability, the best tool is life cycle assessment (LCA) as it estimates the cumulative environmental impacts of a product from all stages of the life cycle.18 Advanced oxidation processes (AOPs) are a kind of advanced technology of this era for the treatment of wastewater because they are capable of oxidizing a wide range of organic compounds that are nondegradable via other techniques.19,20
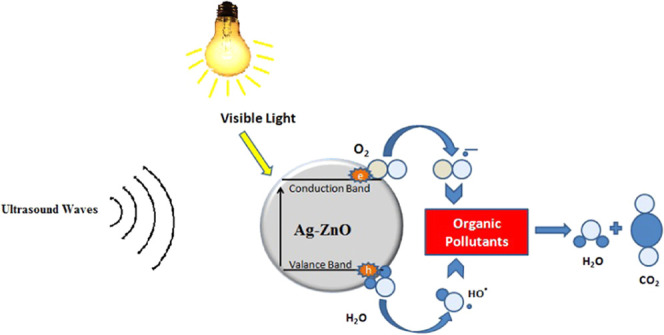
Sonophotocatalytic degradation involves a photocatalyst and visible light for the removal of toxic organic compounds and dyes. Upon irradiation with UV light, the photocatalyst generates electron holes on its surface. These electron holes are species that can absorb water molecules or hydroxide radicals to reproduce hydroxyl free radicals. Such free radicals are considered as strong oxidizing agents.21,22 Sonophotocatalysis is a combination photolysis and sonolysis, which involves ultrasonic sound waves along with ultraviolet radiation in the presence of a photocatalyst to enhance a chemical reaction. This method of wastewater treatment is more dominant than others because of the low cost, low retention time, ease of use, and industrial applicability.
2. Materials and Methods
2.1. Chemicals
All chemicals utilized in this research work were of AR-grade purity and were used directly without any further purification. Zinc oxide (ZnO) and silver nitrate (AgNO3) were purchased from Musajee Chemicals, Peshawar, and Remazol Brilliant Violet-5R and Fast Yellow AB dyes were bought from Boss Chemicals, China.
2.2. Instrumentation
A spectrophotometer (721, China), with matched 1 cm glass cells, was used for all spectrophotometric measurements. A JSMIT-100 scanning electron microscope (SEM) (JEOL, Japan) was used for surface morphology analysis of biosorbents. A JSM-IT-100 energy-dispersive X-ray (EDX) spectrometer (JEOL, Japan) was used to determine the elemental compositions of biosorbents. A Prestigye Fourier transform infrared (FTIR) spectrometer (Shimadzu) was used to determine the functional groups responsible for biosorption. A pH meter (Hanna, Woonsocket, RI) was used to determine the pH of solutions. A sonicator and a 100 W tungsten lamp were used in the process.
2.3. Synthesis of the Ag–ZnO Photocatalyst
The wet impregnation method was adopted to prepare an Ag-impregnated ZnO photocatalyst. For the preparation, a slurry of ZnO was prepared, and a solution of AgNO3 was added to it. Stirring was performed at 900 rpm for 60 min on a magnetic stirrer. Post-stirring, the solution was placed in an oven for 12 h at 110 °C to evaporate the water molecules. The photocatalyst (Ag–ZnO) was placed in a desiccator for 4 h at 500 °C. The dried sample was ground to a powder, passed through a sieve of less than 150 μm, and stored in an air-tight bottle.
2.4. Photocatalytic Study
A comparative study of photocatalytic and sonophotocatalytic degradations was carried out to achieve better degradation of dyes. For this purpose, 50 mL of the mixture was taken from 100 ppm of stock solution of each dye in a 500 mL beaker along with 0.1 g of photocatalyst (Ag–ZnO). The mixture was retained in a resting position for 30 min to attain equilibrium. After this period, 5 mmol of H2O2 was poured into the mixture, and the pH was adjusted to 10. The sample in the beaker was placed under a 100 W tungsten filament lamp to initiate the degradation process. After intervals of 10 min each, a 5 mL sample from the mixture was taken, filtered through ordinary filter paper, and the filtrate was diluted to 25 mL. After dilution, it was analyzed using a UV–Vis spectrophotometer at an optimized wavelength for each dye to determine the degradation. Using eq 1, the percent degradation was calculated as follows
| 1 |
where Ci is the initial concentration of the dye, and Cf is the final concentration of the dye.
2.5. Sonophotocatalytic Study
The same procedure was adopted while degrading the dyes sonophotocatalytically. However, in this technique, the mixture was placed in an ultrasonic bath under a 100 W tungsten bulb at optimized conditions to initiate the degradation. After each time interval of 10 min, a 5 mL sample was taken from the mixture, filtered, and the filtrate was diluted to 25 mL. A UV–Vis spectrophotometer was used to determine the absorbance at the optimized wavelengths (λmax’s) of 560 and 420 nm for Remazol Brilliant Violet-5R (RBV-5R) and Fast Yellow AB (FY-AB), respectively, and the % degradation was calculated by eq 1.
3. Results and Discussion
RBV5-R and FY-AB were subjected to degradation by sonophotocatalytic methods to determine the effects of pH, the catalyst dosage, initial dye concentration, and different enhancers.
3.1. Characterization of the Photocatalyst
The morphology of Ag-impregnated ZnO was studied by SEM to check whether Ag was impregnated over the ZnO surface uniformly or not. Some spherical particles of Ag are visible on the surface of ZnO, which confirms the successful impregnation of Ag on ZnO (Figure 1a,b). The composition of the photocatalyst was studied via EDX, which confirmed the presence of Ag particles on ZnO (Figure 1c). The functional and chemical bond types in the photocatalyst were studied by FTIR spectroscopy. The O–H group of water absorbed by the photocatalyst exhibited bands at 3428 cm–1 (stretching) and 1300–1650 cm–1 (bending). The vibration at 400 cm–1 is attributed to the stretching mode of the metal oxide bond (ZnO), which is less intense in the case of Ag–ZnO due to the presence of Ag on the surface of ZnO particles (Figure 1d).
Figure 1.

(a, b) SEM images, (c) EDX spectra, and (d) FTIR spectra of the Ag–ZnO photocatalyst.
3.2. Sonophotocatalytic Activity
The sonophotocatalytic activities of ZnO and Ag–ZnO were determined under UV irradiation to detect the shifting of the conduction band. Before impregnation, the conduction band of ZnO occurred in the UV region, but after impregnation, it shifted to the visible region. These results suggest that the maximum degradation of RBV-5R and FY AB was achieved with 5% Ag–ZnO. Upon comparing the degradation by photocatalysis and sonophotocatalysis, a slight degradation was observed by photocatalysis, while high degradation was noted in sonophotocatalysis. In photocatalysis, UV light is responsible for the creation of a valance band on the surface of ZnO, wherein the movement of electrons takes place from the valance band toward the conduction band. Upon reaction of the created hole with the adsorbed molecules of water, •OH radicals are produced, while the absorbed O2 radicals react with the electrons in the conduction band to yield O2–•, which degrade the dye.23
3.3. Effect of pH on the Degradation of RBV-5R and FY-AB Dyes
The pH is an important factor in the degradation of dyes. Therefore, degradations of RBV-5R and FY-AB dyes were investigated in the pH range of 2–12. The rate constant was the maximum at pH 10 for RBV-5R and at pH 8 for FY AB. At these respective pH values, the % degradations were 87.82% for RBV-5R and 73.15% and FY-AB. (Figure 2).
Figure 2.

Comparative effect of pH on the degradation of FY-AB and RBV-5R.
During dye degradation, the effect of pH may be attributed to the generation of free radical species (OH) on the surface of the catalyst due to the oxidation of OH– or H2O, as shown in eqs 2 and 3.
| 2 |
| 3 |
Light-source hydroxyl radicals are considered as effective oxidizing agents, which break the azo bond (−N=N−) in azo and reactive dyes, thereby degrading the dyes. At alkaline conditions, OH– production is favored, and thus more degradation occurs. However, in an acidic medium, the H+ ions interact with the Azo bonds in dyes, making them electron-deficient and more vulnerable to OH– attack. Furthermore, at low pH, Ag–ZnO agglomerates, thus reducing the surface area of the photocatalyst. The decline in degradation with an increase in pH may be because beyond the optimum pH, the catalyst surface is highly hydroxylated, and thus the negatively charged surface repels RBV-5R and FY-AB molecules.23
3.4. Effect of Catalyst Dosage on the Degradation of RBV-5R and FY-AB Dyes
The effect of catalyst dosage was assessed in the range of 0.05–0.3 g/50 mL to determine the optimum dosage for better yield. In the beginning, from 0.05 to 0.09 g/mL, the rate constant was increased. At 0.09 g/50 mL, the % degradation was 74.20% for FY-AB and 87.99% for RBV-5R (Figure 3). Further increase in the catalyst dose was responsible for reducing the degradation process. The decrease in degradation may be due to the accumulation of the catalyst in the mixture, which reduces the surface area exposed to the dye molecules. Besides, a higher dosage of the catalyst decreases visible light penetration in the mixture due to increased scattering of light, thus attenuating the absorption of light inside the mixture.24
Figure 3.

Graphical presentation of the effect of dosage on the degradation of FY AB and RBV-5R.
3.5. Effect of Initial Dye Concentration on the Degradation of RBV-5R and FY-AB Dyes
The impact of the initial dye concentration was studied in the range of 10–100 mg/L, which revealed that increasing the initial dye concentration results in a decrease in the degradation of dyes. The highest degradation was observed at the lowest concentration of dyes, i.e., 10 mg/mL initial dye concentration of FY-AB and RBV-5R at optimized conditions degraded 80.86 and 92.92%, respectively, in 60 min (Figure 4). The reduction may be due to the decline in the catalytic efficiency with an increase in the dye concentration. This may also be due to the limited quantity of OH◦ free radicals available for the degradation of dyes. The decrease in the degradation process is attributed to low penetration of light on the catalyst as the dye itself filters light, thus reducing the volume of photoactivity, while at low concentrations, the case is reversed.
Figure 4.

Graphical representation of the effect of the initial dye concentration on the sonophotocatalytic degradation of FY-AB and RBV-5R.
3.6. Effect of Enhancers on the Degradation of RBV-5R and FY-AB Dyes by Ag–ZnO
Oxidizing agents act as enhancers of the degradation process, and thus their effect on the degradation process was studied in the range of 3–7 mmol. Hydrogen peroxide and sodium perchlorate were chosen for the degradation of RBV-5R and FY-AB dyes by Ag–ZnO. The degradation of dyes increased with an increase in the concentration of oxidizing agents. In the absence of oxidizing agents, 43.8% of RBV-5R and 32.5% of FY-AB were degraded. With the addition of 3, 5, and 7 mmol of H2O2, 74.6, 92.5 and 95.7% RBV-5R dye and 68.3, 80.8, and 88.9% FY-AB were degraded, respectively (Figure 5).
Figure 5.

Comparative graph of the effects of H2O2 and NaClO4 on the degradation of RBV-5R dye and Fast Yellow AB dyes.
3.7. Effect of Scavengers on the Degradation of FY-AB and RBV-5R Dyes by Ag–ZnO
The effect of various salts and impurities was assessed to investigate the applicability of this technique. Water bodies contain various chlorides, phosphates, and sulfate ions, which can disrupt the degradation process. These groups/species are known as scavengers as they possess a negative charge, i.e., Cl–, PO4–, SO4–, CO3–, etc., and attenuate the degradation of dyes by interacting with OH free radicals. The following reactions take place
| 4 |
| 5 |
At optimized conditions, the effect of chloride was initially investigated on both dyes The effect of chloride concentration was determined in the range of 0.5–1.5 M. The percent degradation of dyes decreased, and the time needed for degradation increased. Upon adding chlorides, the time taken for dye degradation was increased from 30 to 60 min. Similarly, in the absence of a scavenger, the degradation of RBV-5R was 95.7% in 20 min, while on adding a scavenger, 63.12% degradation was achieved in 60 min. In the case of FY-AB, the % degradation was reduced from 88.9 to 45.75% in 60 min. Sulfates also greatly affected the degradation process. In the absence of scavengers (i.e., sulfates), the degradation of RBV-5R was 95.7% in 20 min, but upon the addition of 1.5 M scavenger, 59.7% degradation occurred in 60 min. Similarly, in the case of FY-AB, the degradation was decreased from 88.9 to 51.3% in 60 min (Figure 6).
Figure 6.

Effect of different concentrations of chlorides and sulfates ions on the degradation of RBV-5R and FY AB.
3.8. Kinetic Models for RBV-5R and FY AB
While applying the pseudo-first-order kinetic model, it was found that the experimental qe value was 5.1047, which was much higher than the calculated qe value, i.e., 0.001169 mg g–1, while the R2 value was also less than 1, i.e., 0.9853. This means that the degradation of RBV-5R did not follow the pseudo-first-order kinetic model. While assessing the second kinetic model, the correlation coefficient value (R2 = 0.9997) was observed to be very close to 1. Similarly, the calculated degradation capacity of Ag–ZnO (qe = 5.260 mg g–1) agrees with the experimental value (qe = 5.1047 mg g–1). This indicates that the sonophotocatalytic degradation of RBV-5R follows the pseudo-second-order kinetic model.
The kinetic models were applied on the degradation of FY AB. The calculated degradation capacity was (qe = 4.694 mg g–1) closer to the experimental value (qe = 4.478 mg g–1). This indicates that the sonophotocatalytic degradation of FY AB follows the pseudo-second-order kinetic model (Table 1 and Figure 7).
Table 1. Comparison of Kinetic Model Values for FY AB and RBV-5R Dyes.
| pseudo-first-order |
pseudo-second-order |
||
|---|---|---|---|
| FY-AB | RBV-5R | FY-AB | RBV-5R |
| qe = 4.478 mg g–1 (experimental) | qe = 5.1047 mg g–1 (experimental) | qe = 4.694 mg g–1 | qe = 5.260 mg g–1 |
| qe = 0.001435 mg g–1 (calculated) | qe = −0.059 mg g–1 (calculated) | K2 = 25.206 min–1 | K2 = 71.253 min–1 |
| K1 = 0.0428 min–1 | K1 = 0.001169 min–1 | R2 = 0.9973 | R2 = 0.9997 |
| R2 = 0.9465 | R2 = 0.9853 | ||
Figure 7.

Pseudo-first-order and -second-order kinetic models for (a, b) RBV 5R (c, d) FY Ab degradation using Ag–ZnO.
3.9. Comparison of Sonophotocatalytic Degradation with Other Methods
Several methods have been investigated for the degradation of textile dyes. Table 2 shows a comparison of such methods for the degradation of RBV-5R and FY AB. The comparison shows that sonophotocatalysis of RBV-5R using Ag–ZnO as a photocatalyst has a great outcome as compared to other methods.
Table 2. Comparison with Other Methods for the Removal of RBV-5R and FY-AB Dyes.
| dye | method | time | % degradation | reference |
|---|---|---|---|---|
| FY-AB | photocatalysis | 5 h | 67% | (25) |
| RBV-5R | adsorption | 240 min | 74% | (26) |
| RBV-5R | adsorption | 4.8 min (with radiation) | 70.20% | (27) |
| RBV-5R | biological degradation | 6 h | 50% | (28) |
| RBV-5R | biological degradation | 72 h | 82.78% | (29) |
| RBV-5R | sonophotocatalysis | 30 min | 95.7% | present work |
| FY-AB | sonophotocatalysis | 40 min | 88% | present work |
4. Conclusions
The proposed project comprehensively analyzed the degradation of azo dyes via the sonophotocatalytic technique. Two dyes, i.e., Remazol Brilliant Violet 5-R (RBV-5R) and Fast Yellow AB (FY-AB), were degraded using a silver-impregnated zinc oxide (Ag–ZnO) photocatalyst. The photocatalyst was prepared by the wet impregnation method. Upon impregnation, the absorption region of ZnO was shifted from the UV region to the visible region. The photocatalyst was characterized through SEM and EDX, FTIR, and UV–visible spectroscopic techniques. The results indicate that ZnO was successfully impregnated with silver (Ag). As the degradation process was carried out in an ultrasonic bath under filament light, the degradation was affected by visible light as well as ultrasonic waves. The ultrasonic waves were believed to be responsible for cavitation in the sample, which helped in the production of free radicals and accelerated the degradation. Besides, the ultrasonic waves prevented the catalyst from aggregating up to an extent. The light source generates free radicals on the surface of the photocatalyst, which are responsible for the degradation process. At enhanced conditions, the degradation efficiencies for RBV-5R and FY-AB were 95.7 and 88% in 30 and 40 min, respectively.
Acknowledgments
The authors thank the Deanship of Scientific Research at Umm Al-Qura University for supporting this work by Grant Code 22UQU4350073DSR10.
This work was supported by a grant from The Oman Research Council (TRC) through the funded project (BFP/RGP/EBR/22/021).
The authors declare no competing financial interest.
References
- Rahman A.; Tan A. L.; Harunsani M. H.; Ahmad N.; Hojamberdiev M.; Khan M. M. Visible light induced antibacterial and antioxidant studies of ZnO and Cu-doped ZnO fabricated using aqueous leaf extract of Ziziphus mauritiana Lam. J. Environ. Chem. Eng. 2021, 9, 105481 10.1016/j.jece.2021.105481. [DOI] [PubMed] [Google Scholar]
- Zhang Y.; Bian T.; Gu J.; Zheng X.; Li Z. Controllable ZnO architectures with the assistance of ethanolamine and their application for removing divalent heavy metals (Cu, Pb, Ni) from water. New J. Chem. 2018, 42, 3356–3362. 10.1039/C7NJ04669C. [DOI] [Google Scholar]
- Velmurugan R.; Incharoensakdi A.. Nanoparticles and Organic Matter: Process and Impact. In Nanomaterials in Plants, Algae, and Microorganisms; Elsevier, 2018; pp 407–428. [Google Scholar]
- Puspasari V.; Ridhova A.; Hermawan A.; Amal M. I.; Khan M. M. ZnO-based antimicrobial coatings for biomedical applications. Bioprocess Biosyst. Eng. 2022, 45, 1421–1445. 10.1007/s00449-022-02733-9. [DOI] [PMC free article] [PubMed] [Google Scholar]
- Rahman A.; Harunsani M. H.; Tan A. L.; Khan M. M. Zinc oxide and zinc oxide-based nanostructures: biogenic and phytogenic synthesis, properties and applications. Bioprocess Biosyst. Eng. 2021, 44, 1333–1372. 10.1007/s00449-021-02530-w. [DOI] [PubMed] [Google Scholar]
- Dawood S.; Sen T. K. Removal of anionic dye Congo red from aqueous solution by raw pine and acid-treated pine cone powder as adsorbent: equilibrium, thermodynamic, kinetics, mechanism and process design. Water Res. 2012, 46, 1933–1946. 10.1016/j.watres.2012.01.009. [DOI] [PubMed] [Google Scholar]
- Yagub M. T.; Sen T. K.; Ang H. Equilibrium, kinetics, and thermodynamics of methylene blue adsorption by pine tree leaves. Water, Air, Soil Pollut. 2012, 223, 5267–5282. 10.1007/s11270-012-1277-3. [DOI] [Google Scholar]
- Arslan I.; Balcioglu I.; Tuhkanen T.; Bahnemann D.. Photochemical and Photocatalytic Detoxification of Reactive Dyebath Wastewater by the Fenton’s Reagent and Novel TiO2 Powders. In Chemical Water and Wastewater Treatment VI; Springer, 2000; pp 293–303. [Google Scholar]
- Yagub M. T.; Sen T. K.; Ang H. Equilibrium, kinetics, and thermodynamics of methylene blue adsorption by pine tree leaves. Water, Air, Soil Pollut. 2012, 223, 5267–5282. 10.1007/s11270-012-1277-3. [DOI] [Google Scholar]
- Fu Y.; Viraraghavan T. Fungal decolorization of dye wastewaters: a review. Bioresour. Technol. 2001, 79, 251–262. 10.1016/S0960-8524(01)00028-1. [DOI] [PubMed] [Google Scholar]
- Khandare R. V.; Govindwar S. P. Phytoremediation of textile dyes and effluents: Current scenario and future prospects. Biotechnol. Adv. 2015, 33, 1697–1714. 10.1016/j.biotechadv.2015.09.003. [DOI] [PubMed] [Google Scholar]
- Abidi N.; Errais E.; Duplay J.; Berez A.; Jrad A.; Schäfer G.; Ghazi M.; Semhi K.; Trabelsi-Ayadi M. Treatment of dye-containing effluent by natural clay. J. Cleaner Prod. 2015, 86, 432–440. 10.1016/j.jclepro.2014.08.043. [DOI] [Google Scholar]
- Venkata Mohan S.; Raghavulu S. V.; Sarma P. Biochemical evaluation of bioelectricity production process from anaerobic wastewater treatment in a single chambered microbial fuel cell (MFC) employing glass wool membrane. Biosens. Bioelectron. 2008, 23, 1326–1332. 10.1016/j.bios.2007.11.016. [DOI] [PubMed] [Google Scholar]
- Tijani J. O.; Fatoba O. O.; Petrik L. A review of pharmaceuticals and endocrine-disrupting compounds: sources, effects, removal, and detections. Water, Air, Soil Pollut. 2013, 224, 1770. 10.1007/s11270-013-1770-3. [DOI] [Google Scholar]
- Bayramoğlu G.; Arıca M. Y. Biosorption of benzidine based textile dyes “Direct Blue 1 and Direct Red 128” using native and heat-treated biomass of Trametes versicolor. J. Hazard. Mater. 2007, 143, 135–143. 10.1016/j.jhazmat.2006.09.002. [DOI] [PubMed] [Google Scholar]
- Lorenc-Grabowska E.; Gryglewicz G. Adsorption characteristics of Congo Red on coal-based mesoporous activated carbon. Dyes Pigm. 2007, 74, 34–40. 10.1016/j.dyepig.2006.01.027. [DOI] [Google Scholar]
- Alsukaibi A. K. D. Various approaches for the detoxification of toxic dyes in wastewater. Processes 2022, 10, 1968. 10.3390/pr10101968. [DOI] [Google Scholar]
- Deru M.US Life Cycle Inventory Database Roadmap (Brochure) National Renewable Energy Laboratory (NREL): Golden, CO; 2009.
- Chacón J. M.; Leal M. T.; Sánchez M.; Bandala E. R. Solar photocatalytic degradation of azo-dyes by photo-Fenton process. Dyes Pigm. 2006, 69, 144–150. 10.1016/j.dyepig.2005.01.020. [DOI] [Google Scholar]
- Muruganandham M.; Swaminathan M. Decolourisation of Reactive Orange 4 by Fenton and photo-Fenton oxidation technology. Dyes Pigm. 2004, 63, 315–321. 10.1016/j.dyepig.2004.03.004. [DOI] [Google Scholar]
- Daneshvar N.; Salari D.; Khataee A. Photocatalytic degradation of azo dye acid red 14 in water on ZnO as an alternative catalyst to TiO2. J. Photochem. Photobiol. A 2004, 162, 317–322. 10.1016/S1010-6030(03)00378-2. [DOI] [Google Scholar]
- Anpo M. Utilization of TiO2 photocatalysts in green chemistry. Pure Appl. Chem. 2000, 72, 1265–1270. 10.1351/pac200072071265. [DOI] [Google Scholar]
- Shah J.; Jan M. R.; Khitab F. Sonophotocatalytic degradation of textile dyes over Cu impregnated ZnO catalyst in aqueous solution. Process Saf. Environ. Prot. 2018, 116, 149–158. 10.1016/j.psep.2018.01.008. [DOI] [Google Scholar]
- Ahmad M.; Rehman W.; Khan M. M.; Qureshi M. T.; Gul A.; Haq S.; Ullah R.; Rab A.; Menaa F. Phytogenic fabrication of ZnO and gold decorated ZnO nanoparticles for photocatalytic degradation of Rhodamine B. J. Environ. Chem. Eng. 2021, 9, 104725 10.1016/j.jece.2020.104725. [DOI] [Google Scholar]
- Pare B.; Singh P.; Jonnalgadda S. Artificial light assisted photocatalytic degradation of lissamine fast yellow dye in ZnO suspension in a slurry batch reactor. Indian J. Chem. 2009, 48A, 1364–1369. [Google Scholar]
- Ribeiro G. A. C.; Silva D. S. A.; Santos C. C. d.; Vieira A. P.; Bezerra C. W. B.; Tanaka A. A.; Santana S. A. A. Removal of Remazol brilliant violet textile dye by adsorption using rice hulls. Polímeros 2017, 27, 16–26. 10.1590/0104-1428.2386. [DOI] [Google Scholar]
- Khasri A.; Jamir M. R. M.; Ahmad M. A. Adsorbent from orange peel for remazol brilliant dye removal: Equilibrium and kinetic studies. AIP Conf. Proc. 2019, 2124, 020055 10.1063/1.5117115. [DOI] [Google Scholar]
- Shah B.; Jain K.; Jiyani H.; Mohan V.; Madamwar D. Microaerophilic Symmetric Reductive Cleavage of Reactive Azo Dye-Remazole Brilliant Violet 5R by Consortium VIE6: Community Synergism. Appl. Biochem. Biotechnol. 2016, 180, 1029–1042. 10.1007/s12010-016-2150-4. [DOI] [PubMed] [Google Scholar]
- Rajendran R.; Kiruthika S.; Saranya P.; Mohan A.; Vaishali C.. Biodecolorization of Azo Dye Mixture (Remazol Brilliant Violet 5R and Reactive Red 120) by Indigenous Bacterial Consortium Obtained From Dye Contaminated Soil, 2021. https://doi.org/10.21203/rs.3.rs-322758/v1.