Abstract
Retrofitting retirement or existing fossil boiler with biomass is an important method of curbing electricity shortage and lowering the cost of modern power plants. However, the use of biomass combustion is hampered by operational problems, such as the resulting high unburned carbon, amount of bottom ash, and nitrogen oxide (NOx) release. In this study, we investigated the burning of pulverized biomass in a retrofitting boiler power plant using computational fluid dynamics of commercial software fluent ANSYS to determine the optimal combustion conditions. The objective of this study was to investigate a 125 MWe pulverized biomass boiler that was retrofitted from an anthracite down-fired boiler. The air distribution, including the influence of the secondary air ratio and the location of the burner standby, was evaluated. Key factors such as biomass ash mass at the hopper, char conversion, and high zone temperature relating to NOx formation/reduction were calculated. The adjustment of the secondary air ratio from 30 to 50% of the total air and the mass ash at the hopper significantly decreased to a low value at 247 kg/h and a high value of char conversion at 97.33% in case R (SA40%). The standard deviation temperature was 240 K at the BNR B–A level for case R, which was significantly lower than in other cases. This implies that the best mixing of air and biomass occurs in case R at 40%. Comparative analysis of the burner standby conditions showed that the NOx emission was similar at the boiler outlet (approximately 94–116 ppm). Burner A on standby, with a secondary air ratio of 40%, was used as the optimal case with the highest value of char conversion at 98.43%, the lowest bottom ash release of 204 kg/h, and a low-NOx emission of 106 ppm.
1. Introduction
To attain net zero emissions (NZEs) by 2050, the existing coal plants are either retrofitted by firing or cofiring low emission fuels, such as biomass or ammonia, carbon capture, utilization, and storage, or repurposed for system flexibility or simply retired.1 By 2030, the NZE recommends the removal of approximately 40% of the existing coal-fired electricity. Since 2010, coal-fired electricity retirements have averaged approximately 25 GW/year, largely owing to the decommissioning of aging plants in the United States and Europe.2 According to International Energy Agency (IEA), bioenergy power generation on an annual basis will add an average of 15 GW, that is, from 718 TWh in 2020 to more than 1400 TWh by 2030. The repurposing and retrofitting of fossil fuel options will reduce the impact of electricity shortage and cost of new power plants.
In South Korea, on average, the existing coal-fired power plants are as old as 20 years. In Korea’s Electricity Market for Net Zero scenarios, it is expected that the physical assets’ lifetimes will be extended by retrofitting low-carbon fuel generation. Under the Paris Agreement, South Korea is committed to limiting carbon dioxide equivalent (Mt CO2-eq) emissions to 536 million tons by 2030 from 709 Mt CO2-eq in 2018. To reach these ambitious targets, carbon emissions from the power generation sector were considerably decreased based on the 9th Basic Plan for Long-Term Electricity (BPLE), Nationally Determined Contribution (NDC), and Carbon Neutral Strategy (CNS) targets.3,4 Fossil fuel phase-out, a retrofitted Yeongdong power plant boiler, was used for burning biomass samples. The 125 MWe capacity boiler was retrofitted from the down-shot firing to wall-fired while switching from anthracite coal to biomass. The use of biomass reduces gas emissions while maintaining the reliability of the electricity supply.
However, the use of biomass combustion in large-scale power generation plants presents several challenges. Biomass combustion properties are different from those of coal. Compared to coal with a higher percentage of volatility, the lease volatile rate and volatile oxidation in biomass combustion are very important.5−7 The formation of NOx can be explained by the conversion of vol-N to NH3 and HCN. The fuel-N and mole H/N ratios were influenced by the biomass pretreatment.8 With regard to the activation energy of volatile rates, isoconversional methods have increasingly received attention because they do not depend on the heating rate. The kinetic experiment method has been applied in simulation.9,10 The unburnt composition of the biomass considerably depends on the particle size.11 One of our experiments in the drop tube furnace revealed that in the wood pellet fuel containing particles with sizes larger than 600 μm, the unburned carbon (UBC) increased owing to a slower reactivity.12 The Hardgrove grindability index value for TFG coal and R.PSD biomass was 70 and 15, respectively, thereby revealing a higher resistance to grinding for biomass.13
Reducing NOx emissions is a major problem in thermal power plants. According to the global emission reduction goal (moving toward the NZE), the reduction of NOx emissions in the power sector using solid fuel was limits of 200 mg/m3 for above 50 MWth,2. Currently, numerous technologies, including low-NOx burners,14,15 air or fuel staging combustion, over-fire air (OFA) operation,16,17 flue gas reburning, or recirculation,18 are used to control NOx emissions. These technologies are used to minimize nitrogen contact with fuel and oxygen while permitting NOx reduction in fuel-rich zones. Wang et al.19 proposed a combustion technology, which modifies the axes of the inner and outer secondary air boxes of a swirl burner to reduce NOx emissions. A thermal test was carried out while mixing the inner and outer optimized secondary air to reduce the NOx emission of a swirl burner.20 Further, the multistaging combustion technology with multi-injection was carried out in a 600 MWe boiler.21 Air staging combustion is a promising technology that reduces NOx emissions and unburned carbon or char conversion in a pulverized biomass boiler.
Secondary air (known as fuel-lean flow) can affect NOx emission and char burnout.21,22 The air distribution near the burner region creates a recirculation zone and may suppress NOx formation.23 Furthermore, pulverized biomass combustion with different sizes and biomass inlet positions considerably influences biomass ash falling into the hopper and high UBC. In this study, a 125 MWe pulverized biomass boiler was selected for CFD research. Previous research showed that NOx formation principally occurred based on the rate of the thermal NOx. Its reduction by fuel NOx considerably contributed to the low-NOx emission at the boiler outlet. Additionally, the quantity of particles larger than 665 μm must be reduced in the biomass boiler.24 The reference case (R) was used to validate the CFD results by comparing them to the actual data. Previous research focused on the NOx mechanism and influence of particle sizes on char conversion. In this research, the influence of air distribution, including the rearrangement of secondary air and burner standby, was examined to determine the ideal arrangement. Hence, key factors, such as hopper ash release, carbon conversion in the hopper ash, fly ash, and NOx formation/reduction, were calculated.
2. Biomass Boiler Geometry and Boundary Conditions
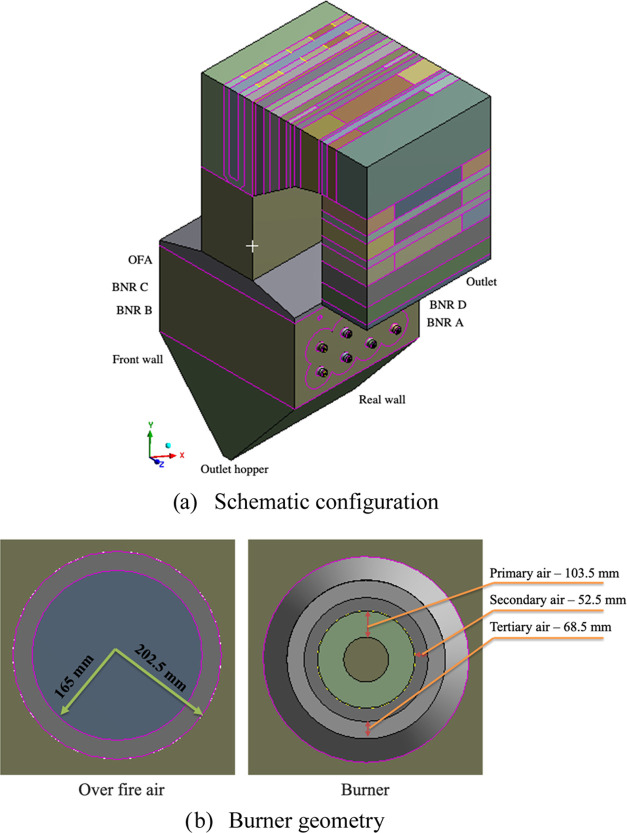
Figure 1 shows the schematic configuration and burner geometry of the biomass boiler with two rows of burners on each side of the furnace wall. Figure 1b shows the structural diagram of the burner and over-fire air inlet size. An over-fire air (OFA) port is installed to complete the burning and reduce NOx emission. The boiler’s height is 34.76 m and its cross section is 13.41 m × 14.63 m. The specifications of the biomass boiler are shown in Table 1.
Figure 1.
Schematic configuration of the biomass boiler and burner geometry.
Table 1. Boiler Specification.
| boiler
type |
W-shape | |
|---|---|---|
| electricity capacity | 125 MWe | |
| operators | Korea South-East Power Co. Ltd. | |
| main steam | outlet steam flow, kg/h | 420 000 |
| pressure of steam drum, kg/cm2 g | 146.10 | |
| temperature, °C | 541 | |
| reheater steam | outlet steam flow, kg/h | 367 000 |
| pressure outlet, kg/cm2 g | 30.90 | |
| pressure inlet, kg/cm2 g | 34.40 | |
| temperature outlet, °C | 541 | |
| temperature inlet, °C | 356 | |
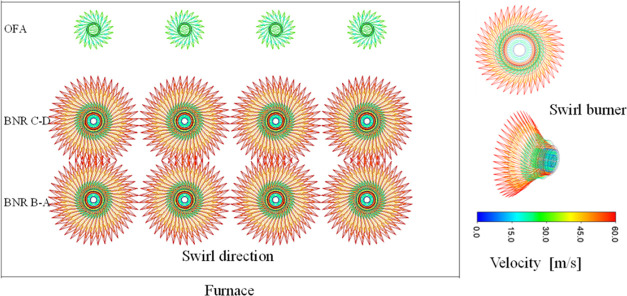
Each burner is served by primary, secondary, and tertiary air streams. The pulverized biomass and primary air are expelled by nonswirling, whereas the secondary and tertiary air streams are swirled clockwise or anticlockwise, thereby creating an angle of 45° through a radial duct of the inner 12 axial-fixed vanes (Figure 2). The direction of flow is essential to ensure a stable flame and maintain its proximity to the center of the furnace. Subsequently, there are new platen, final superheater (SH), primary and reheater SH, and economizer in the main flow direction at the boiler outlet. In this study, after investigation, the mesh optimization for the boiler was effective at 4,916,201 hexahedral elements and 5,013,209 nodes, with an average orthogonal quality of 0.98896. The absolute residuals were considered to be 10–4 for the convergence criteria of all of the variables with runs of over 20,000 time steps.
Figure 2.
Swirl burners at the furnace wall.
The biomass particle is generally larger than the coal particle, which considerably influences the char burnout.25 The properties of the SY sample (raw and char) biomass are used in the biomass boiler, as illustrated in the previous research.24 The volatile content of the SY biomass at 70.35% is considerably higher than the fixed carbon at 19.52%, with a higher heating value of 19.713 kJ/kg. The ultimate analysis of the SY sample is known as the weight percent of element analysis. For this analysis, carbon, sulfur, nitrogen, hydro, and oxygen on a dry ash free basis were 44.60, 0.92, 2.79, 5.62, and 46.07%, respectively.
3. Methodology
3.1. Devolatilization Kinetic of Biomass Samples
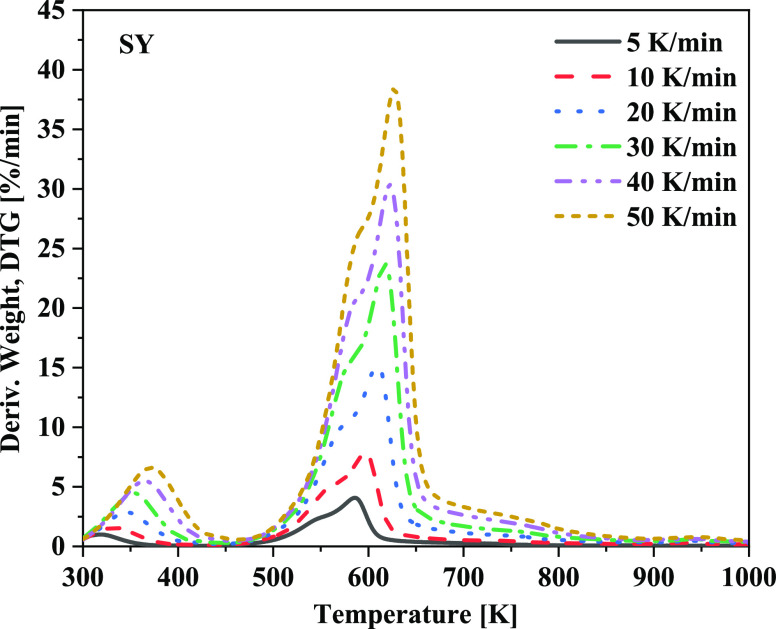
The first key reaction in the combustion process is the devolatilization of raw biomass. The rate at which volatiles evolve influences the position of combustion and fire intensity. In this study, thermogravimetry analysis (TGA) equipment (SDT Q600) was used to determine the devolatilization kinetic parameters of SY biomass. In recent times, the distributed activation energy model has increasingly received attention because it does not depend on the heating rate and is independent of first-order reactions. Figure 3 shows the derived weight (DTG) curves at six different heating rates of SY biomass.
Figure 3.
Derived weight loss (DTG) profiles from thermal decomposition.
A, E, and R are the frequency factor or the pre-exponential factor (s–1), activation energy (J mol–1), and universal gas constant (8.314 J K–1 mol–1), respectively, and can be expressed as follows
| 1 |
In this solver, the generalized reduced gradient algorithm was applied in the Excel Solver program26 to solve nonlinear programs (eq 1). This solver stops before finding a locally optimal solution. Thermogravimetry analysis data were recorded at six heating rates of 5, 10, 20, 30, 40, and 50 K/min to determine the apparent activation energies (E) and prefactors (A) of volatile release. The correlation coefficient (R2) was very high at approximately 0.99, whereas the mean square error (0.0029) and normalized mean square error (1.51 × 10⁻⁵) were very low for most of the conversions, thereby revealing the reliability of the results. The average activation energy and frequency factors for SY were 198.97 kJ/mol and 9.72 × 10¹⁷ (1/s), respectively. Further, this value was used for the single-rate devolatilization model in Fluent.
3.2. Numerical Simulation and NOx Mechanism
3.2.1. Numerical Methods
The ANSYS Fluent 2020R1 was used for biomass burnout and NOx emission in the boiler of the thermal power plants. ANSYS Fluent’s discrete phases are available for the heat and mass transfer relationships, known as “laws”. The single kinetic rate devolatilization model was used in this study. For char oxidation, a kinetics/diffusion-limited model was calculated using the apparent char oxidation rate. The heterogeneous combustion of char and SY was modeled using kinetic/diffusion-limited rate model, which considered the kinetics, partial pressure, and diffusion of oxygen
| 2 |
where pO2 (Pa) and R (sm–1) are the oxygen partial pressure and kinetic rate of char oxidation, respectively. The constant C1 (s/K0.75) of the diffusion rate D0 was 1.4 × 10⁻¹¹, and a pre-exponential factor of 0.04 (1/s) and an activation energy of 44.8 (kJ/mol) were recommended after validating this model.7,14
Figure 4 shows a summary of the combustion process of the biomass in CFD. The main equations were derived as follows.
Figure 4.
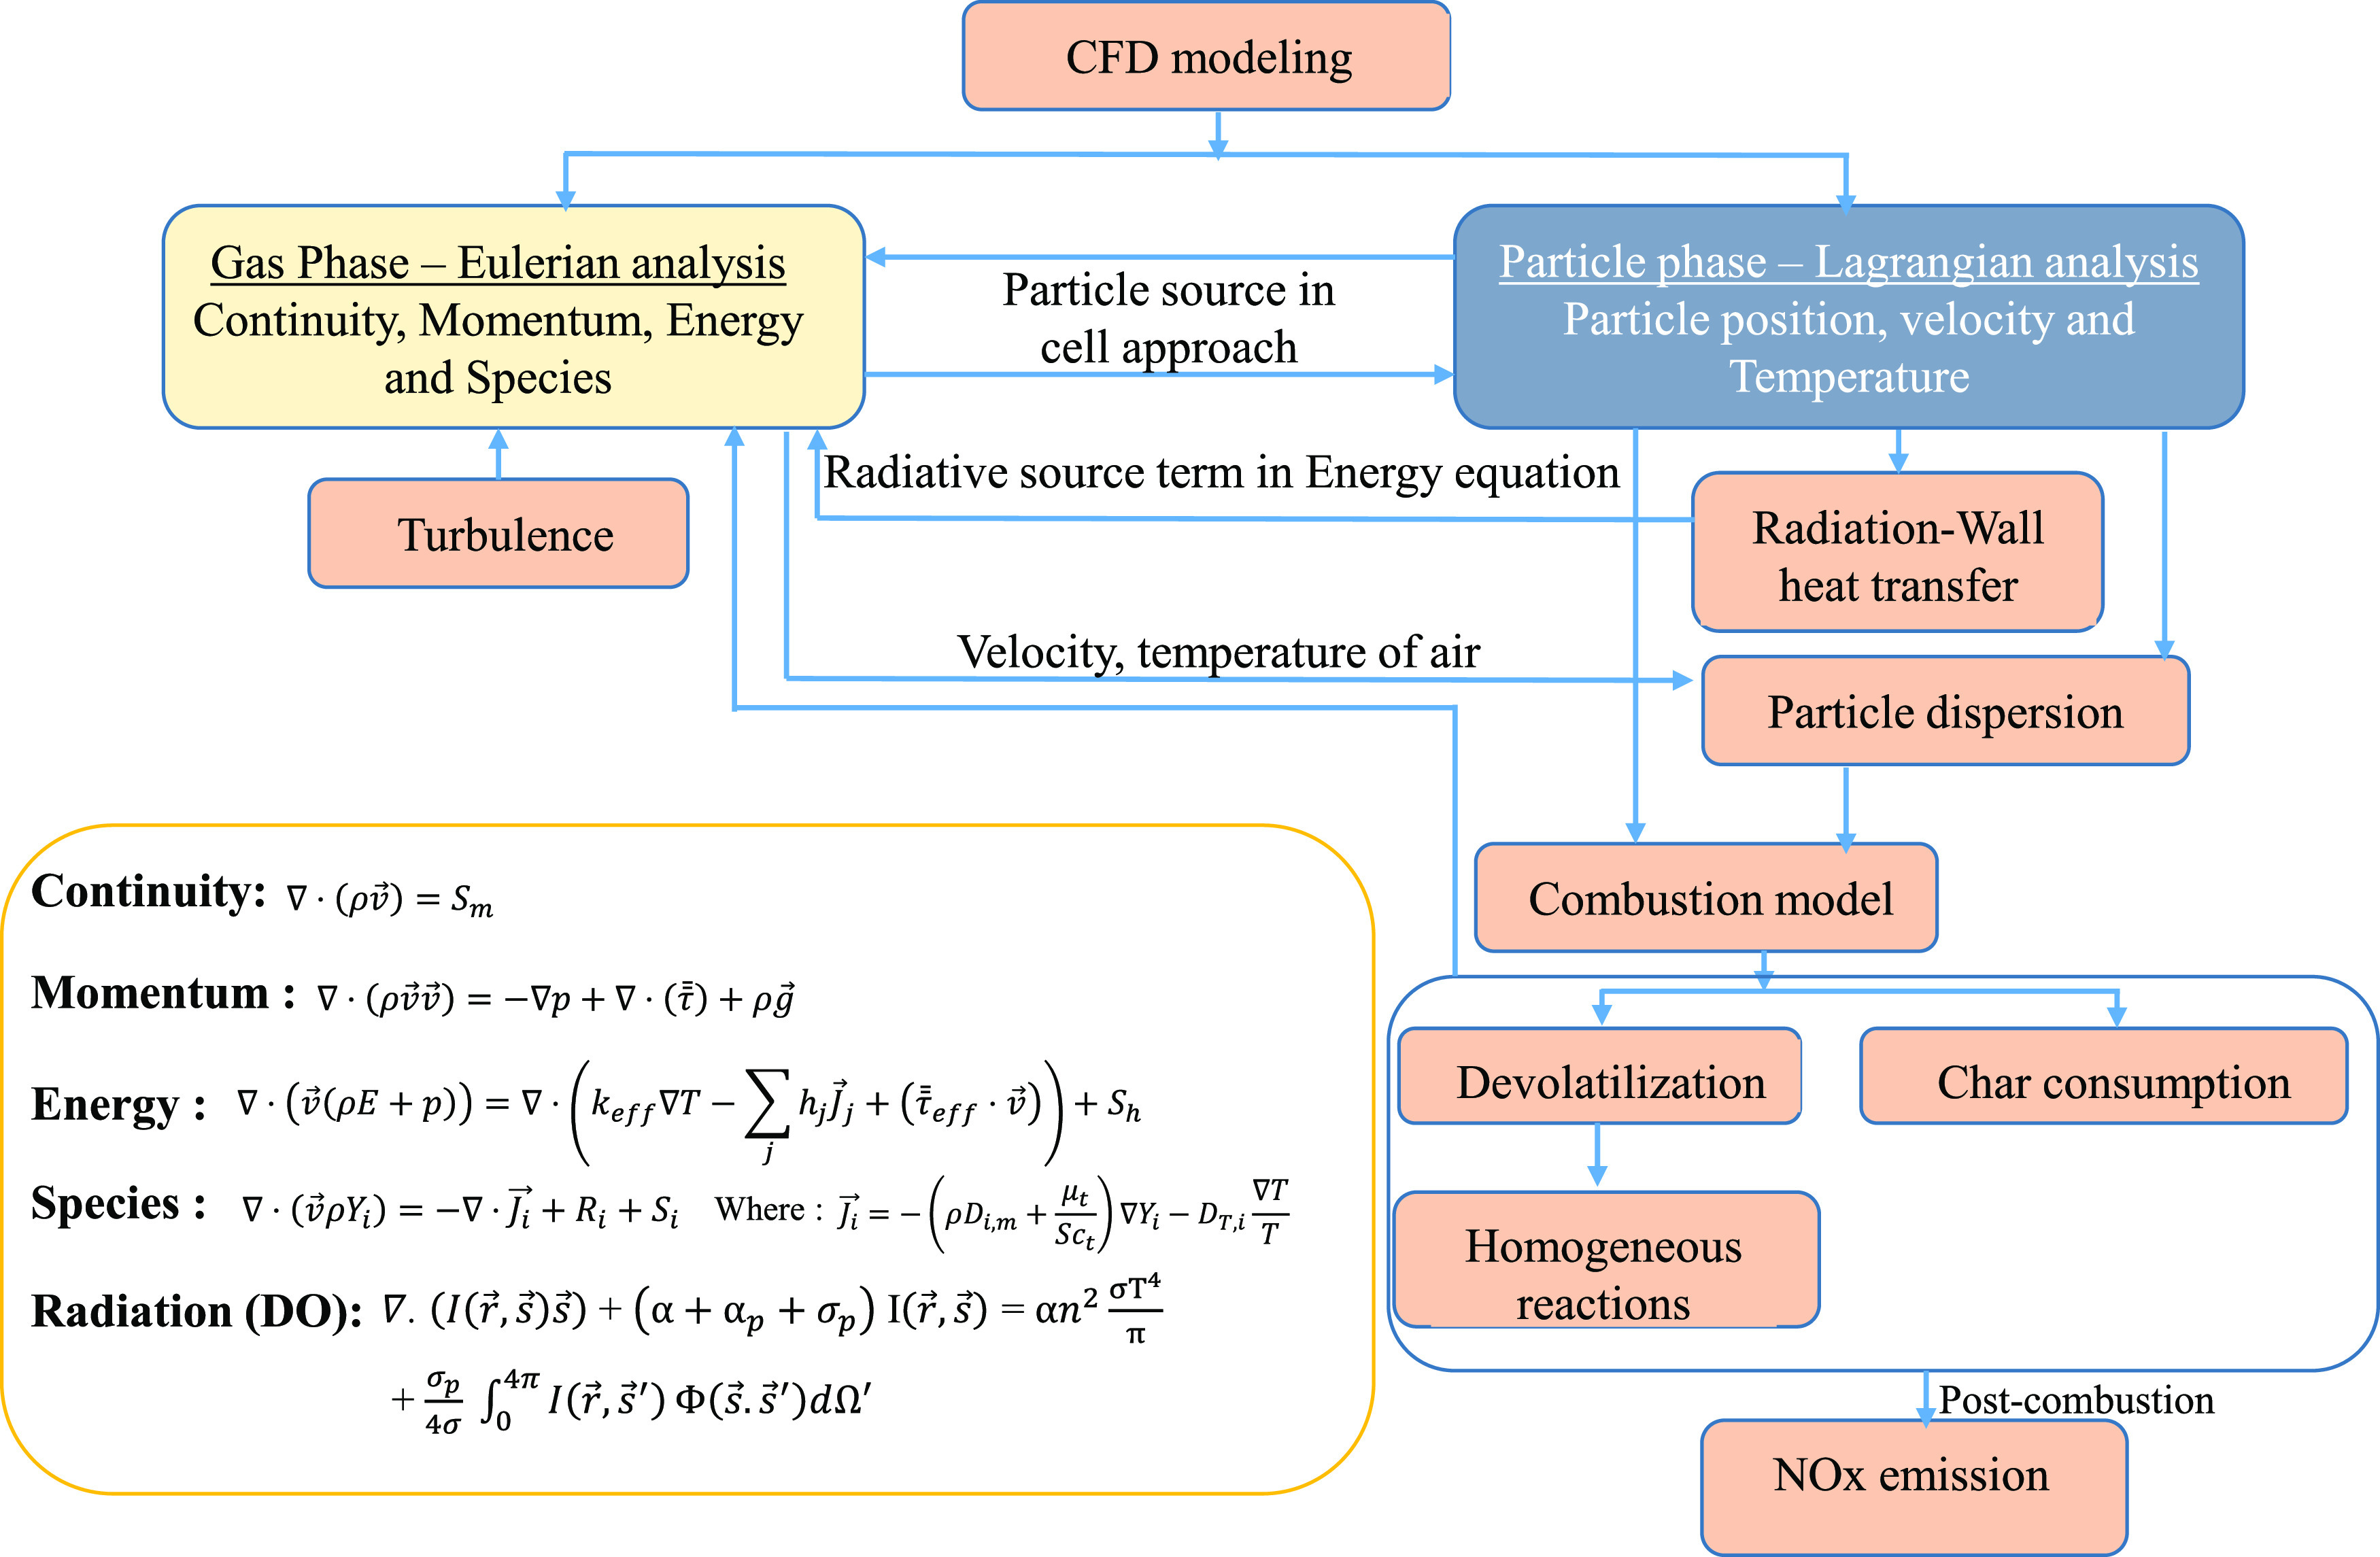
Combustion process of biomass in CFD.
The continuity equation is an expression of the mass conversion and can be expressed as follows
| 3 |
where ρ and v are the density and velocity of the fluid mixture. The mass source term Sm is the mass transferred from the solid-phase reactions to the continuous phase.
The conversion of momentum can be expressed as follows
| 4 |
where p, τ̿, and ρg⃗ are the static pressure, stress tensor, and gravitational body force, respectively.
The steady-state averaged energy equation is expressed as follows
| 5 |
where J⃗j and keff are the diffusion flux and effective conductivity of species, respectively. keff∇T is the conduction, ∑jhjJ⃗j is the species diffusion, and τ̿eff·v⃗ is the viscous dissipation. Sh comprises volumetric heat sources, including the heat of the chemical reaction and radiation and transfer between the continuous and discrete phases.
The k–ε equations in the realizable model are given by27
| 6 |
| 7 |
The transport conservation equation for all of the species in the chemical mechanism used in the simulation is
| 8 |
where the mass diffusion  in the
turbulence flows of species i can be determined as
follows
| 9 |
where Yi, Sct, μt, and DT,i are the local mass fraction of each species, turbulent Schmidt number, turbulent viscosity, and turbulent diffusivity, respectively. The net rate of species i production by chemical reaction is expressed as
| 10 |
where Mw,i and R̂i,j are the molecular weight of the species and Arrhenius molar rate of creation/destruction, respectively
| 11 |
where N and Ci,r are the number of chemical species and molar concentration, respectively. vi,r″ and vi,r denote the stoichiometric coefficient for the product and reactant, respectively. kf,r and kb,r represent the forward and backward rate constants, respectively. ηj,r′ and ηj,r are the reaction rate exponents for the reactant and product species, respectively. The net rate of the species production is calculated as follows
| 12 |
The discrete ordinate (DO) radiation model for the radiation and energy coupling option simultaneously solves the energy and intensity equations in each cell in the radiation model. This approach accelerates convergence and can be used with the gray or nongray radiation model. The weighted-sum-of-gray-gas model (WSGGM) computes radiative heat transfers for gas mixtures while considering specific absorption bands. Absorption coefficients can be used to calculate the emissivity for CO2 and H2O mixtures. The absorption coefficient (1/m) was used to set the WSGGM-domain-based. Discrete ordinate models were used to simulate the radiation heat transfer effects, with the particle emissivity and scattering coefficient set to a value of 0.8. The absorption coefficient of the gas was obtained using a weighted-sum-of-gray-gas model. The specific heat capacity, thermal conductivity, and viscosity of O2, CO2, water vapor, CO, SO2, and N2 properties were considered by the fourth-order polynomials of temperature.27−30
The Lagrangian discrete phase is described in Ansys Fluent, and the dispersed phase can be solved by tracking the number of particles. The particle–particle interactions were neglected, while the dispersed phase had a low volume fraction compared to the fluid phase. Integrating the force balance, such as gravitational, buoyancy, and drag forces, greatly influenced the biomass particle motion, as expressed below
| 13 |
where
ρ, u, and μ
are the density, velocity, and viscosity of the fluid phase, respectively. dp and ρp represent the particle
diameter and density of the SY biomass particle, respectively. The
relative Reynolds number can be written as  . CD is the
drag coefficient for nonspherical particles that were developed by
Haider and Levenspiel.
The motion of the biomass particles owing to turbulence (including the effect of instantaneous turbulent velocity fluctuations on the particle trajectories) can be predicted using the stochastic tracking model. Here, the trajectories of each particle were predicted using the mean fluid phase velocity (u̅) and the instantaneous value (u′) of the fluctuating gas flow velocity (u = u̅ + u′). The turbulent dispersion of particles along the particle path was integrated by the trajectory equations for individual particles. For several tries (representative particles), the random effects of turbulence on the particle dispersion can be included.
3.2.2. NOx Mechanism
Generally, NOx pollutant emission is predicted using two mechanisms for thermal and fuel NOx formation/destruction. The thermal NOx rate is significantly increased at temperatures greater than 1800 K, where the strong N2 triple bond is broken.27 The reactions of the thermal NOx were determined using the extended Zeldovich mechanism with partial-equilibrium assumptions for O and OH models.31 The fuel-N content depends on its fuel structure and is analyzed using the distribution between the volatile-N and char-N. Thus, a parameter ratio γ as a fraction of char-N and fuel-N was calculated based on the research.32 In this study, the parameter γ of the SY biomass was 0.239. For tracking the nitrogen-containing biomass, most of the volatile-N released intermediate species of HCN and NH3. They were set at 1:9 for the conversion ratio of HCN to NH3, whereas the char-N was released as NO. The generated intermediate species formed either NO in the fuel-lean zone or N2 in the fuel-rich zone based on the reaction process position.16 The reduction of NOx can occur in a reaction of NOx-containing char particles.33 One important factor in the reburning process is the pore surface area of the char biomass particle. The Brunauer–Emmett–Teller (BET) pore surface for the SY biomass sample was 392.13 m2/g. It was performed in a Micromeritics ASAP 2020 physisorption analyzer in a N2 environment.
4. Results and Discussion
4.1. Validation of Model and Testing Different Cases
The comparison was presented at the boiler exit as well as the heat flux of the heat exchanger for the reference case, as portrayed in Tables 2 and 3.
Table 2. Comparison between the Measured and CFD Results at the Boiler Exit for the SY Sample for the Reference Case.
| parameters | measured data | simulation data | error, % | |
|---|---|---|---|---|
| O2 (% dry) | 2.60 | 2.62 | 0.02% | |
| flue gas temperature (K) | 628 | 623 | 5 K | |
| NOx emission (ppm, 6% O2) | 118 | 116 | 2 ppm | |
| UBC (wt %) | fly ash | 1.58 | 1.54 | 0.04% |
| bottom ash | 41.50 | 40.71 | 0.79% | |
Table 3. Comparison between the Heat Absorption of the Measured and CFD Results in Relation to the Heat Exchangers for the Reference Case.
| parameters | measured data | CFD | errora | |
|---|---|---|---|---|
| heat absorption (MW) | evaporator and boiler bank | 158.1 | 158.6 | 0.31% |
| platen | 21.4 | 20.6 | 3.73% | |
Error = abs (CFD - measured) × 100/measured.
The simulation results were compared to the available field test results to verify kinetic data and the inlet parameters of the samples. Hence, the kinetic parameters and selected submodels were reliable for the further analysis of the combustion stability and NOx emission of the biomass boiler. The numerical solution, similar to the pressure–velocity coupling, under the relaxation factor, is presented in Table 4.
Table 4. Solution Methods.
| pressure–velocity coupling | SIMPLE |
|---|---|
| Spatial Discretization | |
| gradient | Green–Gauss node-based |
| pressure | PRESTO! |
| turbulent, species, and energy | QUICK |
| momentum and discrete ordinates | second-order upwind |
| Under-Relaxation Factors | |
| momentum | 0.4 |
| turbulent | 0.5 |
| species | 0.99 |
| energy | 0.6 |
| discrete ordinates | 0.9 |
| discrete phase sources | 0.2 |
To study the optimal conditions for both char burnout and NOx emission, six cases were considered in the CFD simulation for adjusting the air operating conditions of the boiler after validation using the reference case. Case R is the reference case that is based on the actual operating conditions (Table 5). The total air required for case R was 105.91 kg/s of combustion air with excess air of 15%. This includes 20, 40, and 25% of primary, secondary, and tertiary air, respectively, and 15% of total over-fired air (OFA). The combustion process is influenced by the interaction of available oxygen and fuel,34 which affects the char burnout and NO emission in the furnace zone, particularly in the burner zone. To evaluate this interaction, the effect of air distribution between the secondary and tertiary air was conducted. The adjustment of the secondary air ratio from 30% in case 1 to 40% in case R and to 50% in case 2 of total air was implemented (Table 6). Holtmeyer et al.35 compared different biomass particle sizes and their effects on the flame structure and length. The results showed that an increase in the volatile fraction resulted in an increase in the flame length near the burner zone. This further had a considerable effect on the thermal-NO formation. In this study, the biomass particle input with a wide range of particle size distribution and input position was influenced by the burnout time of each particle size and char burnout. Therefore, the position of the burner standby or burner active (Table 6) is considered, such as BNR A standby (A standby) (case 3), BNR B standby (B standby) (case R), BNR C standby (C standby) (case 4), and BNR D standby (D standby) (case 5), which is known to be effective in the reduction of fuel NOx formation and increasing high char conversion.
Table 5. Operating Conditions of the Reference Case.
| input conditions | values/description |
|---|---|
| biomass inlet, kg/s | 20.0508 kg/s through 12 primary ports |
| operating conditions | total air inlet for each burner 8.8254 kg/s with excess air 15% and primary/secondary/tertiary/OFA ratio = 20/40/25/15%. |
| Three burner rows A, C, and D active and B standby |
Table 6. Operating Conditions at Six Cases.
| case | OFA, % | PA, % | SA, % | description |
|---|---|---|---|---|
| thermal input | 395.27 MWth (constant) | |||
| R | 15 | 20 | 40 | burner B standby |
| ARA:ARC:ARD (1:1:1) | ||||
| 1 | 15 | 15 | 30 | influence of secondary air ratio |
| 2 | 15 | 25 | 50 | burner B standby |
| 3 | burner A standby | |||
| ARB:ARC:ARD (1:1:1) | ||||
| 4 | 15 | 20 | 40 | burner C standby |
| ARA:ARB:ARD (1:1:1) | ||||
| 5 | burner D standby | |||
| ARA:ARB:ARC (1:1:1) | ||||
4.2. Influence of Secondary Air Ratio on Char Conversion and NOx Emission
The influence of the secondary air was considered under burner B row standby conditions. The primary air and sample from the three rows of the swirling burners were fed into the boiler furnace, as shown in Figure 5. The opposing jets of the flame on each side of the wall furnace formed a cone fireball. The swirling air caused a stagnant vortex flow in the boiler furnace, thereby resulting in large biomass particles falling off the hopper owing to gravity.
Figure 5.
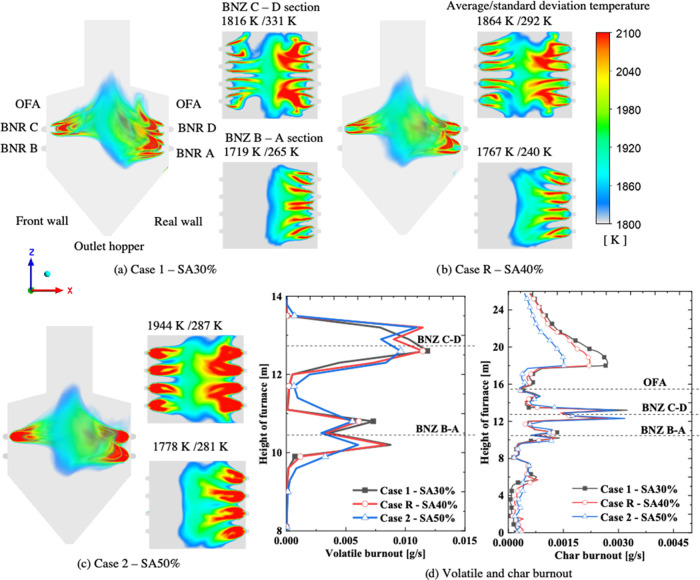
High-temperature contour and average and deviation temperatures in the horizontal cross section for (a) case 1-SA30%, (b) case R-SA40%, (c) case 2-SA50%, and (d) the volatile and char burnout rates.
Because the secondary air distribution uses mixed airflow and biomass in the burner, the adjustment of the secondary air ratio from 30 to 50% mass flow rate of total air was evaluated. The ratio of the primary and secondary air (0.5) and that of the over-fire air (15%) was consistent. Figure 5 presents the temperature distribution above 1800 K at a different secondary air ratio (SAR) under a similar burner stoichiometric ratio of 0.978. These results are consistent with the research of Panahi et al.,36 and the envelope flame temperatures of volatile matter release were in the range of 1800–2100 K. The particle envelope high flame temperatures (Figure 5) correspond with the volatile combustion. Although the air ratio of the burner zone was consistent (0.978), the temperature near the burner was considerably different as SAR increased. A relatively high-temperature region near the burners merged slightly as SAR increased. This is why the secondary air is mixed with more biomass when SAR increases, which enhances combustion in nearby burners. Hence, the ignition of the biomass may be rapid.
The swirling flame, also known as the vortex flame, creates a vortex by mixing the primary and secondary/tertiary air and fuel together. The swirl has a stabilizing role in the flame. The vorticity magnitude (ω) can be formulated as ω⃗ = ∇⃗ × u⃗ to represent the swirl intensity in both swirls in the horizontal burner cross sections.37 The numerical results for the horizontal cross sections of the BNR C–D level and BNR B–A level are presented in Table 7. As SAR increased, the vorticity magnitude increased from 34.2 to 181.0 1/s at the BNR C–D level and from 17.0 to 130.5 1/s at the BNR B–A level, thereby implying a more rotational (curl) flow velocity. As more air and fuel inputs were introduced, ω increased (34.2 1/s compared to 17.0 1/s in case 1).
Table 7. Vorticity Magnitude at the Horizontal Burner Cross Sections.
| position | Case 1-SA30%, 1/s | Case R-SA40%, 1/s | Case 2-SA50%, 1/s |
|---|---|---|---|
| BNR C–D level | 34.2 | 141.8 | 181.0 |
| BNR B–A level | 17.0 | 101.1 | 130.5 |
For more analysis, the average temperature and standard deviation in the cross section are expressed as
| 14 |
A remarkable average temperature was recorded in the horizontal cross sections of the BNR C–D and BNR B–A levels. At the higher levels, the average temperature increased owing to the introduction of more biomass samples (e.g., 1719 K compared to 1816 K in case 1-SA30%) and an increased combustion intensity. At the upper burner BNZ C–D cross section, the standard deviation temperature decreased as secondary air increased, such as 331, 292, and 287 K for SA30, SA40, and SA50%, respectively. In the case of SA40%, the standard deviation temperatures were 240 K at the BNR B–A level, which is lower than those in other cases. At the BNR C–D level, these values were 292 K, which is lower than that of case 1 (331 K) and nearly similar to that of case 2 (287 K). This reveals that the best mixing of the air and biomass occurred in case 40% (case R).
Figure 6 shows the actual particle char conversion dependency on the PSD of 13 size fractions at the outlets. Particles with sizes below 665 μm were released using char conversion higher than 96.55% at the boiler outlet and the complete burnout (100%) of the bottom ash in all of the cases. At the bottom outlet, the char burnout at the bottom decreased as SAR increased, which is preferable. The increase in SAR was predictable in low char conversion or high unburned carbon. With regard to char conversion at the boiler outlet, the trend was different. Overall, the char conversion of SA30% and SA50% was higher than in case R. In summary, the average char conversion at the hopper and boiler outlet is compared in Table 8.
Figure 6.
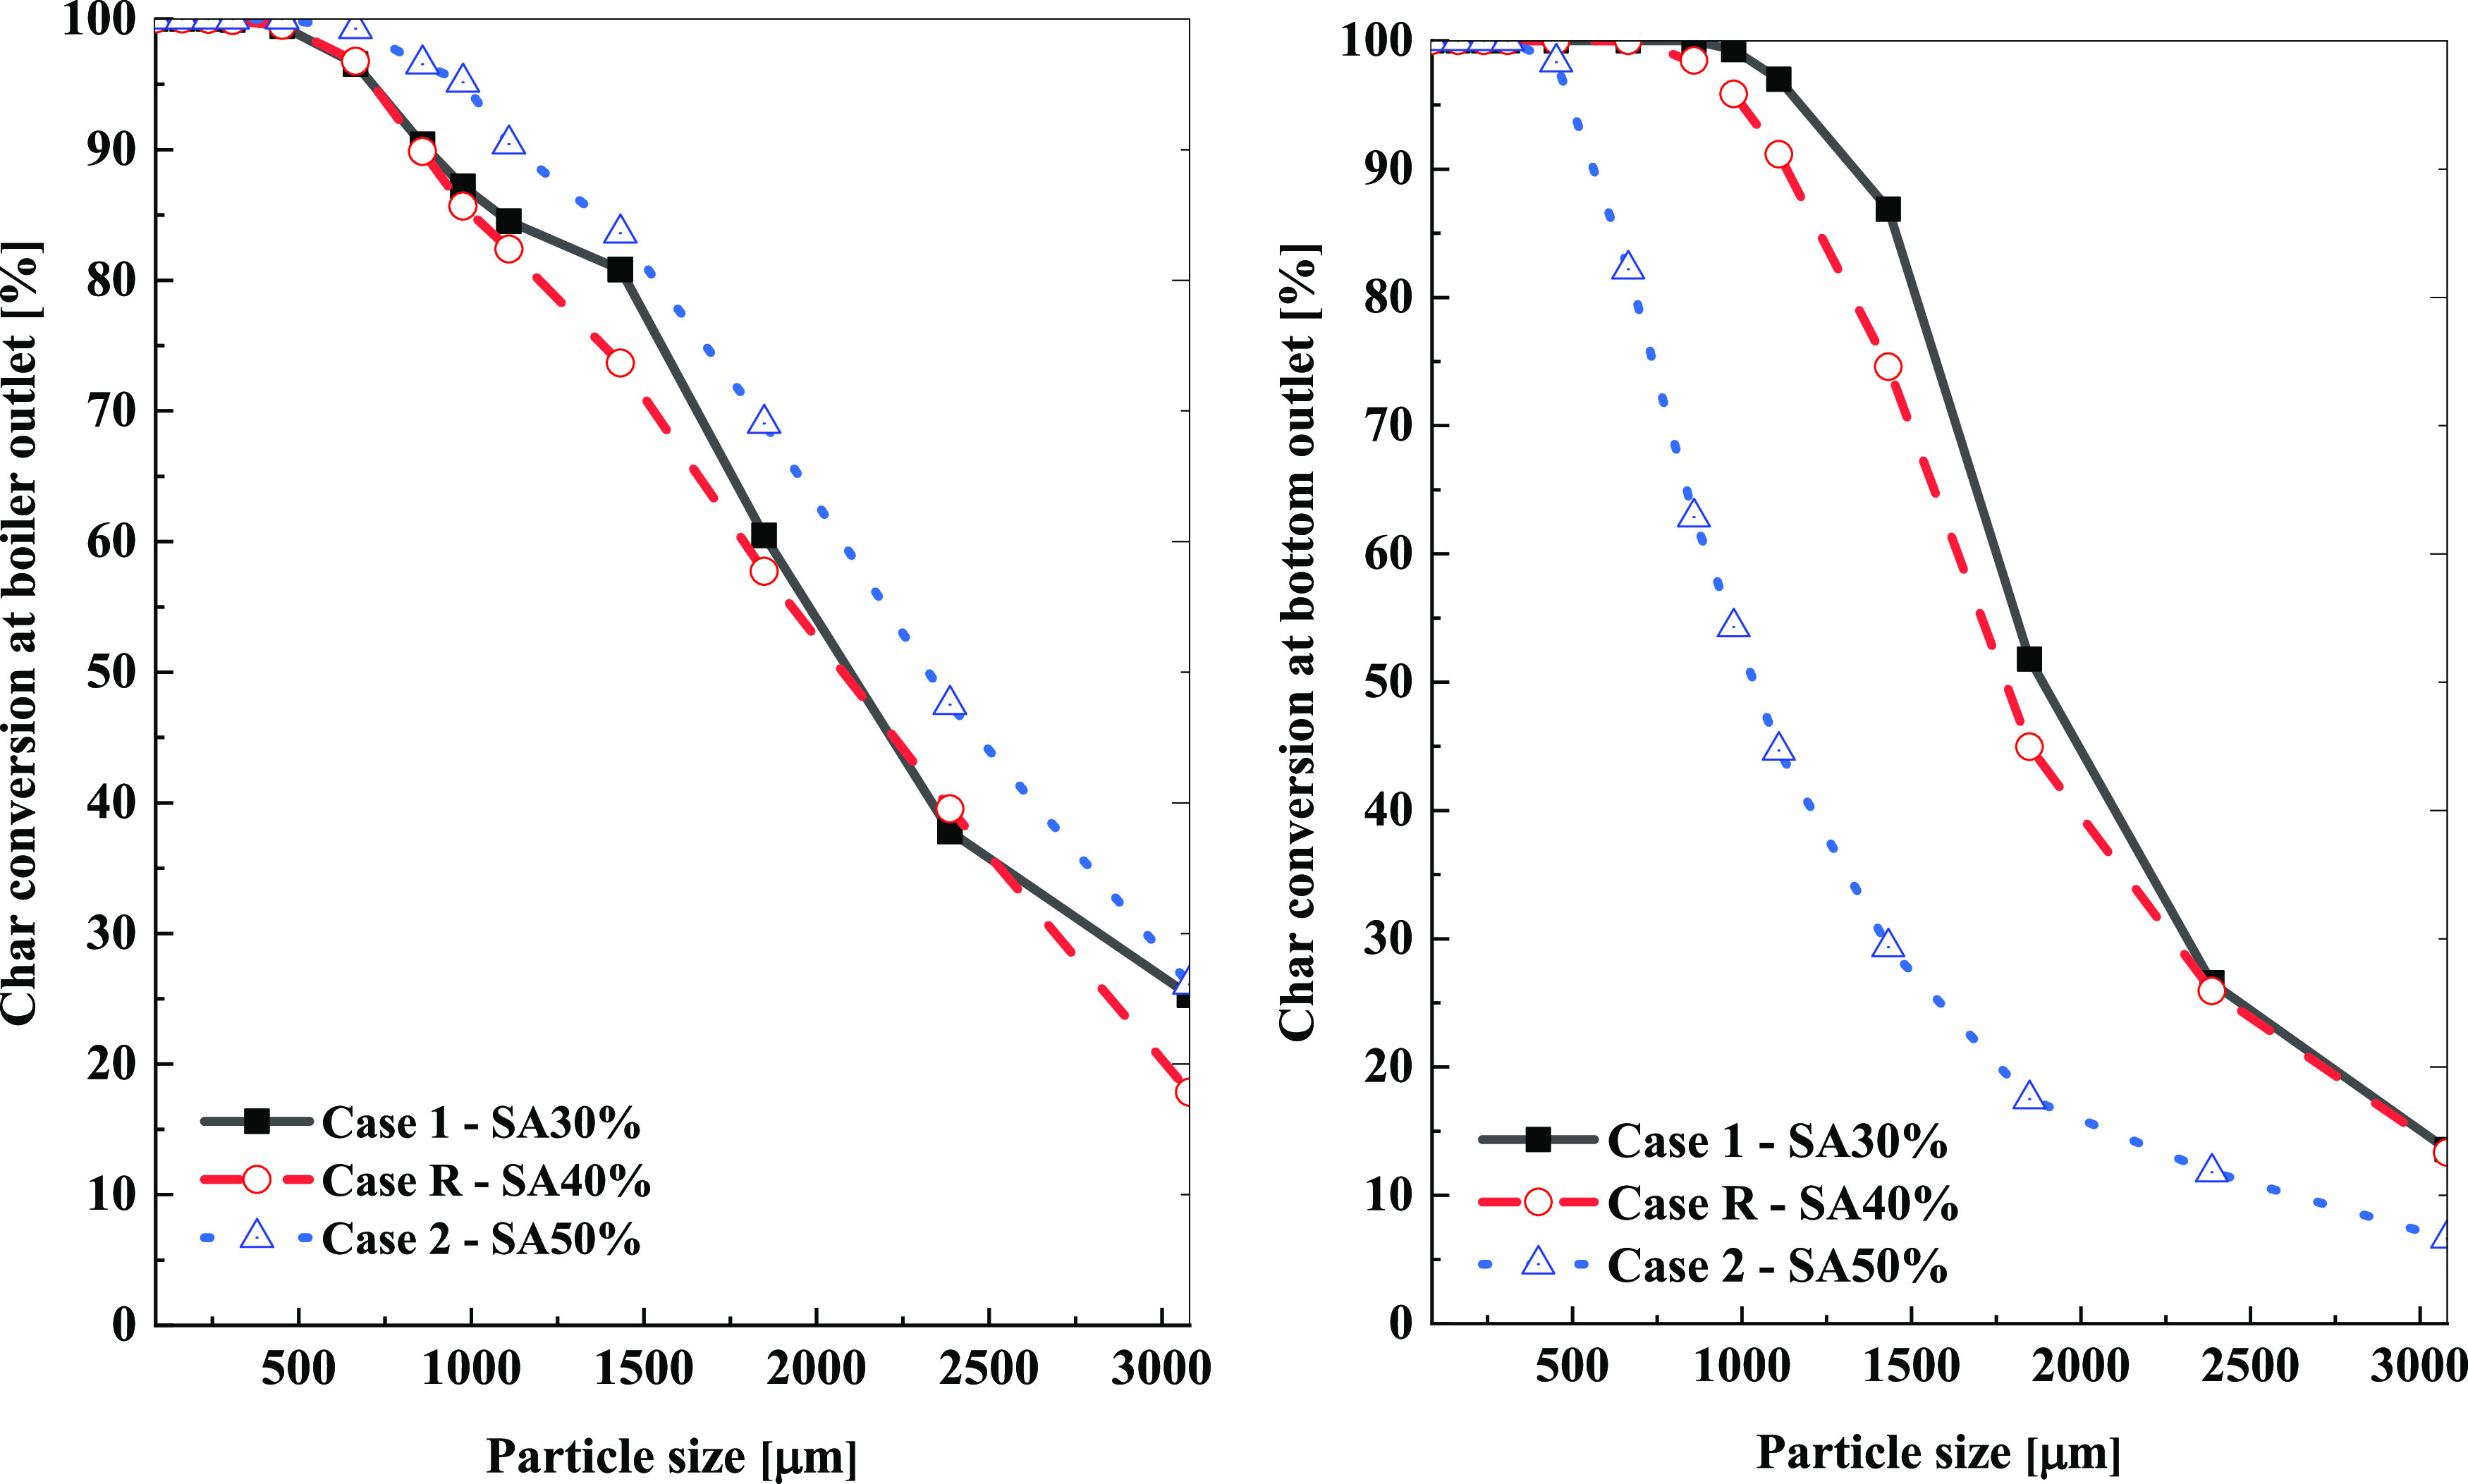
Char conversion at the exits of each particle size depending on the SAR change.
Table 8. Overview of the Results under the Secondary Air Ratio Effects in Relation to the Key Parameters at the Exit of the Biomass Boiler.
| parameters | Case 1-SA30% | Case R-SA40% | Case 2-SA50% | |
|---|---|---|---|---|
| O2 (% dry) | 2.62 | 2.62 | 2.64 | |
| flue gas temperature (K) | 642 | 623 | 586 | |
| NOx emission (ppm, 6% O2) | 141 | 116 | 90 | |
| UBC (wt %) | fly ash | 1.50 | 1.54 | 0.76 |
| bottom ash | 35.41 | 40.71 | 59.99 | |
| bottom ash release | 269 kg/h | 247 kg/h | 402 kg/h | |
| char conversion | 97.36 | 97.33 | 97.16 | |
As shown in Figure 7, the NOx emission characteristics, such as the rate of the thermal formation, formation/reduction of fuel NOx, and intermediate species, were evaluated separately. The plus and minus symbols in Figure 7b are used to denote the formation and reduction, respectively. The thermal NOx formation depends on the gas temperature and was observed in the increase of the flames (Figure 7a). The fuel NOx rate was similar to the oxygen and volatile/char content combustion rate. The volatile-N of the biomass was converted into NH3 at a higher rate than HCN near the burner region. Figure 7b shows the average volume rate of NOx based on the formation of thermal NOx and the formation/reduction of the fuel NOx of zones below and above the OFA ports. Case R (SA40%) recorded the lowest NOx formation at the zone combustion (hopper and furnace zone) with 2.5538 × 10⁻⁴ mol/m3 s. In case R, the thermal NOx formation and fuel NOx reduction were the lowest. Further, air from the OFA port was injected into the boiler. The value of the thermal NOx in all of the cases was very small compared to the fuel NOx reduction. Hence, this zone was responsible for the reduction. The NOx reduction in SA50% was higher than that of SA40% in this zone. This is one of the reasons why the NOx emission at the boiler outlet in case 2 was lower than that in case R.
Figure 7.
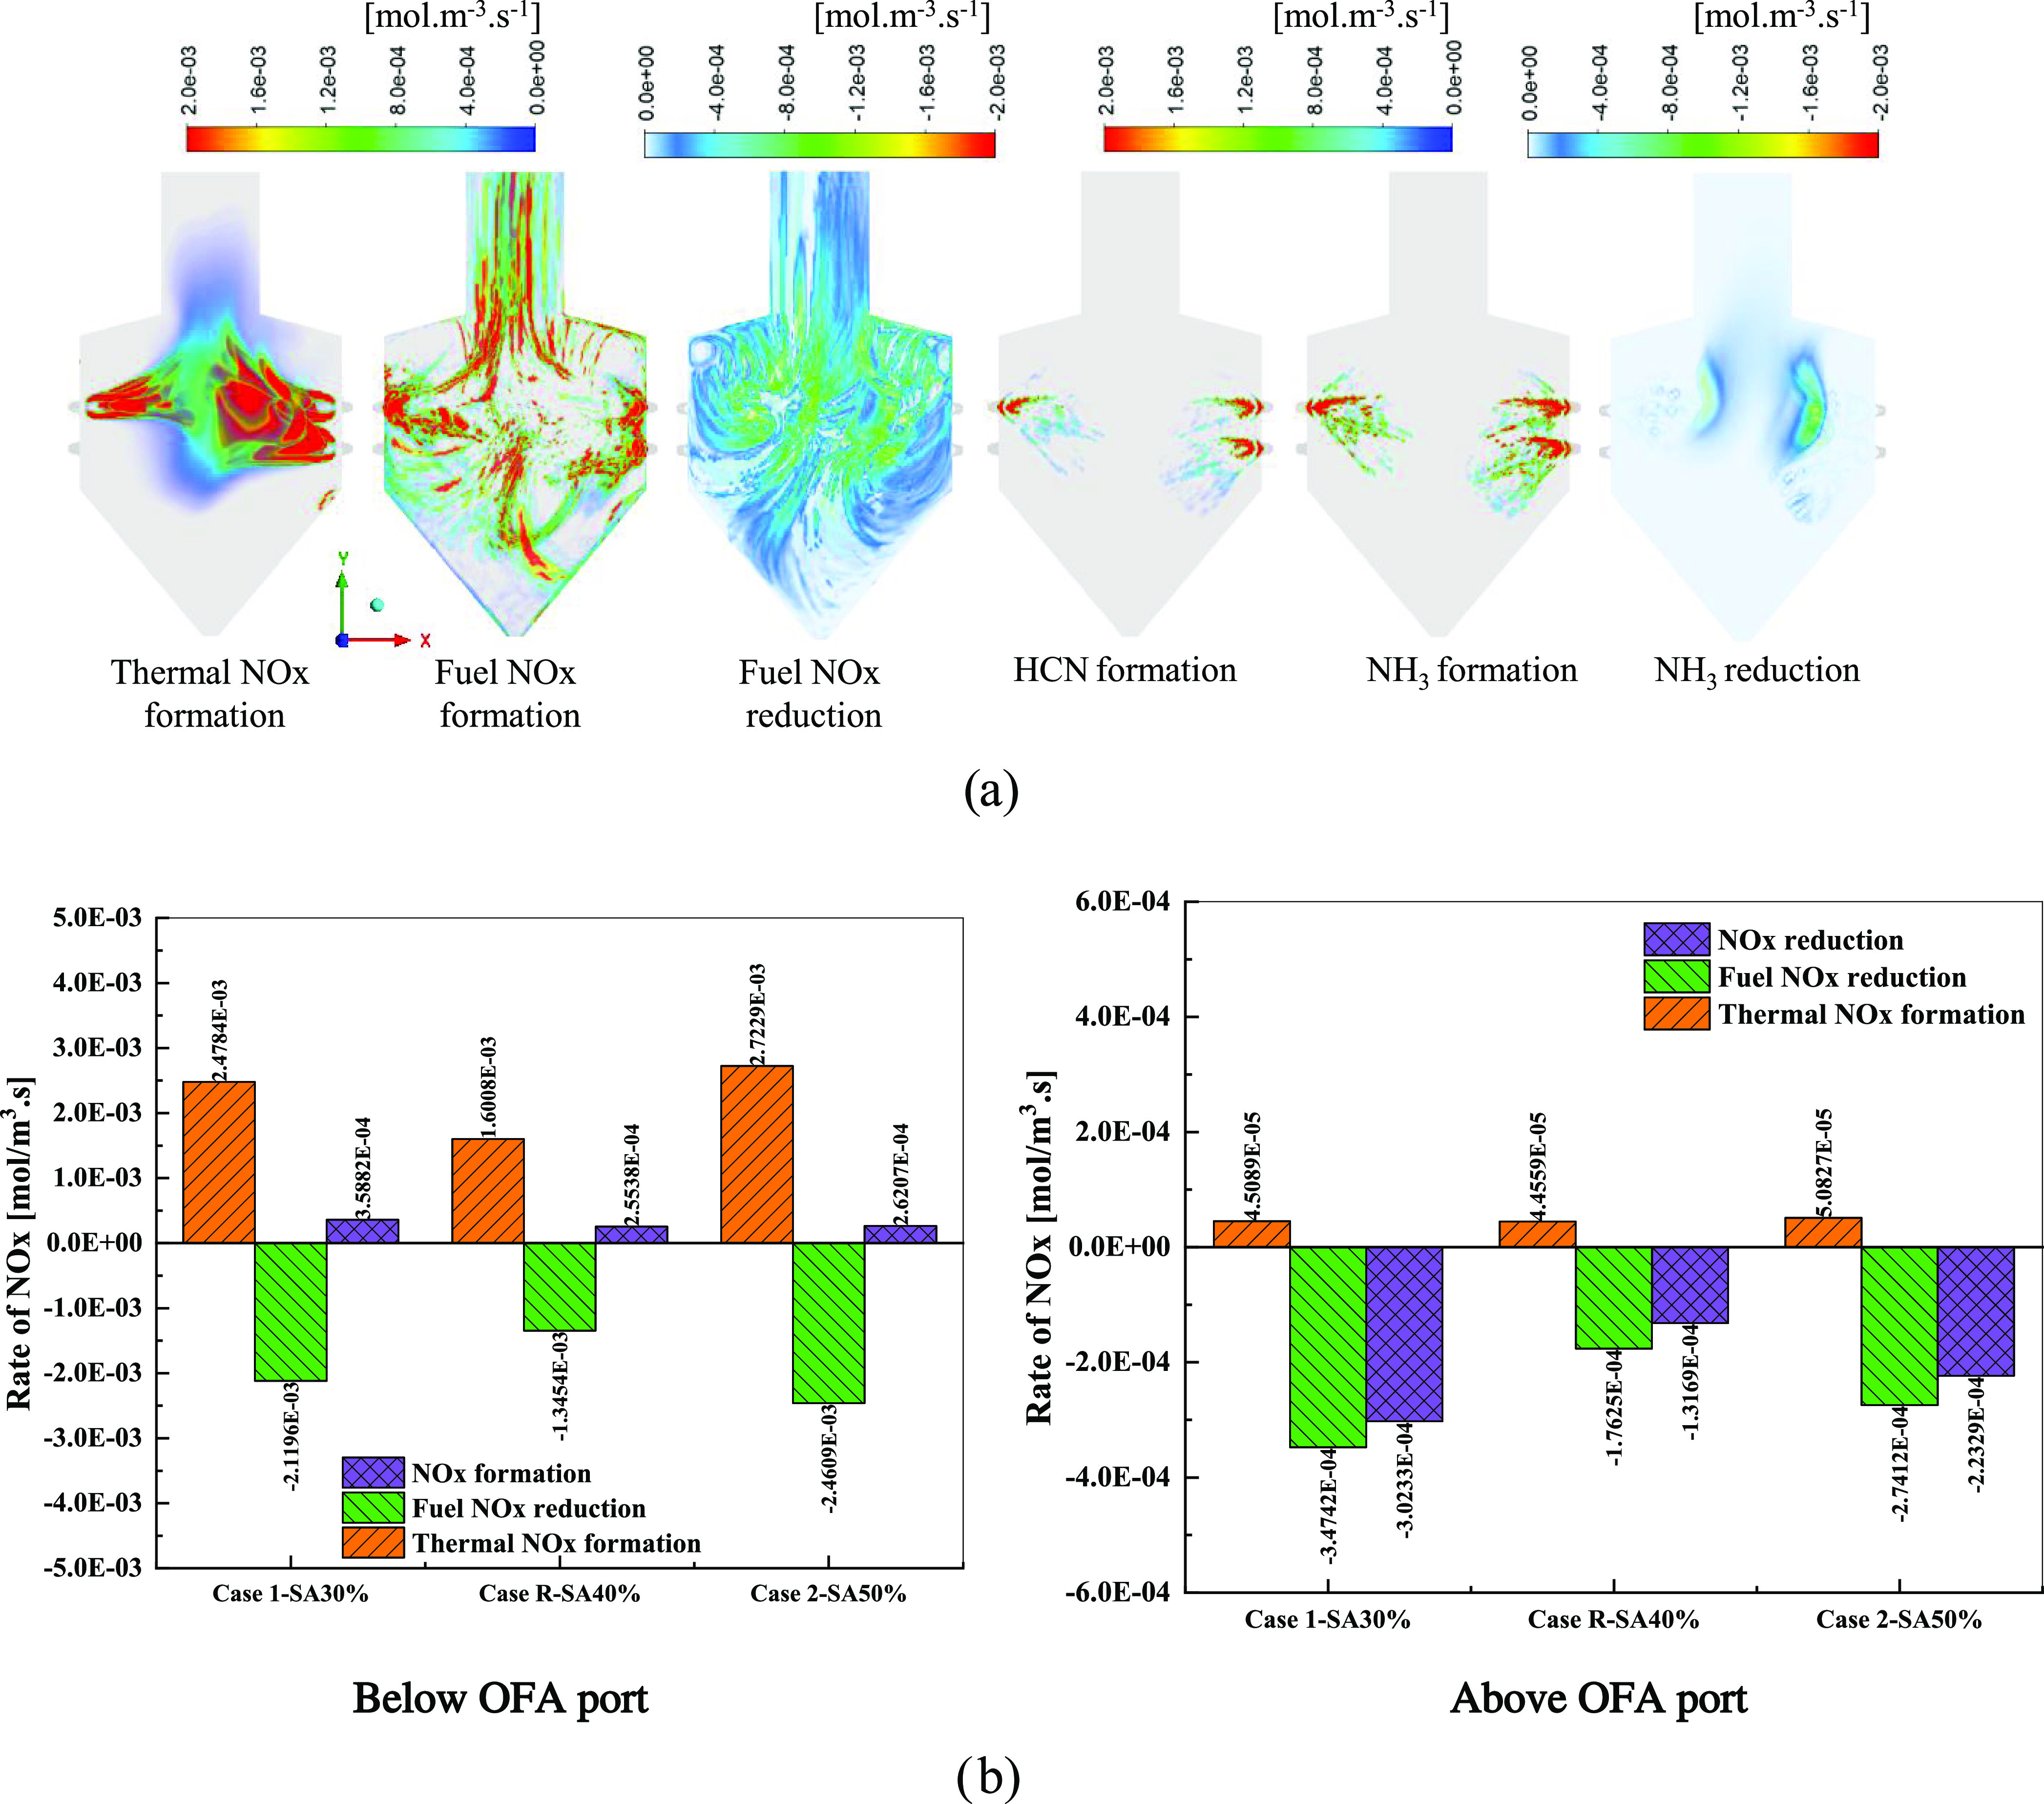
(a) Contour of the thermal NOx formation rate, fuel NOx formation, fuel NOx reduction, HCN, NH3 formation, and NH3 reduction at the reference case. (b) Average volume rate of NOx below and above the OFA port depending on the change in the SAR.
Table 8 presents an overview of the unburned carbon at the boiler outlet, bottom hopper, and NOx emission at the boiler outlet. With the increase in SAR from 30 to 50%, the mass ash at the hopper significantly decreased to 247 kg/h for case R and 269 kg/h for case 1 (SA30%) and 402 kg/h in case 2 (SA50%). The carbon content in fly ash was 1.50% for case 1 and 1.54% for case R, which was higher than that for case 2 (0.76%). However, unburned carbon at the bottom outlet was considerably higher in case 5 at 59.99%, higher than 40.71% in case R and 35.41% in case 1. These changes were responsible for the char conversion, which had a high value of 97.33% in case R (SA40%), 97.36% in case 1 (SA30%), and a slightly reduced value in case 2 (97.16%). Meanwhile, NOx emission at the boiler outlet in case 1 (141 ppm) was higher than that in case R (116 ppm) and case 2 (90 ppm). Based on char conversion and NOx emission in the three cases, the optimal condition for adjusting the secondary air was at 40% in case R. Consequently, the inlet condition in each burner of case R was compared to the burner standby position.
4.3. Comparative Analysis of Burner Standby Conditions on Char Conversion and NOx Emission
The char conversion at the exits as shown in Figure 8 was compared based on the particle sizes (PS) of the four cases, including case A standby, case R or B standby, case C standby, and case D standby. Overall, the char conversion was approximately 100% because PS was lower than 665 μm for A standby, 453 μm for the boiler outlet in C standby, 309 μm for the bottom outlet, 976 μm for the boiler outlet in D standby, and 309 μm for the bottom outlet. Regarding the boiler outlet, the char conversion of each PS of A standby was higher than that of B standby, even though it was lower at the bottom outlet. In the C standby case, the char conversion was lower at the boiler outlet but higher at the bottom outlet when compared to case R. With D standby, the conversion of the char at the boiler exit was higher than in case R. At the bottom hopper, the char conversion of D standby with biomass particles ranging from 665 to 1109 μm performed differently. This fluctuation in the char conversion may be owing to the interaction between the air velocity of burners B and C on the particle trajectories from burner A. The particle residence time and trajectory depend on each particle size and separate active burner.24 The integration of the force balance, such as gravitational, buoyancy, and drag forces, greatly influenced the biomass particle motion.
Figure 8.
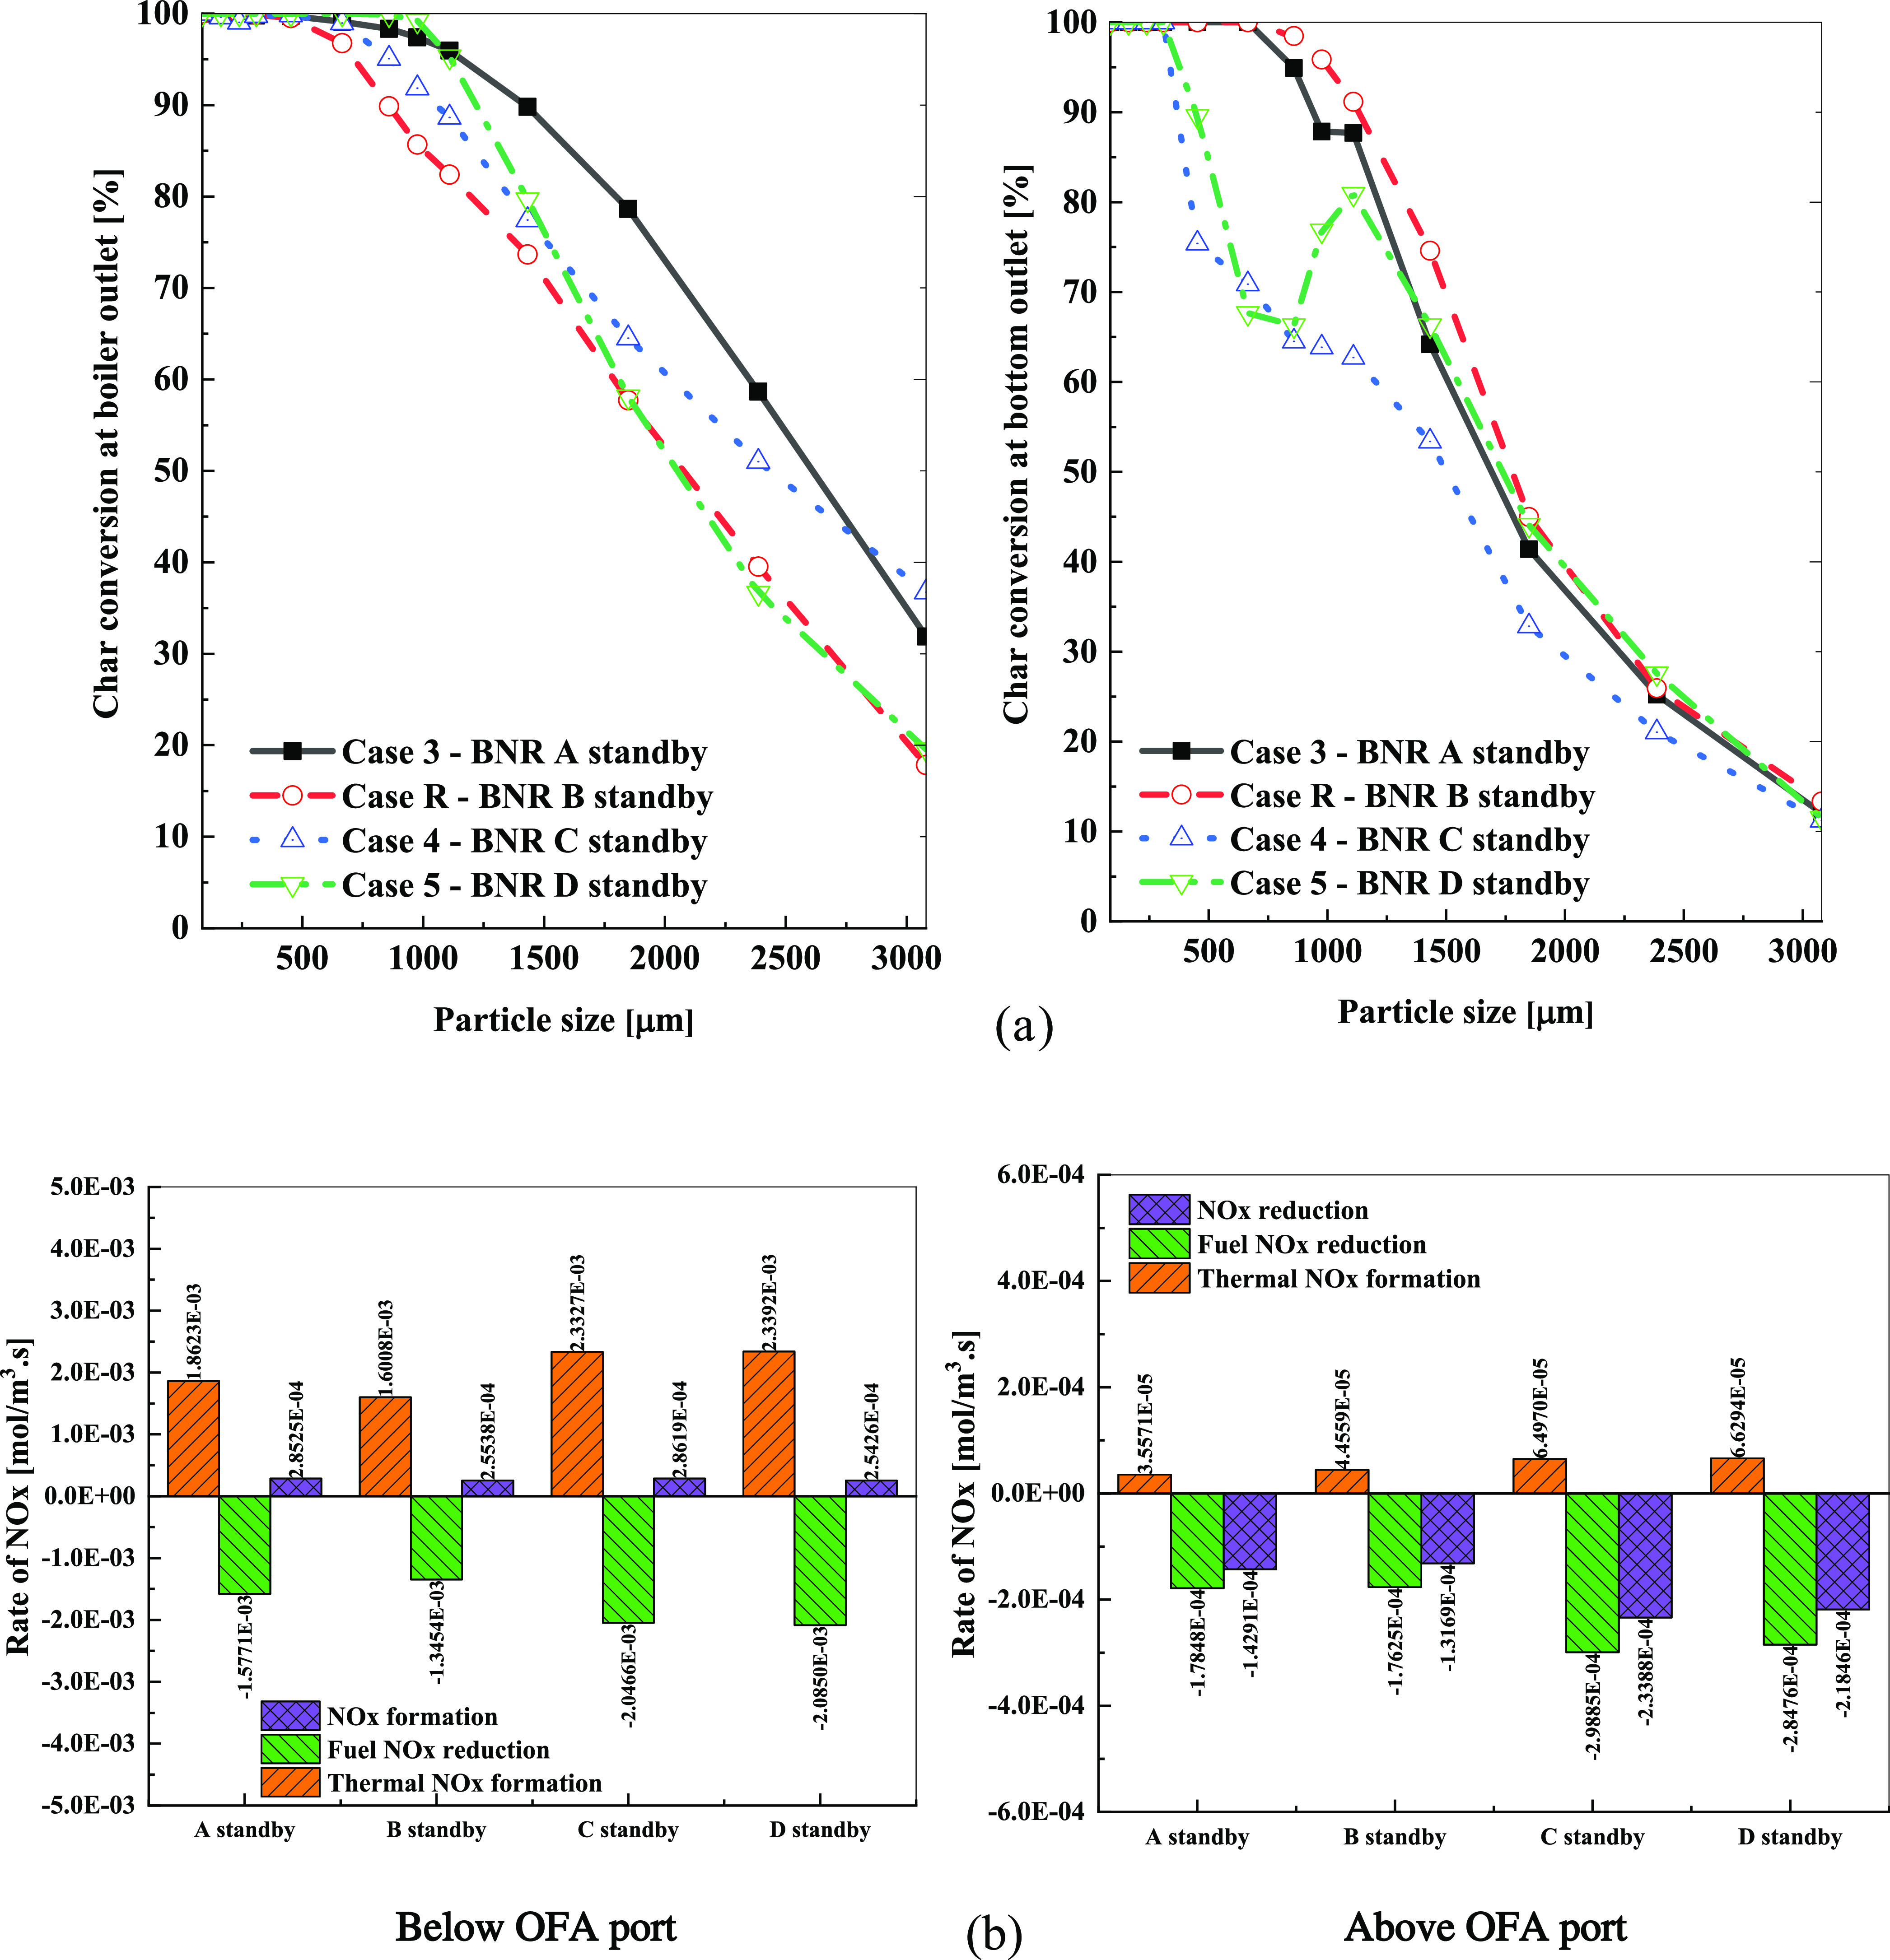
(a) Char conversion at the exits of each particle size based on the burner standby and (b) average volume rate of NOx below and above the OFA port based on the burners in standby.
Figure 8b compares the average volume rate of the NOx formation and reduction in the four cases. Regarding the volume below the over-fired air (OFA) port, the average value rates of the thermal NOx and fuel NOx of C and D standby at the furnace and hopper zone were slightly higher than those of B and A standby. There were no considerable differences between A and B standby and C and D standby. However, above the OFA port, the total NOx reduction of cases C and D standby was higher than that of A and B standby. This was at approximately 6.5 × 10⁻⁵ mol/m3 s for case BNR C and D standby compared to 4.45 × 10⁻⁵ mol/m3 s for case B standby and 3.56 × 10⁻⁵ mol/m3 s for case A standby. These results show why at the boiler exit, the NOx emission was low for cases C and D standby compared to those for A and B standby. This implies that the decrease in the NOx concentration in the four cases was owing to the heterogeneous and reburning reactions caused by the air injected through the OFA ports.
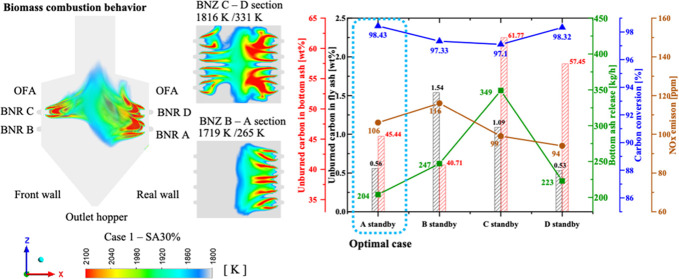
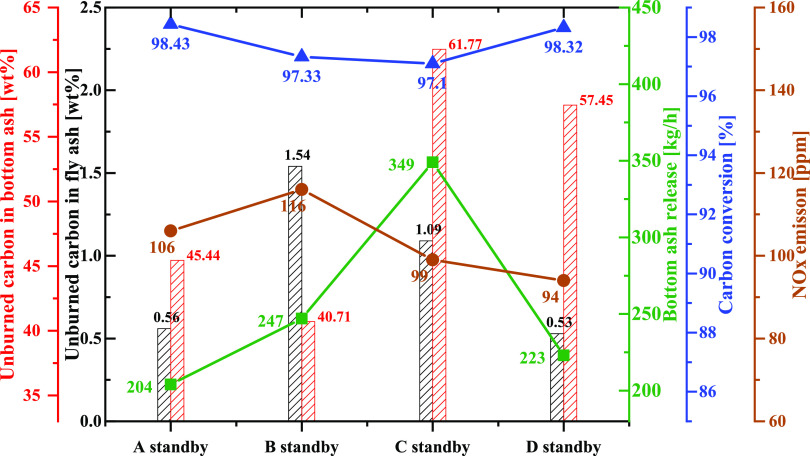
As shown in Figure 9, the key parameters of the boiler, such as UBC at the boiler outlet, bottom outlet, quantity of ash released at the bottom outlet, over char conversion, and NOx emission, were analyzed. The char burnout of the boiler, bottom ash release, and NOx emissions at the boiler outlet were evaluated to determine the optimum operating conditions in the boiler. As shown in Figure 9, there was approximately 94–116 ppm NOx emission at the boiler outlet. Hence, the position of the burner standby was unaffected by the NOx emission, which slightly changed between the cases. However, the bottom ash released at the bottom of the hopper in case C standby was the highest, with 349 kg/h. This was reduced to 247 kg/h in case R and 223 kg/h in case D standby, with the lowest being 204 kg/h in case A standby. At a similar height of the burner in standby, the UBC at the bottom ash was nearly similar (61.77% for case 4 compared to 57.45% for case 5 and 45.44% for case 3 compared to 40.71% for case R). However, the UBC in the fly ash was considerably affected by the burner standby position (1.54% in case R was more than 0.53% in case D standby and 0.56% in case A standby). These changes were responsible for the carbon conversion. Based on the combined effects of these variations, the carbon conversion had the highest value of 98.43% in case A standby and slightly reduced to 98.32 and 97.33% in cases D and B standby, respectively. The lowest was recorded in case C standby at 97.10%. From the comparison of these key parameters, there was a significant improvement in biomass burnout in case A standby.
Figure 9.
Overview of the results under the effect of the burner standby based on the key parameters at the exits of the biomass boiler.
5. Conclusions
In this study, we compared the char burnout and NOx mechanism in the real-scale biomass sample in six cases in relation to the influence of the secondary air ratio and location of the burner standby to find the optimization operation condition based on CFD models. The results are as follows:
-
(1)
Overall, the particle release at the hopper outlet with a low char conversion of 35–60% and high biomass ash at the hopper depended on the SAR and burner standby position in the pulverized biomass combustion.
-
(2)
Under the influence of SAR (from 30 to 50%), the best air and biomass mixture was 40% based on the results of the standard deviation temperature.
-
(3)
Furthermore, after comparing six cases based on the char conversion, ash bottom release, and NOx emission, the optimal scheme case was burner A standby with 40% SAR.
In the operation process, slagging and fouling effects on heat exchangers included wall evaporator, platen, and superheater. The ash deposition rate was performed under almost similar temperature conditions and ash particle trajectories to the heat exchanger. The relatively high-temperature propensity can aid in deposition difficulties encountered in biomass boilers. This study is also one of the steps to reduce the fouling and corrosion associated with the combustion of biomass fuels.
Acknowledgments
This research was supported by a grant from the National Research Foundation of Korea and funded by the Ministry of Science, ICT, and Future Planning (Grant No. 2022K1A4A8A01080312).
Author Contributions
V.T.T.: conceptualization, methodology, writing—original draft preparation, and writing—review and editing. B.-H.L.: review and editing. S.-M.K.: review and methodology. C.-H.J.: supervision.
The authors declare no competing financial interest.
References
- International Energy Agency. Net Zero by 2050: A Roadmap for the Global Energy Sector, 2021.
- International Energy Agency . World Energy Outlook 2021, 2021.
- International Energy Agency . Energy Policy Review Korea, 2020; Vol. 2020.
- International Energy Agency. Reforming Korea’s Electricity Market for Net Zero, 2021.
- Gouws S. M.; Carrier M.; Bunt J. R.; Neomagus H. W. J. P. Co-pyrolysis of coal and raw/torrefied biomass: a review on chemistry, kinetics and implementation. Renewable Sustainable Energy Rev. 2021, 135, 110189 10.1016/j.rser.2020.110189. [DOI] [Google Scholar]
- Horvat I.; Dović D.; Filipović P. Numerical and experimental methods in development of the novel biomass combustion system concept for wood and agro pellets. Energy 2021, 231, 120929 10.1016/j.energy.2021.120929. [DOI] [Google Scholar]
- Niemelä N. P.; Nowak Delgado R.; de Riese T.; Tolvanen H.; Fendt S.; Spliethoff H.; Joronen T. Fuel-specific devolatilization parameters for detailed comparison of pulverized biomass fuels. Fuel 2021, 286, 119309 10.1016/j.fuel.2020.119309. [DOI] [Google Scholar]; (accessed Oct, 2020).
- Schmid D.; Karlström O.; Yrjas P. Release of NH3, HCN and NO during devolatilization and combustion of washed and torrefied biomass. Fuel 2020, 280, 118583 10.1016/j.fuel.2020.118583. [DOI] [Google Scholar]
- Wu Z.; Wang S.; Zhao J.; Chen L.; Meng H. Thermochemical behavior and char morphology analysis of blended bituminous coal and lignocellulosic biomass model compound co-pyrolysis: effects of cellulose and carboxymethylcellulose sodium. Fuel 2016, 171, 65–73. 10.1016/j.fuel.2015.12.057. [DOI] [Google Scholar]
- Ferrara F.; Orsini A.; Plaisant A.; Pettinau A. Pyrolysis of coal, biomass and their blends: performance assessment by thermogravimetric analysis. Bioresour. Technol. 2014, 171, 433–441. 10.1016/j.biortech.2014.08.104. [DOI] [PubMed] [Google Scholar]
- Zhou A.; Xu H.; Tu Y.; Zhao F.; Zheng Z.; Yang W. Numerical investigation of the effect of air supply and oxygen enrichment on the biomass combustion in the grate boiler. Appl. Therm. Eng. 2019, 156, 550–561. 10.1016/j.applthermaleng.2019.04.053. [DOI] [Google Scholar]
- Lee B. H.; Shagdarsuren L.; Jeon C. H. Impact of pulverize coal particle sizes on combustibility an NOx emission in different Blending Methods. Energy Fuels 2019, 33, 12814–12821. 10.1021/acs.energyfuels.9b03164. [DOI] [Google Scholar]
- Sh L.; Lee B.; Jeong T.; Jeon C. Effects of different pretreatment methods on the grindability of pitch pine sawdust biomass and its blends with coal. J. Mech. Sci. Technol. 2020, 34, 2235–2243. 10.1007/s12206-020-0445-4. [DOI] [Google Scholar]
- Benim A. C.; Deniz Canal C.; Boke Y. E. Computational investigation of oxy-combustion of pulverized coal and biomass in a swirl burner. Energy 2022, 238, 121852 10.1016/j.energy.2021.121852. [DOI] [Google Scholar]
- Choi M.; Park Y.; Li X.; Kim K.; Sung Y.; Hwang T.; Choi G. Numerical evaluation of pulverized coal swirling flames and NOx emissions in a coal-fired boiler: effects of Co- and counter-swirling flames and coal injection modes. Energy 2021, 217, 119439 10.1016/j.energy.2020.119439. [DOI] [Google Scholar]
- Choi C. R.; Kim C. N. Numerical investigation on the flow, combustion and NOx emission characteristics in a 500 MWe tangentially fired pulverized-coal boiler. Fuel 2009, 88, 1720–1731. 10.1016/j.fuel.2009.04.001. [DOI] [Google Scholar]
- Díez L. I.; Cortés C.; Pallarés J. Numerical investigation of NOx emissions from a tangentially-fired utility boiler under conventional and overfire air operation. Fuel 2008, 87, 1259–1269. 10.1016/j.fuel.2007.07.025. [DOI] [Google Scholar]
- Hwang M.-y.; Kim S. M.; Kim G. B.; Lee B. H.; Song J. H.; Park M. S.; Jeon C. H. Simulation studies on direct ash recycling and reburning technology in a tangentially fired 500 MW pulverized coal boiler. Fuel 2013, 114, 78–87. 10.1016/j.fuel.2013.05.087. [DOI] [Google Scholar]
- Wang Q.; Chen Z.; Wang L.; Zeng L.; Li Z. Application of eccentric-swirl-secondary-air combustion technology for high-efficiency and low-NOx performance on a large-scale down-fired boiler with swirl burners. Appl. Energy 2018, 223, 358–368. 10.1016/j.apenergy.2018.04.064. [DOI] [Google Scholar]
- Chen Z.; Qiao Y.; Guan S.; Wang Z.; Zheng Y.; Zeng L.; Li Z. Effect of inner and outer secondary air ratios on ignition, C and N conversion process of pulverized coal in swirl burner under sub-stoichiometric ratio. Energy 2022, 239, 122423 10.1016/j.energy.2021.122423. [DOI] [Google Scholar]
- Song M.; Zeng L.; Zhao Y.; Pei J.; Li Z. Secondary air distribution in a 600 MWe multi-injection multi-staging down-fired boiler: A comprehensive study. J. Energy Inst. 2020, 93, 1250–1260. 10.1016/j.joei.2019.11.008. [DOI] [Google Scholar]
- Song M.; Zeng L.; Chen Z.; Li Z.; Kuang M. Aerodynamic characteristics of a 350-MWe supercritical utility boiler with multi-injection and multi-staging: effects of the inner and outer secondary air distribution in the burner. J. Energy Inst. 2018, 91, 65–74. 10.1016/j.joei.2016.10.007. [DOI] [Google Scholar]
- Jing J.; Zhang C.; Sun W.; An J.; Bi J.; Li Z. Influence of mass-flow ratio of inner to outer secondary air on gas-particle flow near a swirl burner. Particuology 2013, 11, 540–548. 10.1016/j.partic.2012.09.010. [DOI] [Google Scholar]
- Thieu Trinh V.; Kim S. M.; Kim K. M.; Lee B. H.; Jeong T. Y.; Son J. S.; Kim J. M.; Jeon C. H. In-depth numerical analysis of combustion and NOx emission characteristics in a 125 MWe biomass boiler. Fuel 2023, 332, 125961 10.1016/j.fuel.2022.125961. [DOI] [Google Scholar]
- Lee J.; Yu S.; Park J.; Jo H.; Park J.; Ryu C.; Jeong Y. G. Reduction of unburned carbon release and NOx emission from a pulverized wood pellet boiler retrofitted for fuel switching from coal. Energies 2020, 13, 5077 10.3390/en13195077. [DOI] [Google Scholar]
- Lasdon L.; Fox R.; Ratner M. Nonlinear optimization using the generalized reduced gradient method. RAIRO - Oper. Res. 1974, 8, 73–103. [Google Scholar]
- ANSYS Fluent Tutorial Guide 18. ANSYS Fluent Tutorial Guide 18, 2018; Vol. 41.
- Zhou A.; Xu H.; Xu M.; Yu W.; Li Z.; Yang W. Numerical investigation of biomass co-combustion with methane for NOx reduction. Energy 2020, 194, 116868 10.1016/j.energy.2019.116868. [DOI] [Google Scholar]
- Wang Y.; Zhou Y. Numerical optimization of the influence of multiple deep air-staged combustion on the NOx emission in an opposed firing utility boiler using lean coal. Fuel 2020, 269, 116996 10.1016/j.fuel.2019.116996. [DOI] [Google Scholar]
- Wang Y.; Zhou Y.; Bai N.; Han J. Experimental investigation of the characteristics of NOx emissions with multiple deep air-staged combustion of lean coal. Fuel 2020, 280, 118416 10.1016/j.fuel.2020.118416. [DOI] [Google Scholar]
- Niemelä N. P.; Mylläri F.; Kuittinen N.; Aurela M.; Helin A.; Kuula J.; Teinilä K.; Nikka M.; Vainio O.; Arffman A.; Lintusaari H.; Timonen H.; Rönkkö T.; Joronen T. Experimental and numerical analysis of fine particle and soot formation in a modern 100 MW pulverized biomass heating plant. Combust. Flame 2022, 240, 111960 10.1016/j.combustflame.2021.111960. [DOI] [Google Scholar]
- Alganash B.; Paul M. C.; Watson I. A. Numerical investigation of the heterogeneous combustion processes of solid fuels. Fuel 2015, 141, 236–249. 10.1016/j.fuel.2014.10.060. [DOI] [Google Scholar]
- Milićević A.; Belošević S.; Crnomarković N.; Tomanović I.; Stojanović A.; Tucaković D.; Lei Deng C.; Che D. Numerical study of co-firing lignite and agricultural biomass in utility boiler under variable operation conditions. Int. J. Heat Mass Transfer 2021, 181, 121728 10.1016/j.ijheatmasstransfer.2021.121728. [DOI] [Google Scholar]
- Collazo J.; Porteiro J.; Míguez J. L.; Granada E.; Gómez M. A. Numerical simulation of a small-scale biomass boiler. Energy Convers. Manage. 2012, 64, 87–96. 10.1016/j.enconman.2012.05.020. [DOI] [Google Scholar]
- Holtmeyer M. L.; Kumfer B. M.; Axelbaum R. L. Effects of biomass particle size during cofiring under air-fired and oxyfuel conditions. Appl. Energy 2012, 93, 606–613. 10.1016/j.apenergy.2011.11.042. [DOI] [Google Scholar]
- Panahi A.; Tarakcioglu M.; Schiemann M.; Delichatsios M.; Levendis Y. A. On the particle sizing of torrefied biomass for co-firing with pulverized coal. Combust. Flame 2018, 194, 72–84. 10.1016/j.combustflame.2018.04.014. [DOI] [Google Scholar]
- Luan Y.; Rao Y.; Weigand B. Experimental and numerical study of heat transfer and pressure loss in a multi-convergent swirl tube with tangential jets. Int. J. Heat Mass Transfer 2022, 190, 122797 10.1016/j.ijheatmasstransfer.2022.122797. [DOI] [Google Scholar]


