

Abstract
The precise pattern and timing of speciation events that gave rise to all living placental mammals remain controversial. We provide a comprehensive phylogenetic analysis of genetic variation across an alignment of 241 placental mammal genome assemblies, addressing prior concerns regarding limited genomic sampling across species. We compared neutral genome-wide phylogenomic signals using concatenation and coalescent-based approaches, interrogated phylogenetic variation across chromosomes, and analyzed extensive catalogs of structural variants. Interordinal relationships exhibit relatively low rates of phylogenomic conflict across diverse datasets and analytical methods. Conversely, X-chromosome versus autosome conflicts characterize multiple independent clades that radiated during the Cenozoic. Genomic time trees reveal an accumulation of cladogenic events before and immediately after the Cretaceous-Paleogene (K-Pg) boundary, implying important roles for Cretaceous continental vicariance and the K-Pg extinction in the placental radiation.
INTRODUCTION:
Resolving the role that different environmental forces may have played in the apparent explosive diversification of modern placental mammals is crucial to understanding the evolutionary context of their living and extinct morphological and genomic diversity.
RATIONALE:
Limited access to whole-genome sequence alignments that sample living mammalian biodiversity has hampered phylogenomic inference, which until now has been limited to relatively small, highly constrained sequence matrices often representing <2% of a typical mammalian genome. To eliminate this sampling bias, we used an alignment of 241 whole genomes to comprehensively identify and rigorously analyze noncoding, neutrally evolving sequence variation in coalescent and concatenation-based phylogenetic frameworks. These analyses were followed by validation with multiple classes of phylogenetically informative structural variation. This approach enabled the generation of a robust time tree for placental mammals that evaluated age variation across hundreds of genomic loci that are not restricted by protein coding annotations.
RESULTS:
Coalescent and concatenation phylogenies inferred from multiple treatments of the data were highly congruent, including support for higher-level taxonomic groupings that unite primates+colugos with treeshrews (Euarchonta), bats+cetartiodactyls+perissodactyls+carnivorans+ pangolins (Scrotifera), all scrotiferans excluding bats (Fereuungulata), and carnivorans+pangolins with perissodactyls (Zooamata). However, because these approaches infer a single best tree, they mask signatures of phylogenetic conflict that result from incomplete lineage sorting and historical hybridization. Accordingly, we also inferred phylogenies from thousands of noncoding loci distributed across chromosomes with historically contrasting recombination rates. Throughout the radiation of modern orders (such as rodents, primates, bats, and carnivores), we observed notable differences between locus trees inferred from the autosomes and the X chromosome, a pattern typical of speciation with gene flow. We show that in many cases, previously controversial phylogenetic relationships can be reconciled by examining the distribution of conflicting phylogenetic signals along chromosomes with variable historical recombination rates.
Lineage divergence time estimates were notably uniform across genomic loci and robust to extensive sensitivity analyses in which the underlying data, fossil constraints, and clock models were varied. The earliest branching events in the placental phylogeny coincide with the breakup of continental landmasses and rising sea levels in the Late Cretaceous. This signature of allopatric speciation is congruent with the low genomic conflict inferred for most superordinal relationships. By contrast, we observed a second pulse of diversification immediately after the Cretaceous-Paleogene (K-Pg) extinction event superimposed on an episode of rapid land emergence. Greater geographic continuity coupled with tumultuous climatic changes and increased ecological landscape at this time provided enhanced opportunities for mammalian diversification, as depicted in the fossil record. These observations dovetail with increased phylogenetic conflict observed within clades that diversified in the Cenozoic.
CONCLUSION:
Our genome-wide analysis of multiple classes of sequence variation provides the most comprehensive assessment of placental mammal phylogeny, resolves controversial relationships, and clarifies the timing of mammalian diversification. We propose that the combination of Cretaceous continental fragmentation and lineage isolation, followed by the direct and indirect effects of the K-Pg extinction at a time of rapid land emergence, synergistically contributed to the accelerated diversification rate of placental mammals during the early Cenozoic.
Graphical Abstract

The timing of placental mammal evolution. Superordinal mammalian diversification took place in the Cretaceous during periods of continental fragmentation and sea level rise with little phylogenomic discordance (pie charts: left, autosomes; right, X chromosome), which is consistent with allopatric speciation. By contrast, the Paleogene hosted intraordinal diversification in the aftermath of the K-Pg mass extinction event, when clades exhibited higher phylogenomic discordance consistent with speciation with gene flow and incomplete lineage sorting.
Placental mammals display a staggering breadth of morphological, karyotypic, and genomic diversity, rivaling or surpassing any other living vertebrate clade (1–3). This variation represents the culmination of 100 million years (Ma) of diversification and parallel adaptation to tumultuous changes in Earth’s environments, including catastrophic events such as the Cretaceous-Paleogene (K-Pg) bolide impact. These different measures of diversity have impeded a complete reckoning of how and why modern placental mammal orders suddenly appeared in the Paleocene with scant paleontological signal preceding the KPg impact.
Prior studies have produced conflicting results regarding the timing and sequence of interordinal and intraordinal cladogenesis. As many as five models of placental mammal diversification have been proposed (4, 5), each implying different degrees of causality between the K-Pg extinction event and ordinal diversification. Each model is supported with molecular analyses of different sequence matrices that have been heavily biased toward short, evolutionarily constrained protein-coding exons or ultraconserved noncoding sequences (6–10). Biased genomic sampling has hampered a full resolution of the placental mammal phylogeny and an understanding of the principal drivers of ordinal diversification.
Here, we report a comprehensive analysis of phylogenomic signals from investigations of multiple genomic character types assayed from a hierarchical alignment (HAL) of 241 placental mammal whole-genome assemblies (1, 11). The HAL samples all placental mammal orders and represents 62% of placental families. The process and data structure that generated the HAL provide a statistically vetted whole-genome assessment of synteny and sequence orthology, reducing the potential for phylogenetic reconstruction errors caused by ortholog mis-identification observed in some previous studies (12). The resulting availability of per base estimates of genomic constraint (PhyloP scores) also allowed us to assess the impacts of natural selection on phylogenetic signal and enabled the rigorous application of coalescent approaches (13).
Results
Whole-genome phylogenies
We applied site pattern frequency–based coalescent methods implemented in the SVDquartets program to sample single-nucleotide polymorphisms (SNPs) spaced by a minimum of 1 kb to reduce the impacts of intralocus recombination and linkage. We estimated phylogenetic relationships for all species in the HAL alignment and for 65 taxon matrices that sample all ordinal lineages while minimizing missing data (table S1). We analyzed three versions of the 65-taxon alignment to mitigate the reference-bias of alignments that were extracted from the HAL (table S2): a human-referenced alignment (HRA), a dog-referenced alignment (DRA), and a root-referenced alignment (RRA) that was imputed from the inferred placental ancestor (1). Because of the absence of nonplacental outgroups in our alignment, the root position was assumed to be between Atlantogenata and Boreoeutheria (5) and remains an open question. To investigate the impact of selection, we also identified conserved, accelerated, and nearly neutral evolving SNPs from a distribution of HRA sites ranked by PhyloP conservation scores across the 241-species alignment (14).
HRA coalescent trees estimated for 65 and 241 species from nearly neutral PhyloP sites were highly resolved, with 96 and 97% of the quartets compatible with the inferred species trees, respectively (Fig. 1A, fig. S1A, and table S2). The 65-taxon accelerated sites tree was topologically identical to the nearly neutral tree (fig. S1B). The 65-taxon tree computed on the basis of conserved sites (fig. S1C) differed only in the positions of Macroscelidea and Scandentia. The dog-referenced 65-taxon tree (fig S2A) was also identical to the nearly neutral HRA topology, except for relationships within Afroinsectiphilia. The root-referenced tree (fig. S2B) differed from the human and dog referenced trees only by supporting an elephant+sirenian clade (Tethytheria) within Paenungulata (fig. S2). The HRA results were robust to different measures of missing data (fig. S3).
Fig. 1. Placental mammal phylogeny based on coalescent analysis of nearly neutral sites.

(A) Fifty-percent Majority-rule consensus tree from a SVDquartets analysis of 411,110 genome-wide, nearly neutral sites from the human-referenced alignment of 241 species. Bootstrap support is 100% for all nodes. Superordinal clades are labeled and identified in four colors. Nodes corresponding to Boreoeutheria and Atlantogenata are indicated with black circles. (B) The frequency at which eight superordinal clades [numbered 1 to 8 in (A)] were recovered as monophyletic in 2164 window-based maximum likelihood trees from representative autosomes (Chr1, Chr21 and Chr22) and ChrX. Dotted lines indicate relationships that differ from the concatenated maximum likelihood analysis.
The superordinal clades Euarchonta (primates, colugos, and treeshrews), Glires (rodents and lagomorphs), Scrotifera (bats, cetartiodactyls, perissodactyls, carnivorans, and pangolins), Fereuungulata (all scrotiferans excluding bats), and Zooamata [Ferae (carnivorans and pangolins) + Perissodactyla] were well supported in all analyses (Fig. 1), including those that used sites at different extremes of selective constraint and missingness (the percent-age of missing data per alignment column) (figs. S1 and S3). Concatenated analyses of the same SNP datasets generally were highly congruent with coalescent-based superordinal relationships (Fig. 1A and table S3), but within Afrotheria, relationships among afroinsectiphilians were less well-resolved in a subset of the coalescent and concatenation analyses. More limited taxon sampling in this clade, higher percentages of missing data for some afrotherians, sequence alignment uncertainty, and/or long branches may contribute to the discordance observed for afroinsectiphilian relationships among different analyses (table S1). Future high-quality genomic sampling of afrotherian biodiversity should be a priority.
Genomic distribution of superordinal phylogenomic signal
Coalescent-based approaches such as SVDquartets assume incomplete lineage sorting (ILS) but no interspecific gene flow. Concatenation methods assume that the most common phylogenetic signal represents the species tree. Both approaches typically mask signatures of ancestral hybridization or admixture (15–17). To address this problem, we generated 2164 maximum likelihood trees for 228 species from 100-kb alignment windows (locus trees) sampled across three human autosomes (Chr1, Chr21, and Chr22) and the X chromosome (ChrX) (table S4). These locus trees sample more than 95 Mb of predominantly (98%) noncoding alignment columns from chromosomes that sample a broad range of karyotypic attributes, including size, gene density, inferred historical recombination rate (Table 1), and ancestral gene order (18–21). The genomic segments corresponding to human Chr21 and Chr22 are frequently found near telomeres and on small chromosomes in the majority of placental mammal karyotypes (table S5) (3, 21), which is predictive of historically high meiotic recombination rate and gene tree conflict (15, 16). Conversely, the highly collinear X chromosome in mammals contains a large, conserved recombination coldspot and is expected to be enriched in signal that is consistent with the species trees across diverse clades (16, 19). Although resolved recombination maps are lacking for most placental mammal species, the correlation between biased GC conversion and meiotic recombination allows the local recombination rate to be approximated from estimates of GC content (22). We used TreeHouseExplorer (23) to visualize locus trees across autosomes and the X chromosome and regions of high- and low-GC content to identify chromosome-specific signatures of conflict that would not be apparent in the coalescence or concatenation (majority rule) analyses.
Table 1.
Karyotypic features of four human chromosomes selected for window-based phylogenetic analyses.
| Chromosome | Size | Gene density |
|---|---|---|
| ChrX | ||
| Chr1 | ||
| Chr21 | ||
| Chr22 |
Superordinal relationships supported in the coalescent and concatenation trees were also recovered with high frequency in the locus trees distributed across chromosomes (Fig. 1B). Relationships within Laurasiatheria show very low conflict among locus trees, with the Zooamata clade occurring in 95% of autosomal and 89% of ChrX windows and >86% of high- and low-GC windows (Fig. 2 and table S6). The consistent recovery of the majority of clades among locus trees may be due to the increased number of informative sites. The high proportion of noncoding positions in our alignments (~97%) (Table 2) provides greater resolving power than coding exons (24–27).
Fig. 2. Contrasting patterns of phylogenomic discordance.
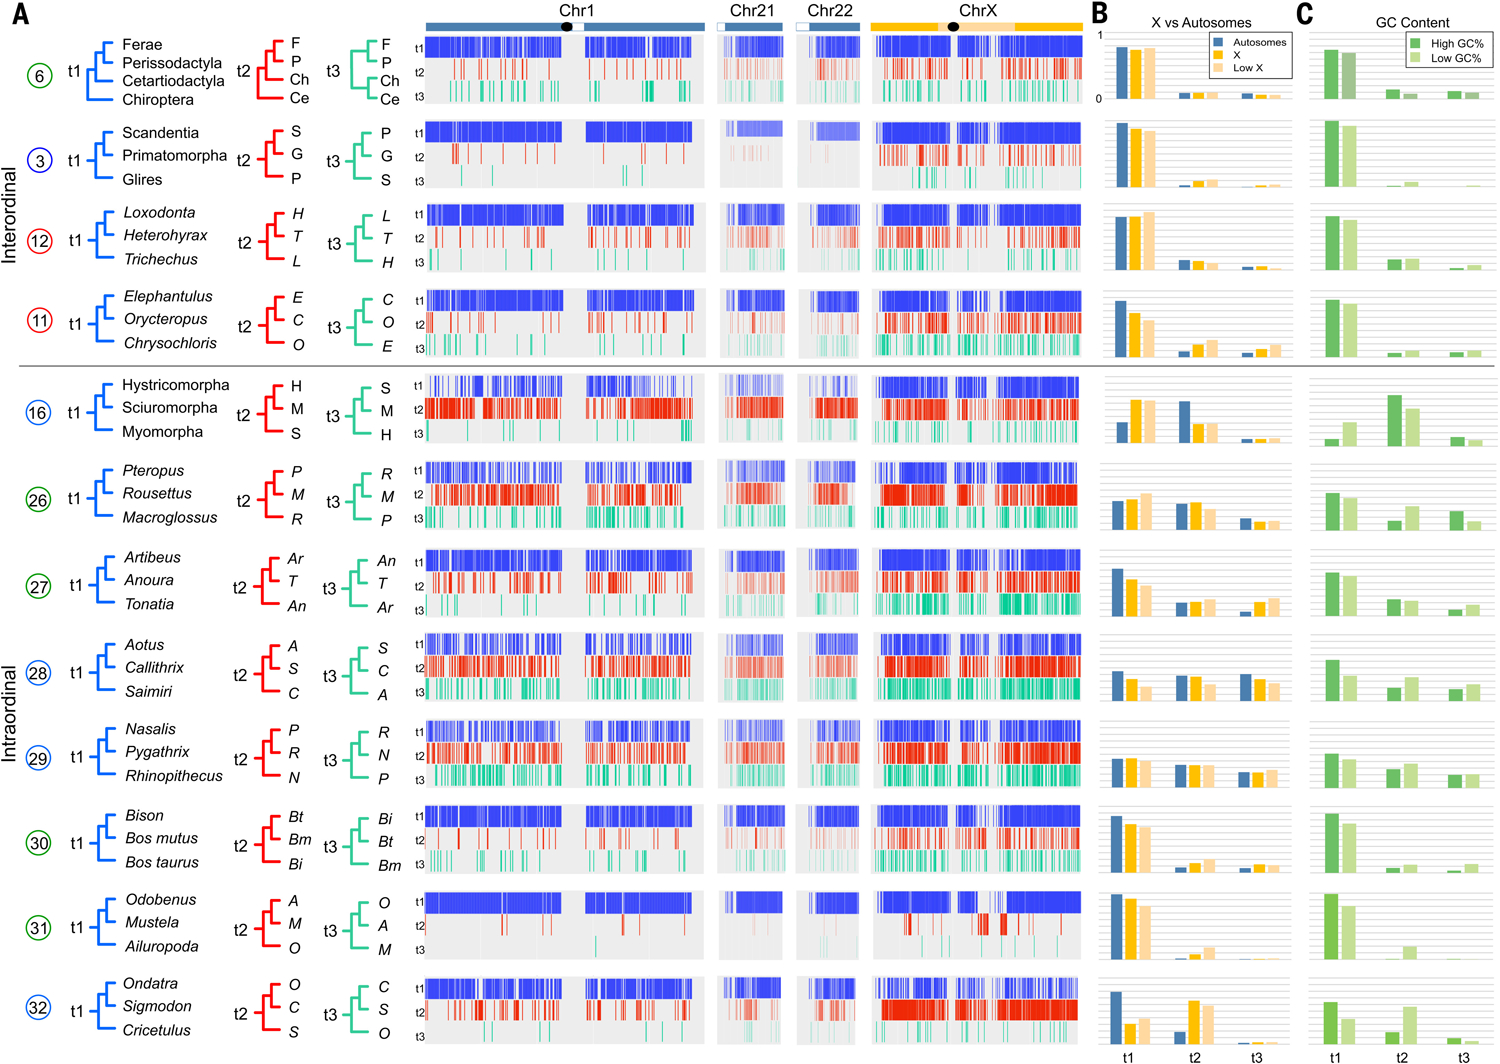
(A) Distribution of phylogenomic signal from select clades (table S5), visualized by using TreeHouseExplorer (23) in 100-kb alignment windows along human Chr1, Chr21, Chr22, and ChrX. Vertical bars along each chromosome are color-coded to indicate the distribution of the topology—t1, blue; t2, red; or t3, green, corresponding to topologies shown at left—that was recovered in the locus window. Black ovals indicate approximate positions of centromeres, and white boxes indicate heterochromatic regions. (B) Frequency of each topology on the representative autosomes, ChrX, and the low-recombining region of the X (4). (C) Relative topology frequencies in regions of high GC content (>55%) and low GC content (<35%). There are topological differences between ChrX and the autosomes, and corresponding GC content changes, for the primary intraordinal rodent clades, arctoid carnivorans, and cricetid rodents. Support for Zooamata was obtained by summing support for this clade across all three topologies at top. An alternately colored version of this figure is also available (fig. S8).
Table 2.
Summary of genomic features of sliding-windows datasets used for phylogenomic and divergence time analyses.
| Total bases | Total noncoding bases | Total coding bases | Noncoding percent | Noncoding range (%) | Total neutral bases | Percent neutral | Neutral range (%) | Average parsimony- informative sites | |
|---|---|---|---|---|---|---|---|---|---|
| All sliding windows | |||||||||
| Divergence time analysis |
Rare genomic changes
We analyzed two independent sets of structural variants that evolve more slowly than nucleotide substitutions to provide an independent character evaluation of tree reconstruction–based results. We searched for deletions >10 base pair in size that could potentially support all possible ordinal-level topologies within Laurasiatheria and Euarchontoglires (ordinal definitions are provided in the supplementary materials, data S1). Deletions provide significant statistical support for all superordinal relationships obtained with the genome-wide and locus tree analyses for Laurasiatheria and Euarchontoglires (Fig. 3 and table S7). The largest numbers of deletions were recovered for Scrotifera, Fereuungulata, and Zooamata (Fig. 3A), which were also supported without conflict by analyses of deletions on ChrX (which possesses the lowest rates of ILS). Euarchonta was the only hypothesis supported by deletions for the position of Scandentia [but see (21)].
Fig. 3. Rare genomic changes.

(A) Number of deletions recovered in the HRA, RRA, in both the HRA and RRA, and on the HRA ChrX in support of all potential laurasiatherian hypotheses. Within Euarchontoglires, hundreds of raw deletions were recovered for Euarchonta, a subset of which were further validated (table S7). Glires + Primatomorpha and Glires + Scandentia were unsupported by the deletion analysis. (B) The topology inferred from the Kuritzin-Kischka-Schmitz-Churakov (KKSC) analysis (50) of deletions for Cetartiodactyla, Perissodactyla, and Ferae (Carnivora + Pholidota) from the HRA, RRA, and HRA/RRA overlap datasets. In all cases, the corresponding KKSC bifurcation test was significant, indicating that a polytomy at this node was rejected. This topology was also recovered in an ASTRAL-BP analysis of the overlapping set of deletions (fig. S9). Bootstrap support values are shown for 500 replicates. (C) High-confidence chromosome breakpoints supporting the monophyly of select superordinal clades. No conflicting breakpoints were found for these nodes.
We also analyzed a set of phylogenetically informative chromosome breakpoints curated in an alignment of contiguous genome assemblies from members of 19 placental mammal orders (28). Although breakpoint reuse occurs at a frequency of about 10% across mammals (20), an analysis of phylogenetically informative chromosome rearrangements affirmed ordinal monophyly and supported a subset of superordinal clades also recovered by coalescent and window-based phylogenies and deletions, in addition to Atlantogenata (Fig. 3 and table S8). All analyses converged on a resolved superordinal tree within Boreoeutheria, with low discordance among the basal nodes of Laurasiatheria and Euarchontoglires.
Divergence time and ordinal diversification
The paucity of genome-wide discordance in the Cretaceous superordinal phylogeny may be the signature of allopatric speciation processes that isolated small populations of placental mammal ancestors on different fragments of the Gondwanan and Laurasian landmasses. Previous gene-based studies of molecular divergence times have attributed early mammal diversification to continental fragmentation that resulted from a combination of plate tectonics and changes in global sea level (29–31). However, some phylogenomic studies (8, 10, 32) have produced point divergence estimates for the earliest superordinal branching events 10 to 15 Ma younger and less compatible with vicariance-based hypotheses (fig. S4). These latter hypotheses fail to explain the hierarchical biogeographic pattern apparent in the four superordinal clades (33).
To test these competing hypotheses, we estimated molecular time trees using MCMCtree in PAML (34, 35) from 316 independent 100-kb windows spread across the three autosomes and the X chromosome, using 37 soft-bounded fossil calibrations for 65 taxa (Fig. 4A, table S10, and figs. S5 and S6). This approach allowed us to generate numerous independent datasets that sample adequate numbers of informative sites (table S7) and are not constrained by protein-coding gene size, which mitigated the influence of locus tree error (36) and genomic undersampling, factors that have previously been demonstrated to bias divergence time estimates (37). Most (97.7%) of the sampled bases in these windows are noncoding (Table 2). The resulting age estimates were highly consistent across locus trees and chromosomes (Fig. 4B and fig. S7) and were robust to PhyloP classification (table S10), root age constraints, removal of large-bodied and long-lived mammals, and missingness (Fig. 5A and table S10). Estimated locus tree divergence times were consistent with those obtained from the concatenated 241-species nearly neutral dataset (Fig. 5A), which included an additional 23 fossil calibrations (tables S9 and S10).
Fig. 4. Genomic timescale for placental mammal diversification.

Divergence times estimated with 37 fossil calibrations for interordinal and intraordinal diversification events in mammals. (A) A representative topology from ChrX showing divergence times and CIs for 65 species, estimated by using the Benton2009 root constraint and the independent rate model (IRM) clock model. (B) Genomic estimates for major placental mammal clades based on 316 100-kb windows by using the Benton2009 + IRM analysis, distributed across Chr1, Chr21, Chr22, and ChrX. The box plots summarize the mean and variation around the mean. The corresponding upper 95% CI and lower 95% CI are displayed as blue and orange circles, respectively, for each of the 316 estimates. The related minimum, maximum, mean, and median 95% CIs are listed in table S10. (C) Paleomaps (38) illustrate the extent of continental fragmentation and sea level rise at a series of time points during the Cretaceous.
Fig. 5. Divergence time sensitivity analyses.

For analyses in which 316 trees were used, point divergence time estimates for all 316 time trees are displayed. The overlaid box plots show the mean of 316 point estimates. The corresponding minimum, maximum, mean, and median 95% CIs are listed in table S10. (A) Variation in node ages when the root constraint, stratigraphic bounds (correcting for body size), and missingness are varied. (B) Comparison of point estimates when the tree is fully calibrated by using a combination of “cladistic” (fossils assigned to a node based on a formal cladistic analysis) and “opinion” fossil constraints relative to point estimates calibrated only with cladistic fossils (table S9). (Bottom) Comparison of divergence time estimates using the IRM) or autocorrelated rate model (ARM). The effective joint prior (No DNA) is compared with divergence times estimated when only the root of Placentalia is calibrated by using the Benton 2009 soft bound upper constraint. (C) Comparison of point estimates and 95% CIs for single-tree datasets in which selective pressure, genome alignment reference species, and the number of species are varied (table S10). (D) The inferred ages of select interordinal (x axis, blue dots) and intraordinal divergences (x axis, yellow dots) across the range of sensitivity analyses are listed in table S10.
Altogether, our results support a hypothesis in which continental fragmentation and sea level changes likely played an important role in the superordinal diversification of placental mammals (29, 31). Under this hypothesis, the origin of placental mammals is placed at approximately 102 Ma ago [mean of 316 upper and lower 95% confidence interval (CI) 90.4 to 114.5 (table S10)]. The earliest divergences within Atlantogenata and Boreoeutheria also occurred in the Cretaceous Period at 94 Ma ago (95% CI 80.5 to 108.2) and 96 Ma ago (95% CI 86.5 to 105.9), respectively. The timing of these events coincides with Africa’s geological fragmentation from South America (~110 Ma ago onward) and with parts of Laurasia (38). Interordinal divergences within Laurasiatheria occurred between 81.6 and 73.6 Ma ago (95% CI 67.9 to 88.29), coinciding with the peak of Cretaceous land fragmentation due to elevated sea levels (~97 to 75 Ma ago) (26, 33). The origin of Euarchontoglires was dated 80.7 Ma ago (95% CI 75.0 to 88.3 Ma ago) and was followed by the afrotherian radiation that commenced at 73.0 Ma ago (95% CI 67.9 to 79.3 Ma ago).
We performed a suite of sensitivity analyses to demonstrate that these results were robust to variation in the underlying molecular dataset (Fig. 5A), the usage of different subsets of fossil calibrations (Fig. 5B), and the model of lineage-specific rate variation (Fig. 5C). Despite the minor observed differences in point time estimates across genomic windows, when we consider their uncertainty, a majority of analyses support the “long fuse” model of placental mammal diversification (Fig. 5D) (39). Our results contrast with many previous studies that instead support four alternative models of diversification (4). The consistent divergence time point estimates across locus trees may also be related to the high proportion of parsimony-informative sites in our analyzed genomic windows. Marin and Hedges (37) suggested that genomic undersampling can result in biased divergence times. They used simulations to demonstrate that the number of sites required to recover divergence times accurately scales with the number of tips in a phylogeny. For example, roughly estimating from their regression analysis, ~4000 variable sites are necessary to infer accurate divergence times for a tree that contains 65 taxa. The number of parsimony-informative sites in the genomic windows we sampled exceeds this threshold and contains, on average, 43,881 parsimony-informative sites in the 65 species datasets alone (table S7) (6).
In contrast to strong evidence for superordinal divergences occurring almost entirely in the Cretaceous period, intraordinal diversification mainly was restricted to the early Paleocene, immediately after the K-Pg extinction event, 65.3 to 53.6 Ma ago (95% CI 45.6 to 66.8) (Fig. 4B) (40). The Paleocene also saw the ordinal diversification of Xenarthra and the two primary afrotherian lineages, Paenungulata and Afroinsectiphilia. This result represents a molecular signature of the K-Pg extinction event influencing ordinal diversification. Only Eulipotyphla is estimated to have begun to diversify in the Cretaceous period (mean estimate, 77.4 Ma ago) (95% CI 68.9 to 86.8). However, we demonstrate the sensitivity of some ordinal divergence estimates to different fossil calibration strategies (table S10), highlighting the need for the development of improved divergence time models that account for molecular rate variation correlated with life-history traits.
Phylogenomic conflict in the Cenozoic Era
In contrast to the well-resolved lineage diversification events in the Cretaceous, Cenozoic branching events showed higher levels of phylogenomic discordance, which we hypothesize may have resulted from larger population sizes and markedly greater geographic continuity within and between continents at this time (Fig. 2) (31). The earliest radiations of New World and Old World primates show evenly distributed amounts of topological conflict across autosomal and ChrX locus trees and high and low partitions of GC content, both of which are characteristic of ILS but not introgression (13, 41). By contrast, several other clades show markedly different topological and GC content distributions between the autosomes and the X chromosome (Fig. 2), a pattern observed in cases of speciation with gene flow (15, 16, 42, 43). For example, the inferred species tree that unites sciuromorph and hystricomorph rodents is enriched on the X chromosome and the center of Chr1, regions of the ancestral placental mammal karyotype that are predicted to have historically lower rates of recombination. However, this topology is depleted on the small autosomes and the telomeric ends of Chr1, where ancestral reconstructions predict historically higher rates of recombination (Table 1 and table S5) that lead to locus tree conflict.
A basal position for ursids is supported across most locus trees within arctoid carnivorans. However, there is strong enrichment for an ursid+musteloid clade found within two ChrX recombination coldspots that are enriched for the species tree in other carnivoran families (16, 44). We hypothesize that gene flow between the ancestors of musteloids and pinnipeds may have erased the species tree history across the autosomes, which was retained in the center of the low recombining region of ChrX, mirroring observations in other animal clades (15, 17). Locus trees for cricetid rodents also reveal a very high disparity in ChrX versus autosomal signal, with ChrX enriched for a Cricetulus+Ondatra clade as the most probable species tree, which echoes findings from phylogenomic studies of other muroid rodents (45). Profiles with low GC content similarly track the inferred species trees in each Cenozoic clade (Fig. 2) (21, 46). Our findings highlight phylogenetically dispersed X-autosome discordance throughout the Paleogene and Neogene (Fig. 2 and table S10), a pattern absent throughout the first 25 Ma of the superordinal placental mammal radiation.
Discussion
George Gaylord Simpson (47) predicted that “complete genetic analysis would provide the most priceless data for the mapping of this stream,” referring to the resolution of mammalian phylogeny, a classic and recalcitrant problem in evolutionary biology. Our comprehensive analysis of the 241-placental-mammal whole-genome alignment confirms Simpson’s prediction. It establishes a standard for phylogenomics that maximizes the value of genome sequences at deep taxonomic levels and moves beyond constrained, gene-centric approaches (1). On the basis of the preponderance of evidence across multiple variants of divergence time estimation, we propose that the combination of two major Cretaceous events played a fundamental role in the successful radiation of crown placental mammals in the Paleogene. First, increased continental fragmentation promoted lineage isolation (Fig. 4C), followed by the most rapid episode of land emergence during the Mesozoic (38). This second event would have set the stage for the emergence of morphologically diagnosable orders in the ecological vacuum that followed the mass extinction of nonavian dinosaurs 66 Ma ago. We envision a similar resolution of long-standing controversies across the tree of life with improved use of the historical information encoded within living genomes.
Materials and methods summary
Genome-wide coalescence and concatenation phylogenies were generated by using three differently referenced versions (human, dog, and inferred ancestor at the root) of the HAL alignment. Human-referenced, single–base pair resolved PhyloP scores were used to define genome-wide SNPs corresponding to accelerated, conserved, and neutrally evolving regions of the alignment to explore the impact of selective constraint on coalescent and concatenation-based phylogenomic inference. The conservation of karyotypic position across all placental mammals was used to infer the historical recombination rate for three autosomes (chromosomes 1, 21, and 22) and the X chromosome to interrogate the role of genomic architecture and recombination in the distribution of phylogenomic signal for challenging to resolve nodes. Maximum likelihood trees were generated from consecutive 100-kb windows across each chromosome for each clade examined. The frequency of each competing topology was calculated and compared across the X and autosomal locus trees and regions of high- and low-GC content (a proxy for recombination rate). Divergence time estimates were generated with MCMCtree in PAML and were calibrated by using a suite of soft bounded fossil calibrations. Wide-ranging sensitivity analyses were performed, varying both the underlying molecular dataset and the fossil calibrations.
Supplementary Material
ACKNOWLEDGMENTS
We thank M. Dickens and the Texas A&M High Performance Research Computing Center for assistance and M. Dong, D. Genereux, and J. Johnson for facilitating data management. We also are grateful to the members of the Zoonomia Consortium (full list is available in the supplementary materials), particularly K. Pollard, for insightful and critical feedback.
Funding:
This work was supported by National Science Foundation grants DEB-1753760 (W.J.M.), DEB-2150664 (W.J.M.), and DEB-1457735 (M.S.S. and J.G.) and National Human Genome Research Institute grant NHGRI-1R01HG008742 to K.L.T. and E.K.K. A distinguished professorship from the Swedish Research Council funded K.L.T. A.J.H. was funded, in part, by a training grant from the National Institute of General Medical Sciences, NIH (T32 GM135115).
Footnotes
Competing interests: The authors declare that they have no competing interests.
Data and materials availability:
All datasets used in this analysis are available where indicated in the text. Scripts written as part of this study are available at https://github.com/VCMason/Foley2021 and also archived at (48). The HAL alignment is publicly available at https://cglgenomics.ucsc.edu/data/cactus. Information regarding genome assemblies and specimen biosamples is provided in (1) and can be accessed at https://zoonomiaproject.org/the-data. Human referenced PhyloP scores are publicly available at http://genome.ucsc.edu/cgi-bin/hgGateway?genome=Homo_sapiens&hubUrl=http://cgl.gi.ucsc.edu/data/cactus/241-mammalian-2020v2-hub/hub.txt. All other data, including alignments, phylogenies, and Excel versions of tables S1 to S10, are available at (49).
REFERENCES AND NOTES
- 1.Zoonomia Consortium, A comparative genomics multitool for scientific discovery and conservation. Nature 587, 240–245 (2020). doi: 10.1038/s41586-020-2876-6; [DOI] [PMC free article] [PubMed] [Google Scholar]
- 2.Eisenberg JF, The Mammalian Radiations: An Analysis of Trends in Evolution, Adaptation and Behaviour (Univ. Chicago Press, 1981). [Google Scholar]
- 3.O’Brien SJ, Graphodatsky AS, Perelman PL, Atlas of Mammalian Chromosomes (Wiley Blackwell, 2020). [Google Scholar]
- 4.Springer MS, Foley NM, Brady PL, Gatesy J, Murphy WJ, Evolutionary models for the diversification of placental mammals across the KPg boundary. Front. Genet 10, 1241 (2019). doi: 10.3389/fgene.2019.01241; [DOI] [PMC free article] [PubMed] [Google Scholar]
- 5.Murphy WJ, Foley NM, Bredemeyer KR, Gatesy J, Springer MS, Phylogenomics and the genetic architecture of the placental mammal radiation. Annu. Rev. Anim. Biosci 9, 29–53 (2021). doi: 10.1146/annurev-animal-061220-023149; [DOI] [PubMed] [Google Scholar]
- 6.Meredith RW et al. , Impacts of the Cretaceous Terrestrial Revolution and KPg extinction on mammal diversification. Science 334, 521–524 (2011). doi: 10.1126/science.1211028; [DOI] [PubMed] [Google Scholar]
- 7.dos Reis M et al. , Phylogenomic datasets provide both precision and accuracy in estimating the timescale of placental mammal phylogeny. Proc. Biol. Sci 279, 3491–3500 (2012). doi: 10.1098/rspb.2012.0683; [DOI] [PMC free article] [PubMed] [Google Scholar]
- 8.Liu L et al. , Genomic evidence reveals a radiation of placental mammals uninterrupted by the KPg boundary. Proc. Natl. Acad. Sci. U.S.A 114, E7282–E7290 (2017). doi: 10.1073/pnas.1616744114; [DOI] [PMC free article] [PubMed] [Google Scholar]
- 9.Esselstyn JA, Oliveros CH, Swanson MT, Faircloth BC, Investigating difficult nodes in the placental mammal tree with expanded taxon sampling and thousands of ultraconserved elements. Genome Biol. Evol 9, 2308–2321 (2017). doi: 10.1093/gbe/evx168; [DOI] [PMC free article] [PubMed] [Google Scholar]
- 10.Álvarez-Carretero S et al. , A species-level timeline of mammal evolution integrating phylogenomic data. Nature 602, 263–267 (2022). doi: 10.1038/s41586-021-04341-1; [DOI] [PubMed] [Google Scholar]
- 11.Armstrong J et al. , Progressive Cactus is a multiple-genome aligner for the thousand-genome era. Nature 587, 246–251 (2020). doi: 10.1038/s41586-020-2871-y; [DOI] [PMC free article] [PubMed] [Google Scholar]
- 12.Gatesy J, Springer MS, Phylogenetic analysis at deep timescales: Unreliable gene trees, bypassed hidden support, and the coalescence/concatalescence conundrum. Mol. Phylogenet. Evol 80, 231–266 (2014). doi: 10.1016/j.ympev.2014.08.013; [DOI] [PubMed] [Google Scholar]
- 13.Degnan JH, Rosenberg NA, Gene tree discordance, phylogenetic inference and the multispecies coalescent. Trends Ecol. Evol 24, 332–340 (2009). doi: 10.1016/j.tree.2009.01.009; [DOI] [PubMed] [Google Scholar]
- 14.Sullivan PF et al. , Leveraging base pair mammalian constraint to understand genetic variation and human disease. Science 380, eabn2937 (2023). doi: 10.1123/science.abn2937 [DOI] [PMC free article] [PubMed] [Google Scholar]
- 15.Edelman NB et al. , Genomic architecture and introgression shape a butterfly radiation. Science 366, 594–599 (2019). doi: 10.1126/science.aaw2090; [DOI] [PMC free article] [PubMed] [Google Scholar]
- 16.Li G, Figueiró HV, Eizirik E, Murphy WJ, Recombination-aware phylogenomics reveals the structured genomic landscape of hybridizing cat species. Mol. Biol. Evol 36, 2111–2126 (2019). doi: 10.1093/molbev/msz139; [DOI] [PMC free article] [PubMed] [Google Scholar]
- 17.Fontaine MC et al. , Mosquito genomics. Extensive introgression in a malaria vector species complex revealed by phylogenomics. Science 347, 1258524 (2015). doi: 10.1126/science.1258524; [DOI] [PMC free article] [PubMed] [Google Scholar]
- 18.Murphy WJ, Frönicke L, O’Brien SJ, Stanyon R, The origin of human chromosome 1 and its homologs in placental mammals. Genome Res. 13, 1880–1888 (2003). doi: 10.1101/gr.1022303; [DOI] [PMC free article] [PubMed] [Google Scholar]
- 19.Brashear WA, Bredemeyer KR, Murphy WJ, Genomic architecture constrained placental mammal X Chromosome evolution. Genome Res. 31, 1353–1365 (2021). doi: 10.1101/gr.275274.121; [DOI] [PMC free article] [PubMed] [Google Scholar]
- 20.Kim J et al. , Reconstruction and evolutionary history of eutherian chromosomes. Proc. Natl. Acad. Sci. U.S.A 114, E5379–E5388 (2017). doi: 10.1073/pnas.1702012114; [DOI] [PMC free article] [PubMed] [Google Scholar]
- 21.Materials and methods are available as supplementary materials.
- 22.Katzman S, Capra JA, Haussler D, Pollard KS, Ongoing GC-biased evolution is widespread in the human genome and enriched near recombination hot spots. Genome Biol. Evol 3, 614–626 (2011). doi: 10.1093/gbe/evr058; [DOI] [PMC free article] [PubMed] [Google Scholar]
- 23.Harris AJ, Foley NM, Williams TL, Murphy WJ, Tree House Explorer: A novel genome browser for phylogenomics. Mol. Biol. Evol 39, msac130 (2022). doi: 10.1093/molbev/msac130; [DOI] [PMC free article] [PubMed] [Google Scholar]
- 24.Foley NM et al. , How and why overcome the impediments to resolution: Lessons from rhinolophid and hipposiderid bats. Mol. Biol. Evol 32, 313–333 (2015). doi: 10.1093/molbev/msu329; [DOI] [PMC free article] [PubMed] [Google Scholar]
- 25.Murphy WJ et al. , Molecular phylogenetics and the origins of placental mammals. Nature 409, 614–618 (2001). doi: 10.1038/35054550; [DOI] [PubMed] [Google Scholar]
- 26.Literman R, Schwartz R, Genome-scale profiling reveals noncoding loci carry higher proportions of concordant data. Mol. Biol. Evol 38, 2306–2318 (2021). doi: 10.1093/molbev/msab026; [DOI] [PMC free article] [PubMed] [Google Scholar]
- 27.Braun EL, Kimball RT, Data types and the phylogeny of Neoaves. Birds 2, 1–22 (2021). doi: 10.3390/birds2010001 [DOI] [Google Scholar]
- 28.Damas J et al. , Evolution of the ancestral mammalian karyotype and syntenic regions. Proc. Natl. Acad. Sci. U.S.A 119, e2209139119 (2022). doi: 10.1073/pnas.2209139119; [DOI] [PMC free article] [PubMed] [Google Scholar]
- 29.Hedges SB, Parker PH, Sibley CG, Kumar S, Continental breakup and the ordinal diversification of birds and mammals. Nature 381, 226–229 (1996). doi: 10.1038/381226a0; [DOI] [PubMed] [Google Scholar]
- 30.Eizirik E, Murphy WJ, O’Brien SJ, Molecular dating and biogeography of the early placental mammal radiation. J. Hered 92, 212–219 (2001). doi: 10.1093/jhered/92.2.212; [DOI] [PubMed] [Google Scholar]
- 31.Murphy WJ et al. , Resolution of the early placental mammal radiation using Bayesian phylogenetics. Science 294, 2348–2351 (2001). doi: 10.1126/science.1067179; [DOI] [PubMed] [Google Scholar]
- 32.Upham NS, Esselstyn JA, Jetz W, Inferring the mammal tree: Species-level sets of phylogenies for questions in ecology, evolution, and conservation. PLOS Biol. 17, e3000494 (2019). doi: 10.1371/journal.pbio.3000494; [DOI] [PMC free article] [PubMed] [Google Scholar]
- 33.Wildman DE et al. , Genomics, biogeography, and the diversification of placental mammals. Proc. Natl. Acad. Sci. U.S.A 104, 14395–14400 (2007). doi: 10.1073/pnas.0704342104; [DOI] [PMC free article] [PubMed] [Google Scholar]
- 34.Yang Z, PAML: A program package for phylogenetic analysis by maximum likelihood. Comput. Appl. Biosci 13, 555–556 (1997). doi: 10.1093/bioinformatics/13.5.555; [DOI] [PubMed] [Google Scholar]
- 35.Yang Z, PAML 4: Phylogenetic analysis by maximum likelihood. Mol. Biol. Evol 24, 1586–1591 (2007). doi: 10.1093/molbev/msm088; [DOI] [PubMed] [Google Scholar]
- 36.Shen X-X, Li Y, Hittinger CT, Chen X-X, Rokas A, An investigation of irreproducibility in maximum likelihood phylogenetic inference. Nat. Commun 11, 6096 (2020). doi: 10.1038/s41467-020-20005-6; [DOI] [PMC free article] [PubMed] [Google Scholar]
- 37.Marin J, Hedges SB, Undersampling genomes has biased time and rate estimates throughout the tree of life. Mol. Biol. Evol 35, 2077–2084 (2018). doi: 10.1093/molbev/msy103; [DOI] [PubMed] [Google Scholar]
- 38.Scotese CR, An atlas of phanerozoic paleogeographic maps: The seas come in and the seas go out. Annu. Rev. Earth Planet. Sci 49, 679–728 (2021). doi: 10.1146/annurev-earth-081320-064052 [DOI] [Google Scholar]
- 39.Archibald JD, Deutschman DH, Quantitative analysis of the timing of the origin and diversification of extant placental orders. J. Mamm. Evol 8, 107–124 (2001). doi: 10.1023/A:1011317930838 [DOI] [Google Scholar]
- 40.O’Leary MA et al. , The placental mammal ancestor and the post-K-Pg radiation of placentals. Science 339, 662–667 (2013). doi: 10.1126/science.1229237; [DOI] [PubMed] [Google Scholar]
- 41.Vanderpool D et al. , Primate phylogenomics uncovers multiple rapid radiations and ancient interspecific introgression. PLOS Biol. 18, e3000954 (2020). doi: 10.1371/journal.pbio.3000954; [DOI] [PMC free article] [PubMed] [Google Scholar]
- 42.Nachman MW, Payseur BA, Recombination rate variation and speciation: Theoretical predictions and empirical results from rabbits and mice. Philos. Trans. R. Soc. London B Biol. Sci 367, 409–421 (2012). doi: 10.1098/rstb.2011.0249; [DOI] [PMC free article] [PubMed] [Google Scholar]
- 43.Nelson TC et al. , Ancient and recent introgression shape the evolutionary history of pollinator adaptation and speciation in a model monkeyflower radiation (Mimulus section Erythranthe). PLOS Genet. 17, e1009095 (2021). doi: 10.1371/journal.pgen.1009095; [DOI] [PMC free article] [PubMed] [Google Scholar]
- 44.Chafin TK, Douglas MR, Douglas ME, Genome-wide local ancestries discriminate homoploid hybrid speciation from secondary introgression in the red wolf (Canidae: Canis rufus). bioRxiv 026716 [Preprint] (2020). 10.1101/2020.04.05.026716. [DOI] [Google Scholar]
- 45.White MA, Ané C, Dewey CN, Larget BR, Payseur BA, Fine-scale phylogenetic discordance across the house mouse genome. PLOS Genet. 5, e1000729 (2009). doi: 10.1371/journal.pgen.1000729; [DOI] [PMC free article] [PubMed] [Google Scholar]
- 46.Romiguier J, Ranwez V, Delsuc F, Galtier N, Douzery EJP, Less is more in mammalian phylogenomics: AT-rich genes minimize tree conflicts and unravel the root of placental mammals. Mol. Biol. Evol 30, 2134–2144 (2013). doi: 10.1093/molbev/mst116; [DOI] [PubMed] [Google Scholar]
- 47.Simpson GG, The Principles of Classification and a Classification of Mammals (American Museum of Natural History, 1945). [Google Scholar]
- 48.Mason VC, VCMason/Foley2021: Release: Foley et al. 2021 Python Programs. Zenodo (2021); doi: 10.5281/zenodo.5793715. [DOI] [Google Scholar]
- 49.Foley NM et al. , A genomic timescale for placental mammal evolution: Datasets. Zenodo (2023); doi: 10.5281/zenodo.5823345 [DOI] [PMC free article] [PubMed] [Google Scholar]
Associated Data
This section collects any data citations, data availability statements, or supplementary materials included in this article.
Supplementary Materials
Data Availability Statement
All datasets used in this analysis are available where indicated in the text. Scripts written as part of this study are available at https://github.com/VCMason/Foley2021 and also archived at (48). The HAL alignment is publicly available at https://cglgenomics.ucsc.edu/data/cactus. Information regarding genome assemblies and specimen biosamples is provided in (1) and can be accessed at https://zoonomiaproject.org/the-data. Human referenced PhyloP scores are publicly available at http://genome.ucsc.edu/cgi-bin/hgGateway?genome=Homo_sapiens&hubUrl=http://cgl.gi.ucsc.edu/data/cactus/241-mammalian-2020v2-hub/hub.txt. All other data, including alignments, phylogenies, and Excel versions of tables S1 to S10, are available at (49).