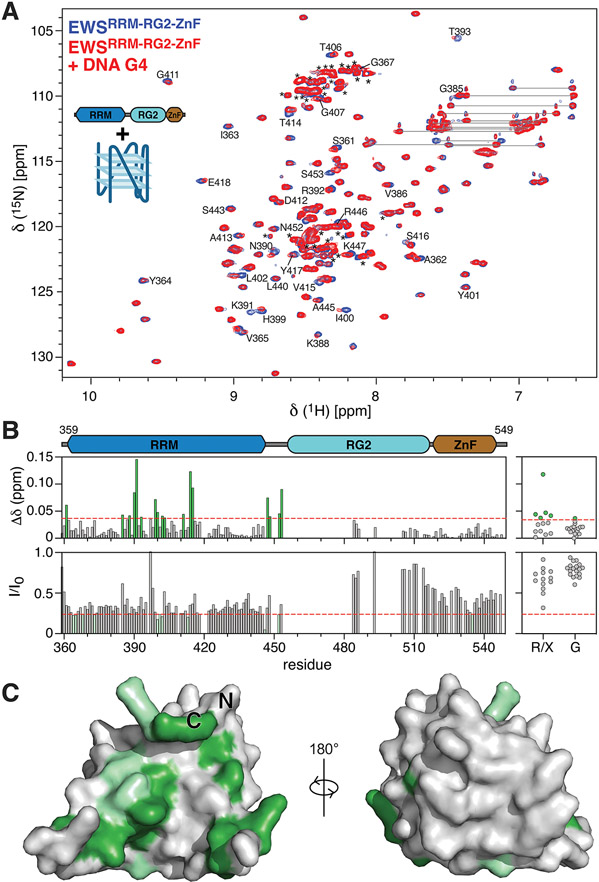
Figure 3. EWS RBD binds to the pu20m2 DNA G4 via the RRM and RG2 regions.
A) Overlay of 1H15N-HSQC spectra of 75 μM 15N EWSRRM-RG2-ZnF alone (blue) or in the presence of 15 μM DNA G4 (red). Selected peaks are assigned using the one-letter amino acid code, resonance pairs corresponding to asparagine and glutamine sidechains are indicated by lines, unassigned resonances arising mostly from RG2 are indicated by asterisks. B) CSPs (top panels) and the ratio of signal intensity (I/I0, bottom panels) were calculated for all assigned resonances (left panels) and for unassigned glycine resonances (G) or unassigned resonances of unknown type (R/X, right-panels) upon titration of the DNA G4 with EWSRRM-RG2-ZnF. Red dashed lines indicate a CSP of 0.036 or I/I0 of 0.24 and were used as the threshold for identifying peaks with the most significant changes. C) Assigned resonances within the RRM with the most significant CSPs (green) and signal broadening (light green) were mapped to the AlphaFold 38 structural model of EWSRRM.

