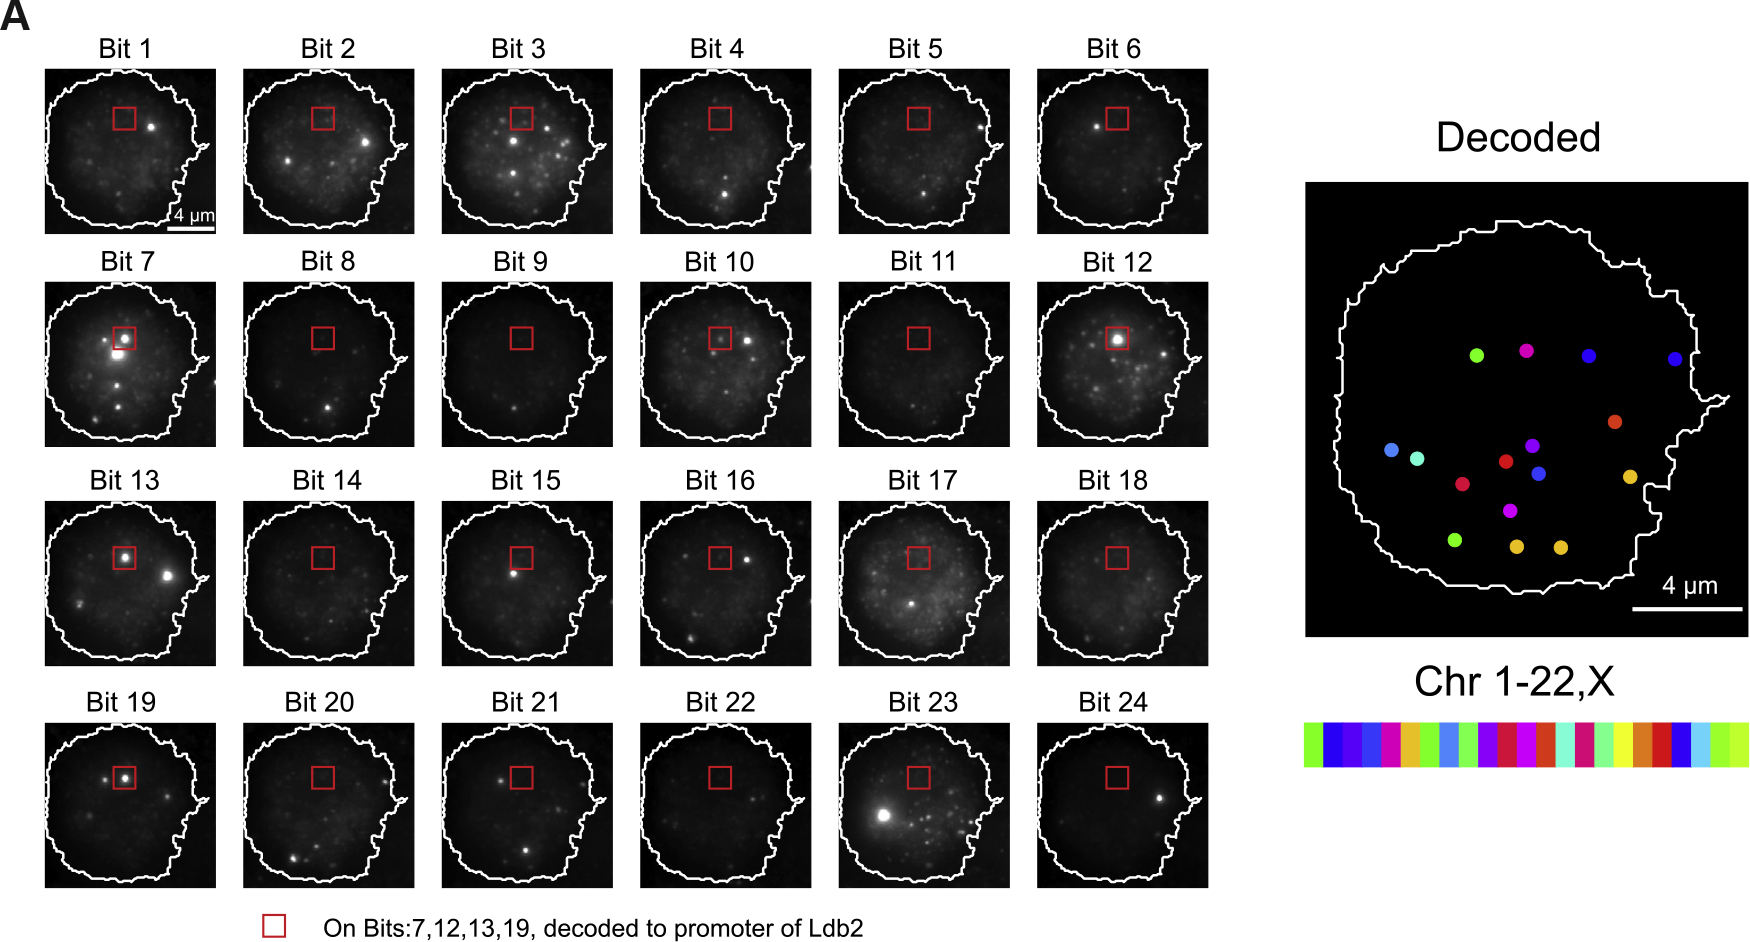
Graphical Abstract:
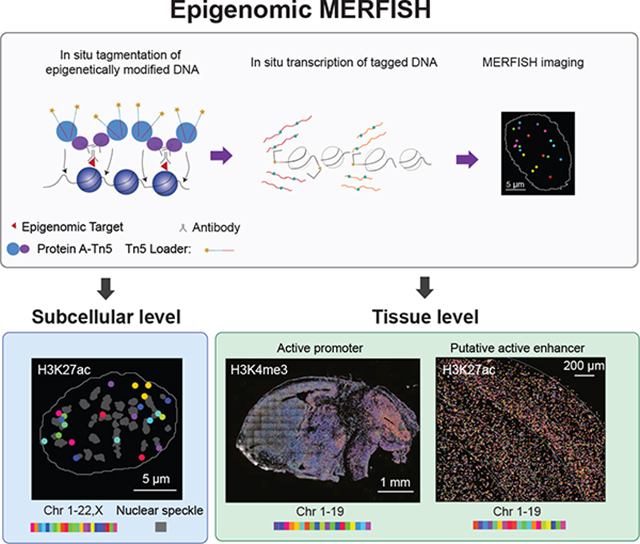
Graphical abstract (corrected)
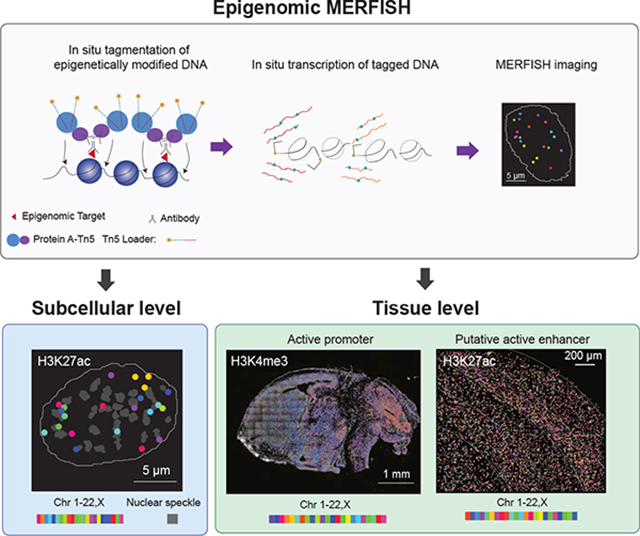
Graphical abstract (original)
In our originally published article, we imaged genomic loci on chromosomes (Chr) 1–22 and X in human cells and genomic loci on Chr1–19 in mouse brains. Since publication, we have become aware of three figure plotting mistakes in our paper that we are now correcting. (1) Because the same MATLAB code was used to generate the color-index bars describing chromosome color assignments for both human and mouse data, these index bars unintendedly also displayed color assignments for Chr20–22 and X for mouse at the bottom right of Figures 2A, 3A, 4A, S2A, and the Graphical Abstract when only colors for Chr1–19 were used. We have now removed the 4 unused color assignments and kept the first 19 color assignments for Chr1–19 unchanged. (2) Images presented in Figure 2A (left panel) and Figure 3A (right panel) used an older version of color assignments that did not match the color-index bars in the figures. These images have been updated using the appropriate color assignments. (3) Due to a mistake in the image plotting code, only the first 127 of the 139 imaged genomic loci were displayed in Figure 4A. This figure has been corrected to display all 139 imaged genomic loci. These changes have been made in the online version of the article. None of these changes are pertinent to the results or conclusions in the paper. We apologize for any confusion these errors may have caused.
Figure 2A. Spatially resolved single-cell profiling of layer-specific active promoters in adult mouse cortex (corrected).
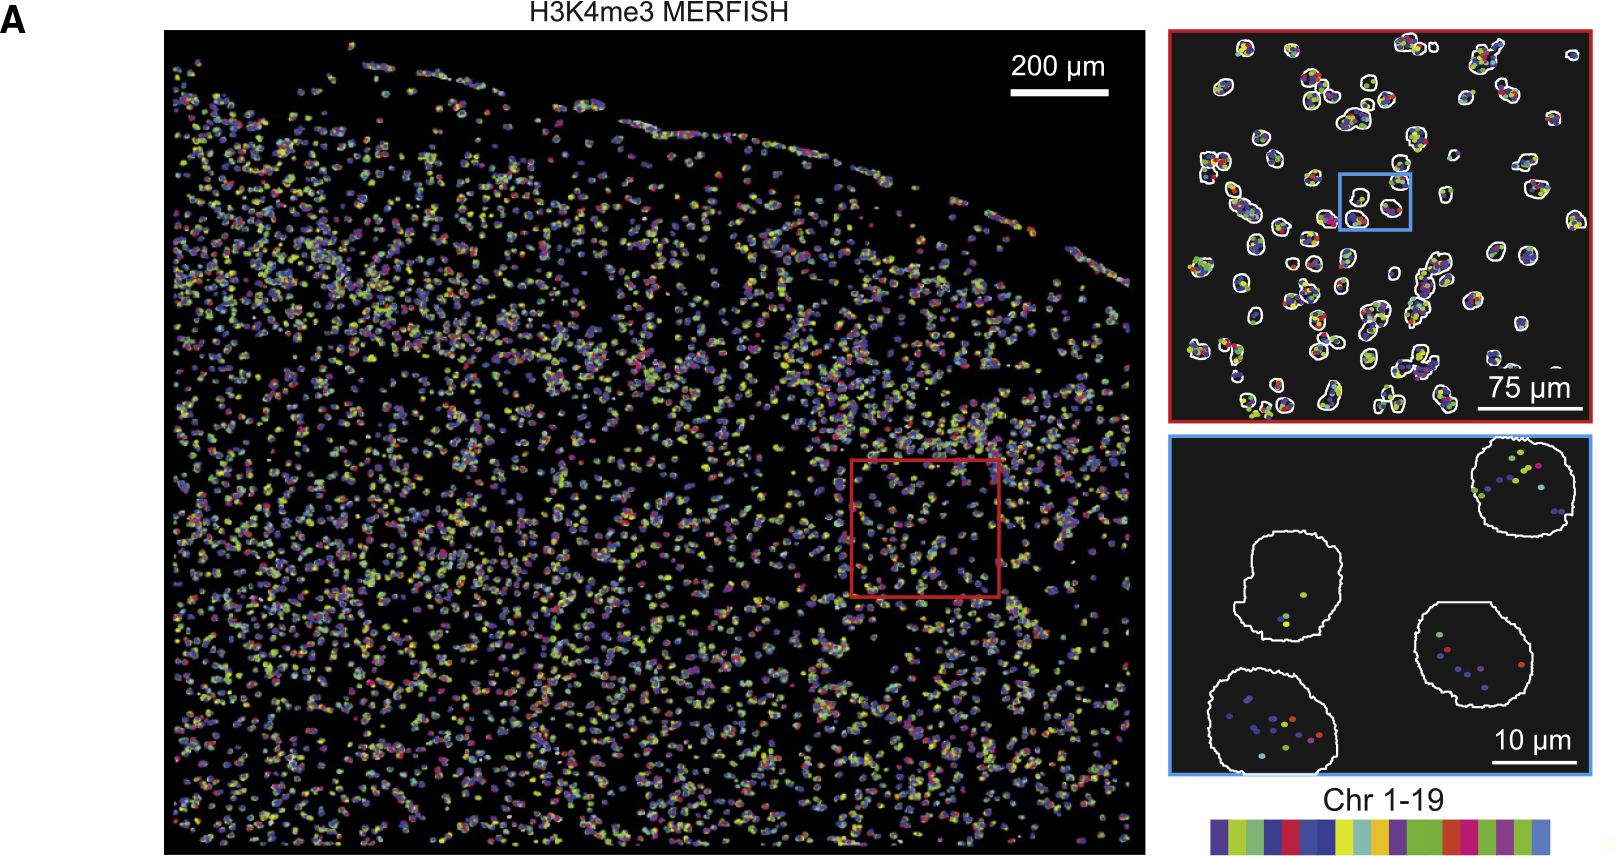
Figure 3A. Spatially resolved profiling of active promoters in mouse embryonic brain (corrected).
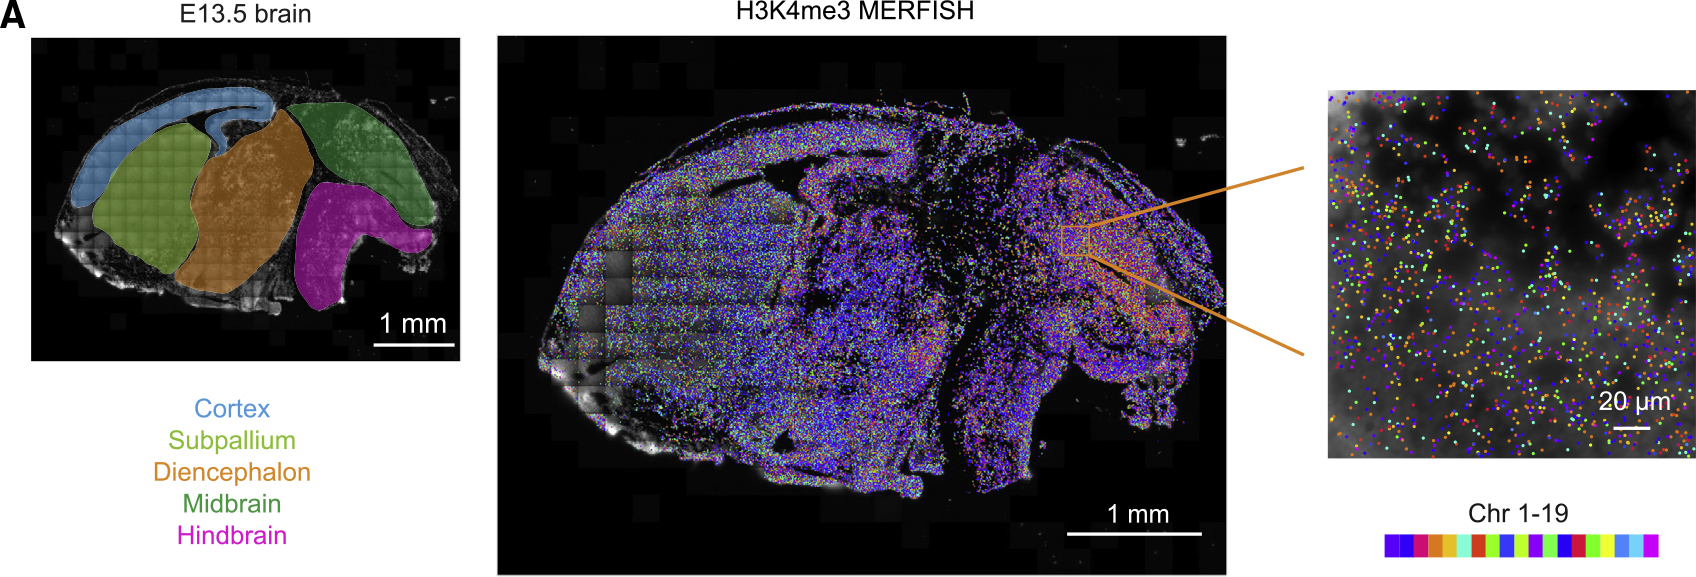
Figure 4A. Spatially resolved single-cell profiling of layer-specific putative active enhancers in adult mouse cortex (corrected).
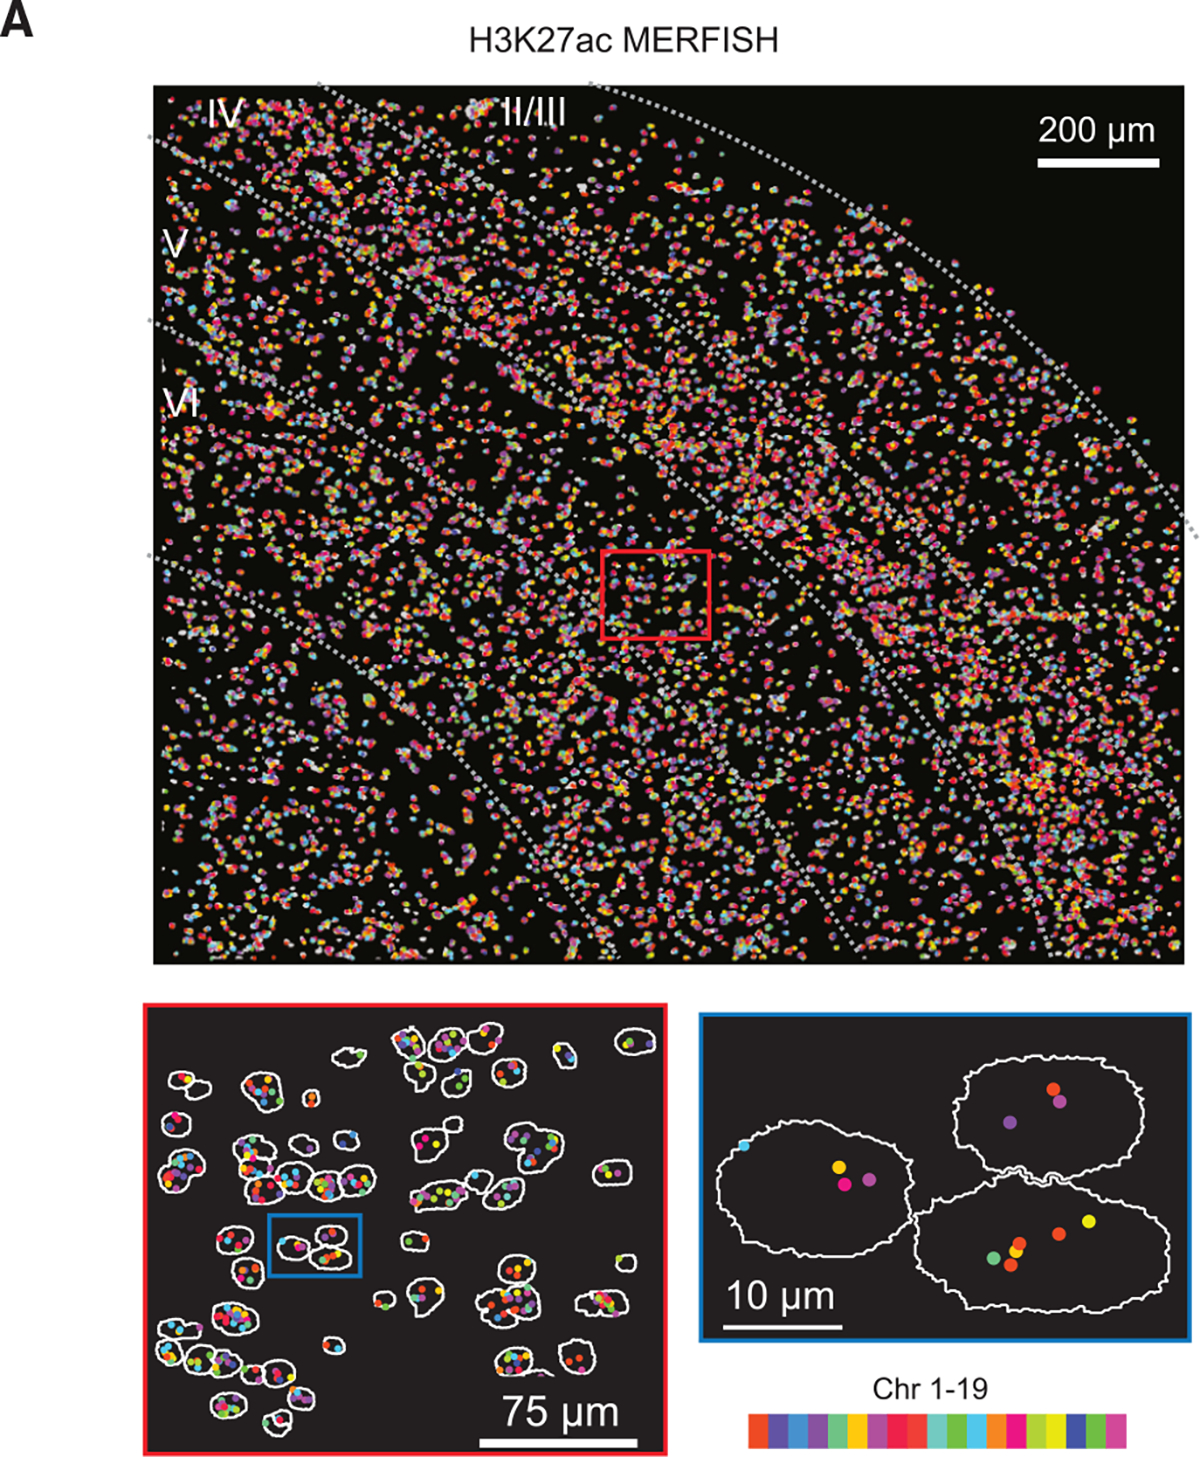
Figure S2A. The performance of epigenomic MERFISH imaging of mouse brain tissues (corrected).
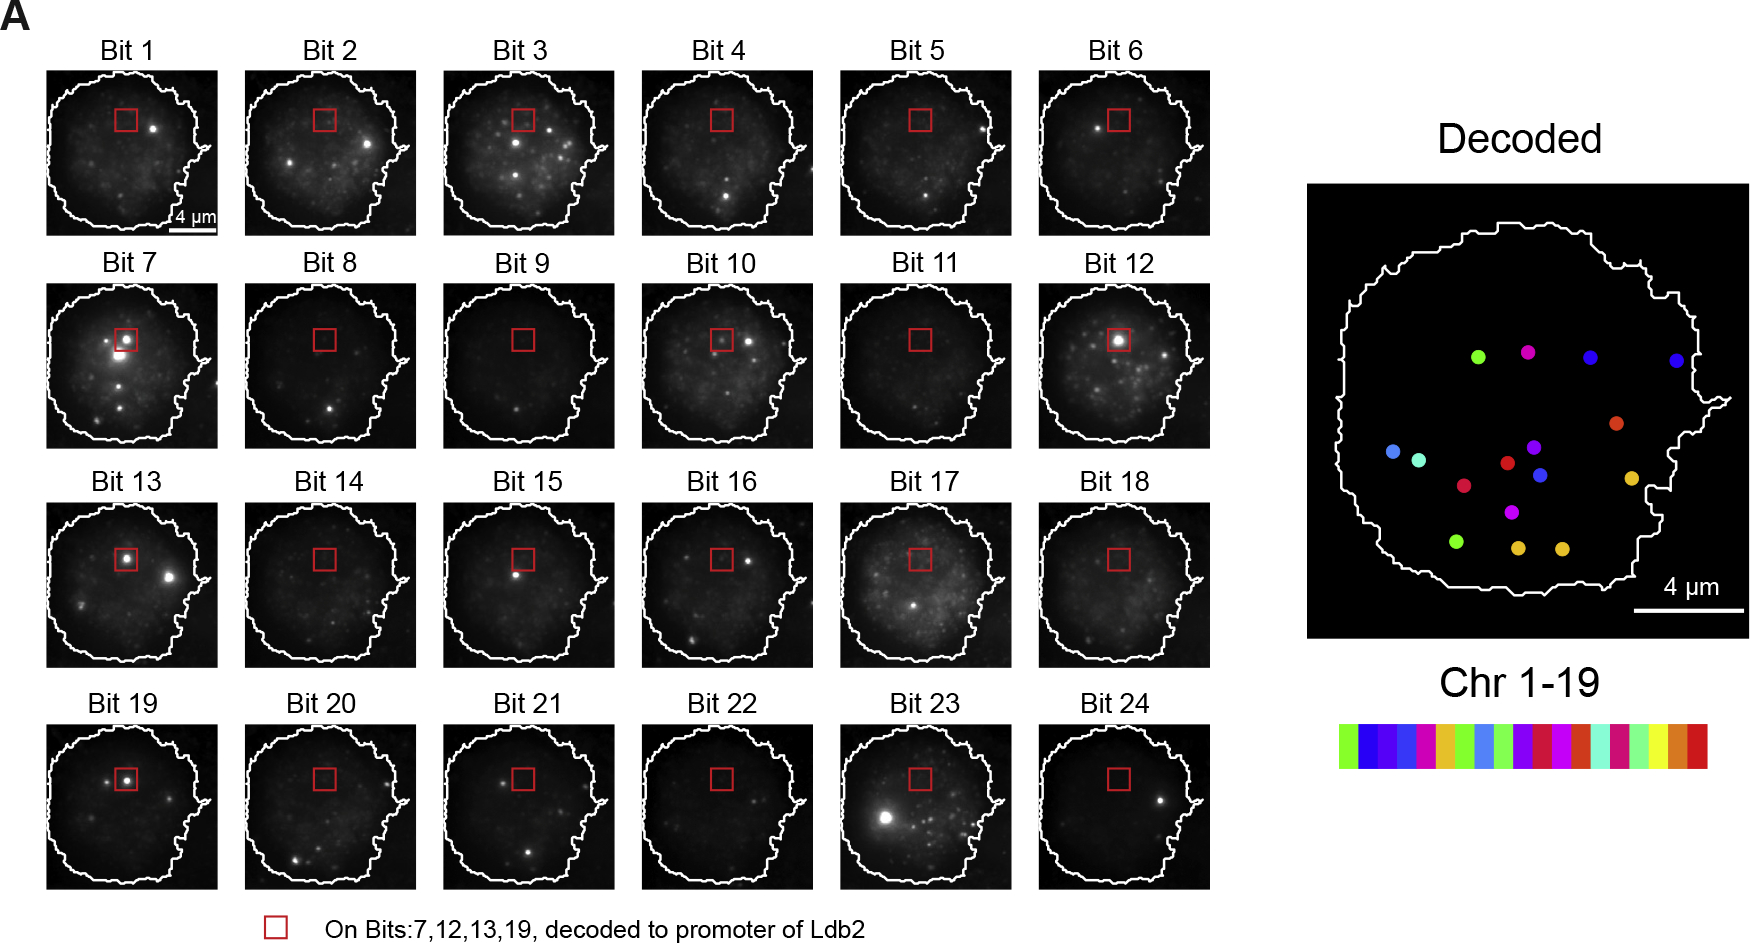
Figure 2A. Spatially resolved single-cell profiling of layer-specific active promoters in adult mouse cortex (original).
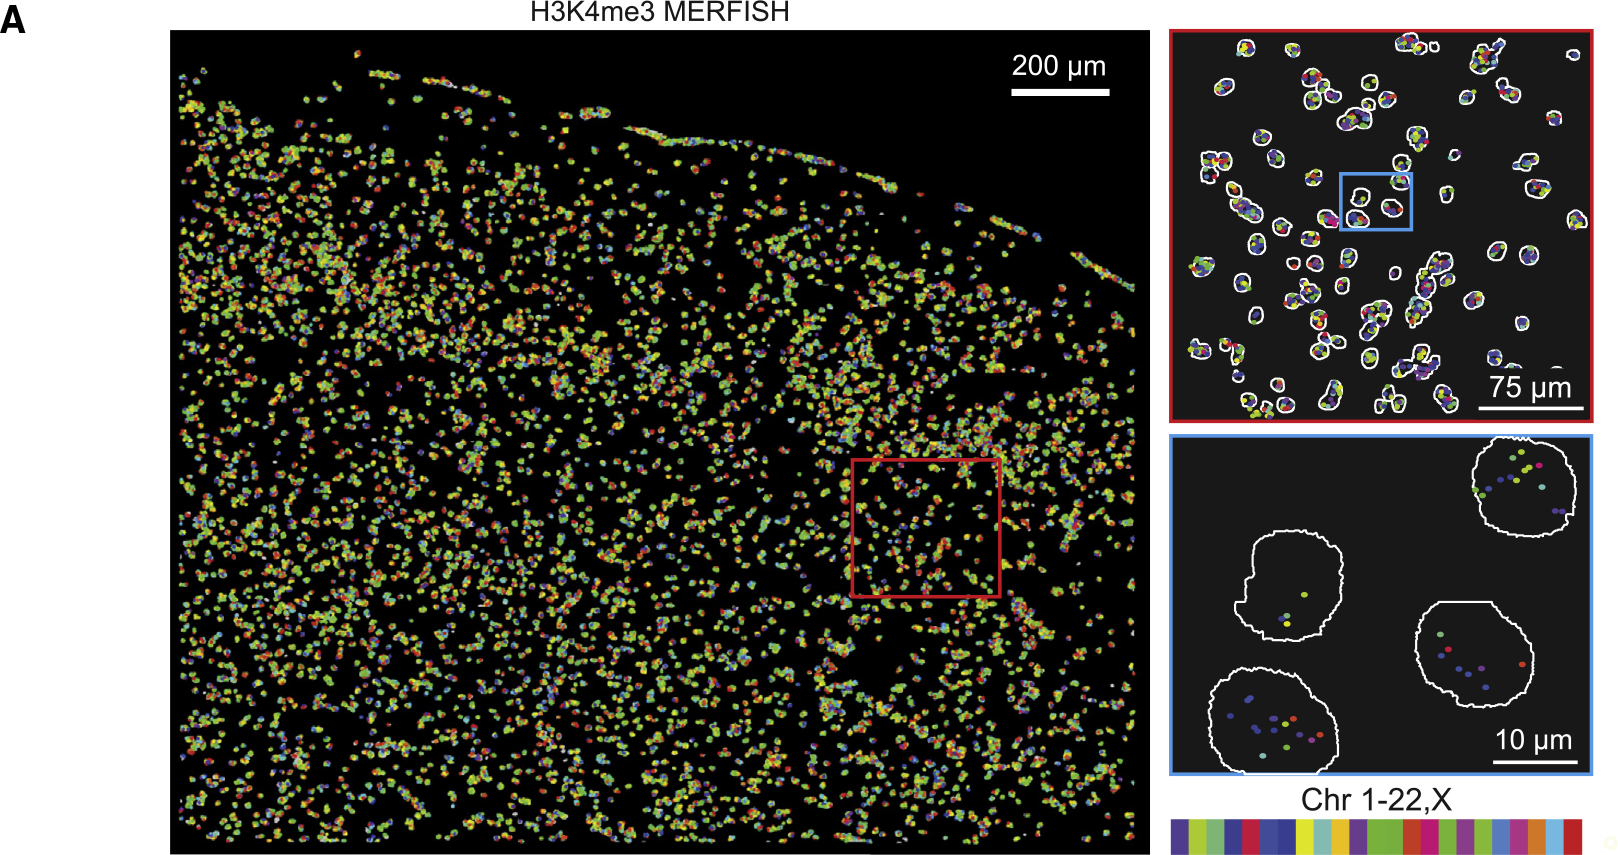
Figure 3A. Spatially resolved profiling of active promoters in mouse embryonic brain (original).
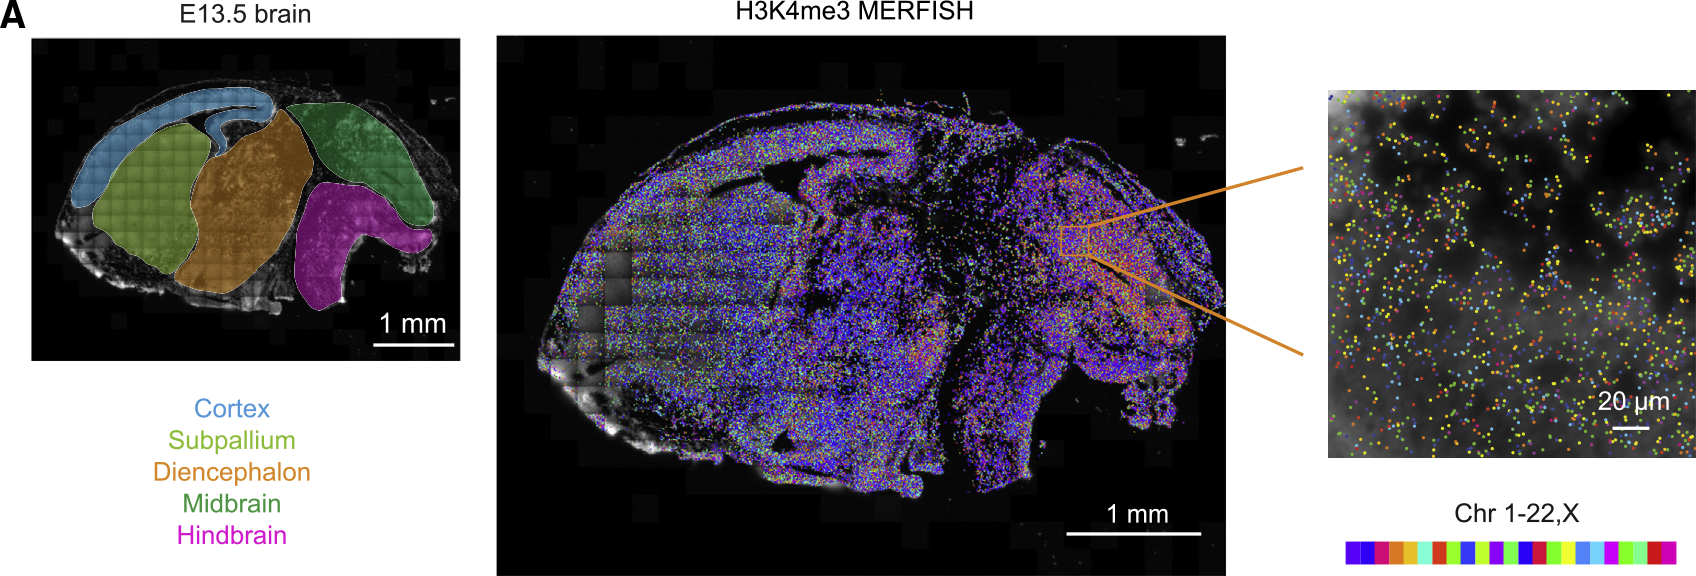
Figure 4A. Spatially resolved single-cell profiling of layer-specific putative active enhancers in adult mouse cortex (original).
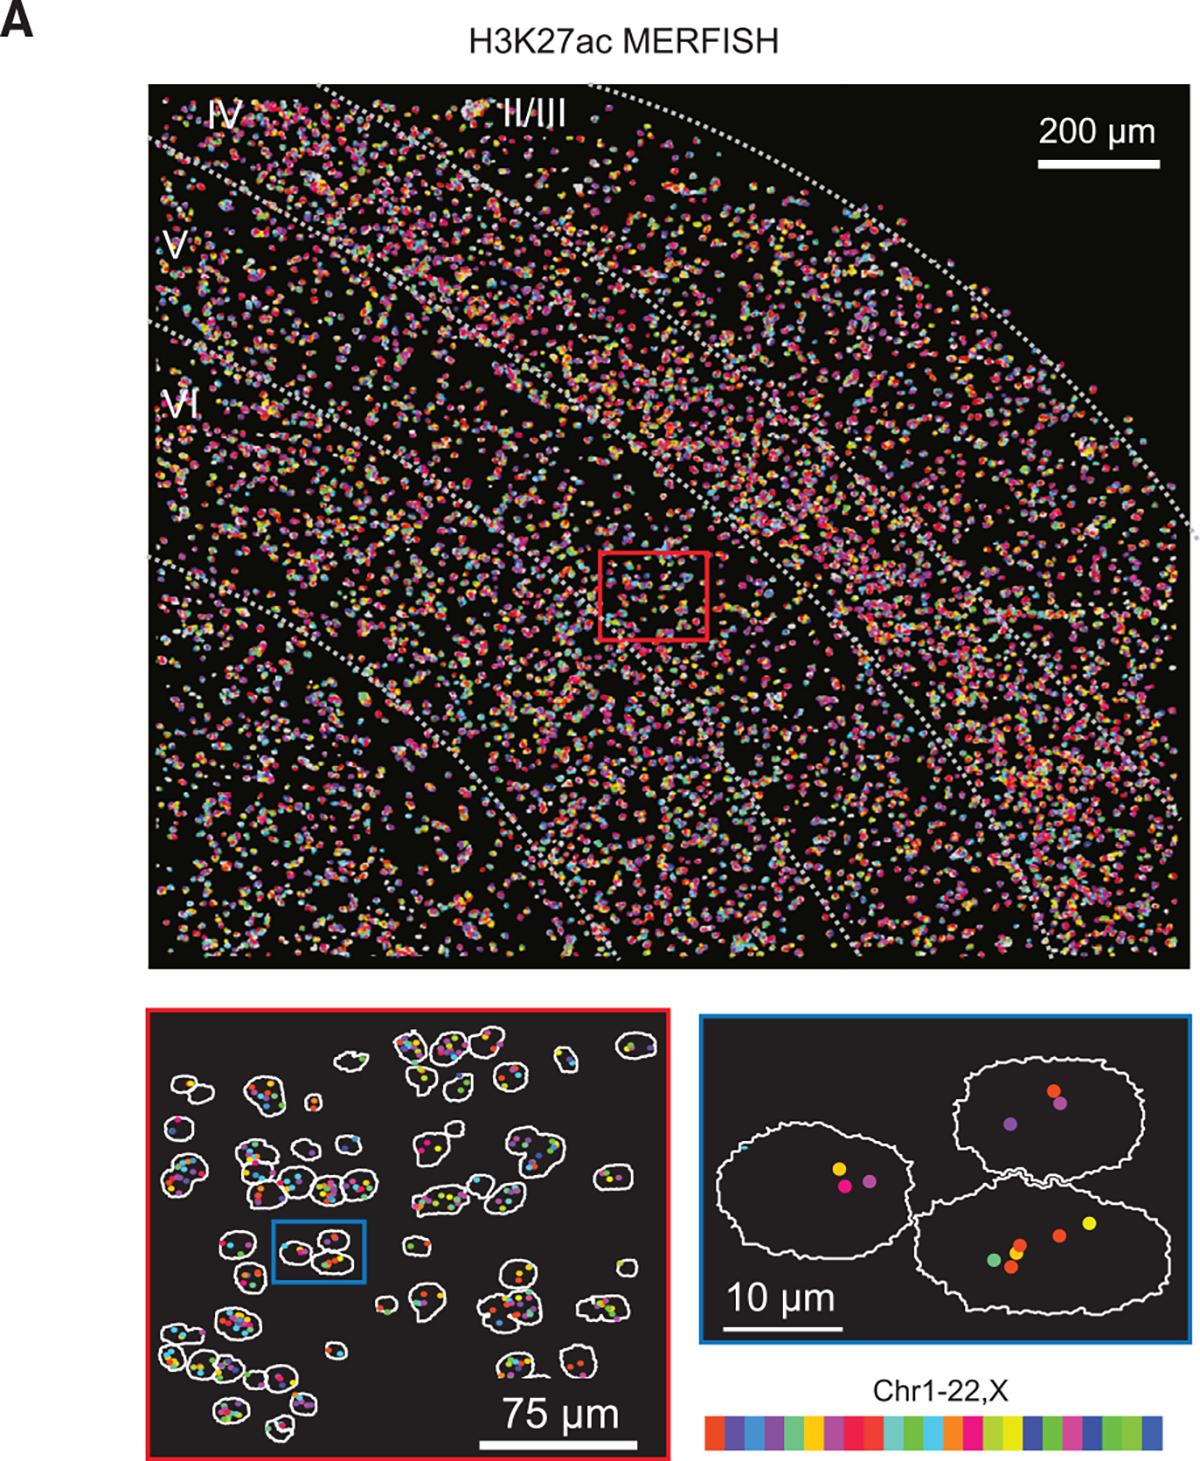
Figure S2A. The performance of epigenomic MERFISH imaging of mouse brain tissues (original).
