

Abstract
We present a multifaceted approach to effectively probe complex local protein environments utilizing the vibrational reporter unnatural amino acid (UAA) 4-cyano-L-phenylalanine (pCNPhe) in the model system superfolder green fluorescent protein (sfGFP). This approach combines temperature-dependent infrared (IR) spectroscopy, X-ray crystallography, and molecular dynamics (MD) simulations to provide a molecular interpretation of the local environment of the nitrile group in the protein. Specifically, a two-step enantioselective synthesis was developed that provided an 87% overall yield of pCNPhe in high purity without the need for chromatography. It was then genetically incorporated individually at three unique sites (74, 133, and 149) in sfGFP to probe these local protein environments. The incorporation of the UAA site-specifically in sfGFP utilized an engineered, orthogonal tRNA synthetase in E. coli using the Amber codon suppression protocol, and the resulting UAA-containing sfGFP constructs were then explored with this approach. This methodology was effectively utilized to further probe the local environments of two surface sites (sites 133 and 149) that we previously explored with room temperature IR spectroscopy and X-ray crystallography and a new interior site (site 74) featuring a complex local environment around the nitrile group of pCNPhe incorporated at this site. Site 133 was found to be solvent-exposed while site 149 was partially buried. Site 74 was found to consist of three distinct local environments around the nitrile group including hydrogen-bonding to a histidine side chain, hydrogen-bonding to a structural water, and nonspecific van der Waals interactions.
Graphical Abstract

INTRODUCTION
The sensitivity of the vibrational frequency of the nitrile group in the unnatural amino acid (UAA) 4-cyano-L-phenylalanine (pCNPhe) to the local environment has long been recognized. Work by Gai and co-workers illustrated that there was a 8.7 cm−1 blue shift of the nitrile band associated with pCNPhe when the solvent the UAA was dissolved in was changed from THF to water.1 Additionally, the full-width half-maximum (fwhm) increased from 5.0 to 9.8 cm−1 upon this solvent change.1 The utility of pCNPhe as an effective probe of local environments in proteins is further supported by the nitrile stretching frequency observable occuring in a clear, transparent region of the IR spectrum and typically consisting of a single, symmetric absorption band, as well as the relatively small size of the probe.
The pCNPhe UAA can also be readily incorporated into peptides through solid-phase peptide synthesis 1–11 and genetically12–20 into proteins using the Amber codon suppression technique with no inherent size limitation. A number of groups have worked to expand our understanding of pCNPhe as a vibrational reporter in protein systems by computationally exploring the sensitivity of the nitrile symmetric stretching frequency to H-bond geometry with water,21–23 developing isotopomers of the UAA,14 characterizing the structural perturbations of incorporating pCNPhe into a protein system 10,16,17,20, and examining the temperature dependence of the nitrile stretching frequency 15,16,24,25. However, the pCNPhe is relatively expensive and previous synthesis includes two labor-intensive chromatography purifications and only proceeds with a 40% overall yield. 14,26 Thus, a more efficient low-cost synthesis would increase the utility of pCNPhe as an effective vibrational reporter.
In this study, we have site-specifically incorporated the synthesized vibrational reporter UAA, pCNPhe, individually into three unique sites in superfolder green fluorescent sfGFP (Figure 1A) using the Amber Codon Suppression methodology. The synthesis of pCNPhe was performed in an efficient and scalable manner with a high enantiomeric purity that does not require chromatography (Scheme 1). The resulting UAA containing sfGFP constructs were then analyzed via a multifaceted methodology including temperature-dependent IR spectroscopy, X-ray crystallography, and MD simulations. The combination of these techniques provides a detailed molecular picture of the local environment(s) surrounding the nitrile group of pCNPhe incorporated into sfGFP. This work builds upon previous room-temperature IR and X-ray crystallography study of two sites in sfGFP (sites 133 and 149) 17 by including temperature-dependent IR measurements and MD simulations. This combined methodology is then applied to a new interior site in sfGFP where the incorporation of pCNPhe results in three distinguishable subcomponents in the nitrile IR absorbance band. The correlation of these subcomponents to three distinct local chemical environments illustrates how pCNPhe can successfully be employed to understand complex environments within proteins.
Figure 1.

A. Structure of wildtype superfolder green fluorescent protein (PDB ID 2B3P) where three sites studied using pCNPhe are shown in sticks with Asp133 in periwinkle, Asn149 in orange, and Tyr74 in magenta. B. Temperature-dependence of the nitrile symmetric stretching frequency of Boc-pCNPhe (open squares) in THF and pCNPhe (open circles) in an aqueous buffer solution fit to a straight line (solid line). The decreased temperature range utilized for THF compared to water is the result of the lower boiling point of THF. C. Temperature-dependence of the nitrile symmetric stretching frequency of sfGFP-Asn149pCNPhe (open squares) and sfGFP-Asp133pCNPhe (open circles) in an aqueous buffer solution fit to a straight line (solid line). The frequency shifts for Panels B and C were referenced to the nitrile stretching frequency measured at 11.4 °C for each solvent or protein construct, respectively.
Scheme 1.

MATERIALS AND METHODS
General Information.
N-(diphenylmethylene)glycine tert-butyl ester and 4-cyanobenzyl bromide were purchased from Chem-Impex, the (R)-Marvoka catalyst [CAS 887938-70-7] was originally purchased from Strem and more recently purchased from Sigma-Aldrich, and trifluoroacetic acid was purchased from Oakwood. Additional reagents were purchased from Sigma-Aldrich and Hampton Research. Commercial reagents were used without further purification. Isotopically labeled 4-cyano-L-phenylalanine was synthesized as previously described. 14,26
NMR spectra chemical shifts are reported in parts per million (ppm) and coupling constants are reported in Hertz (Hz). 1H spectra in D2O were referenced to the residual HOD peak at 4.80 ppm. IR spectra were obtained as a thin film (for solid samples) on an ATR instrument and the absorption peak frequencies are reported in cm−1 and intensities as very strong (vs), strong (s), medium (m), or weak (w).
4-Cyano-N-(diphenylmethylene)-L-phenylalanine tert-butyl ester (4).
To a 500-mL round bottom flask cooled in an ice bath was added a stock solution of (R)-Marvoka catalyst in CH2Cl2 (3.0 × 10⁻³ M, 5.5 mL, 0.017 mmol, 0.050 mol%), N-(diphenylmethylene)glycine tert-butyl ester (2) (10.00 g, 0.03385 mol), toluene (111 mL), a 50% solution of aqueous KOH/H2O (111 mL), and 4-bromomethyl benzonitrile (3) (7.95 g, 0.0406 mol). The biphasic mixture was vigorously stirred at ambient temperature overnight. The mixture was extracted with diethyl ether (3×50 mL) and the combined organic layers were washed with brine (2×50 mL). The organic layer was concentrated under reduced pressure to yield 13.753 g (99%) of 4 as a white solid: IR (ATR thin film) 1143.45 (s), 1734.60 (m), 2230.08 (w), 2869.74 (s), 2988.30 (s) cm−1.
4-Cyano-L-phenylalanine hydrochloride (pCNPhe, 1).
Crude 4 (5.00 g, 0.0122 mol) was dissolved in dichloromethane (56 mL) and trifluoroacetic acid (56 mL) was added slowly while stirring. The mixture was stirred at ambient temperature for 24 h. The mixture was concentrated by reduced pressure and then partitioned between with diethyl ether and 3M HCl. The aqueous layer was washed with additional diethyl ether and then concentrated to yield 2.42 g (88%) of pCNPhe hydrochloride as a white powder. All spectral data matched literature values. 14 1H NMR (500 MHz, D2O) δ 7.74 (d, J = 8.3, 2H), 7.47 (d, J = 8.3, 2H), 4.39 (dd, J = 7.5, J = 6.1, 1H), 3.41 (dd, J = 14.6, J = 5.8, 1H), 3.31 (dd, J = 14.6, J = 7.3, 1H) ppm; IR (ATR thin film) 3413.7 (br m), 2988.3 (s), 2869.7 (s), 2230.1 (m), 1734.6 (m), 1625.7 (m), 1392.2 (m), 1143.5 (s), 1075.0 (m), 845.1 (w), 696.0 (m) cm−1.
Expression and Purification of pCNPhe-containing sfGFP Constructs.
Wild-type sfGFP (wt-sfGFP) with a C-terminal six-His affinity tag in a pBAD expression vector and pDULE plasmid containing the tRNA and aminoacyl tRNA synthetase for pCNPhe incorporation was obtained from Dr. Ryan A. Mehl at Oregon State University. The codons for Asp133, Asn149, and Tyr74 were individually replaced with the TAG codon via site-directed mutagenesis, creating the following constructs: pBAD-sfGFP-Asp133TAG, pBAD-sfGFP-Asn149TAG, and pBAD-sfGFP-Tyr74TAG. To create the construct in which the histidine residue at site 199 is replaced with a leucine, the pBAD-sfGFP-Y74TAG mutant plasmid was further modified via site-directed mutagenesis, creating the following construct: pBAD-sfGFP-Tyr74TAG_His199Leu. All plasmids of sfGFP constructs in the pBAD vector were confirmed with Sanger sequencing (Quintara Biosciences) and co-transformed into chemically competent DH10B E.coli cells with the pDULE vector containing the pCNPhe incorporation machinery. Transformed cells were used to inoculate 5 mL of LB broth containing 100 μg/mL ampicillin and 25 μg/mL tetracycline, and were allowed to shake overnight to saturation at 250 rpm, 37°C. A 2.5 mL aliquot of overnight cell culture was used to inoculate 250 mL of autoinduction media27 containing 100 μg/mL ampicillin and 25 μg/mL tetracycline. Autoinduction media also contained pCNPhe at a concentration of 1.1 mM per TAG codon. Cells were left to shake at 37°C and 250 rpm for 24–30 hours and were then collected via centrifugation. Protein was extracted and purified from sonication-lysed cell pellets using TALON cobalt affinity chromatography, as detailed in previous work.17 Site-specific incorporation of pCNPhe at sites 133, 149, and 74 of sfGFP resulted in the following protein constructs: sfGFP-Asp133pCNPhe, sfGFP-Asn149pCNPhe, sfGFP-Tyr74pCNPhe, and sfGFP-Tyr74pCNPhe_His199Leu.
PD-10 gel filtration columns were used to desalt purified protein into an aqueous 20 mM HEPES buffer with a pH of 7.5. A catalytic amount of Trypsin (1%) was added to purified protein samples in order to cleave the C-terminal six-His affinity tag. The protein/trypsin mixture was left to incubate at 37°C for 2 hours. In order to deactivate the trypsin, phenylmethanesulfonyl fluoride was added to the mixture in a tenfold molar excess with respect to trypsin. TALON cobalt affinity chromatography was used to separate His-cleaved sfGFP from protein that had not undergone complete cleavage of the six-His affinity tag. Protein was concentrated using a 10K molecular-weight cutoff Centricon (Millipore) and stored in 20 mM HEPES pH 7.5.
Mass Spectral Analysis.
Purified sfGFP constructs were desalted into water using Zeba 7K MWCO desalting columns and formic acid was added to a concentration of 0.1% in preparation for Mass Spectral analysis. Samples were first separated with an Acquity H series UPLC employing a Waters Protein BEH C4 300 Å 1.7 mm 1 × 50 mm column, followed by ESI-Q-TOF mass analysis of the intact protein performed with a Waters Xevo G2-S mass spectrometer. To obtain intact protein masses, raw mass spectral data from the protein charge state envelope was deconvoluted using MaxEnt1 processing as part of the Waters MassLynx V4.1 software package. Deconvoluted protein mass values were confirmed by manual inspection of the raw mass spectral data.
Temperature Dependent Equilibrium FTIR Measurements.
Temperature dependent equilibrium FTIR absorbance spectra were recorded on a Bruker Vertex 70 FTIR spectrometer equipped with a globar source, KBr beamsplitter, and a liquid nitrogen cooled mercury cadmium telluride (MCT) detector. The spectra were measured using a transmission cell consisting of calcium fluoride (CaF2) windows with a path length of approximately 50 μm at a resolution of 1 cm−1. The two compartment, temperature-controlled sample cell was mounted onto a motorized translation stage so that spectra of the sample and reference can be acquired under essentially the same conditions. The absorbance spectra were the result of multiples of 128 scans and the temperature was measured using an embedded thermocouple in the cell. The spectra were intensity normalized and baseline corrected. Line shape analysis was performed using Igor Pro (Wavemetrics). The sample concentrations and buffer conditions are provided in the text and figure legends for each sample.
Crystallization, X-ray Diffraction Data Collection, and Structural Refinement.
Purified sfGFP-Tyr74pCNPhe was concentrated to 30 mg mL−1 (1.1 mM) in 20 mM HEPES pH 7.5 and mixed with precipitant solution (0.2 M MgCl2, 0.1 M Tris-HCl pH 8.5, 25% PEG 3350) in a 1:1 ratio and crystallized using the sitting drop vapor diffusion method. Crystals were looped through precipitant solutions augmented with 8%, 15%, and 25% ethylene glycol to cryoprotect the crystals without causing them to crack during cryoprotection. X-ray diffraction data were collected using the NE-CAT 24-ID-E beamline at the Advanced Photon Source (APS) synchrotron at Argonne National Laboratory (Table S2). Data for sfGFP-Tyr74pCNPhe were processed in space group P6122 to a 1.51 Å resolution using XDS.28
Molecular replacement was performed using Phaser29 with a model of wild type sfGFP (PDB ID: 2B3P)30 where the tyrosine residue at site 74 was modified to an alanine, resulting in a top LLG score of 3213.9 and TFZ score of 51.8. Refinement was performed in PHENIX31 interspersed with manual rounds of refinement in Coot.32 Following a few rounds of refinement, a phenylalanine was modeled into the 2Fo–Fc density at residue 74. In the subsequent round of refinement, a nitrile group was modeled at the para position of the phenylalanine using the Fo–Fc difference density and further rounds of refinement included the associated parameter file for pCNPhe, 4CF. The 2Fo–Fc and Fo–Fc density surrounding histidine 199 suggested multiple conformations, so two conformations were modeled for His199. Clashes between side chains Gln204 and Phe223 of neighboring symmetry-related molecules resulted in modeling two conformations for each of these residues and fixing the location and occupancies (50% per conformer) for all atoms. These restraints prevented the Phe223 residue from exploding upon refinement, reduced the degree of steric clash in the region, and produced the difference density maps with the least amount of difference density in this region. Several additional rounds of manual refinement and automatic refinement included adding 230 water molecules, 4 Mg2+ ions, 5 ethylene glycol molecules, and a diethylene glycol molecule (to mimic an ordered portion of the PEG precipitant). The final R/Rfree of the structure was 20.4/24.7 % with no outliers in the Ramachandran plot.
Molecular Dynamic Simulations.
Partial atomic charges for the pCNPhe residue were derived by generating α and β backbone conformers of a capped pCNPhe dipeptide, optimizing these conformations at the HF/6–31G* level of theory, and then calculating the molecular electrostatic potentials of these structures at the same level of theory.33 All electronic structure calculations were performed using GAMESS-US 2014 R1.34 Charges were fit to the molecular electrostatic potentials using the RESP method, as implemented in R.E.D.35 GAFF 1.81 parameters were used for all interactions involving the nitrile group atoms.36 AMBER ff14SB/GAFF-compatible residue (lib) and parameter (frcmod) files for pCNPhe are included in the Supporting Information.
Initial structures for all sfGFP mutant proteins were constructed using the PDB structure 5DPG as a template. The four N-terminal residues that are missing in 5DPG were built back into the structure using Swiss-PdbViewer.37 Then a pCNPhe residue was placed at the appropriate location (residue 74, 133, or 149) for each variant. The initial structures also contained all of the crystallographic water molecules present in 5DPG. This meant that two water molecules, HOH426 and HOH463 (in 5DPG), were in close proximity (<4.0 Å) to the nitrile group of residue 74 in both sfGFP-Tyr74pCNPhe and sfGFP-Tyr74pCNPhe_His199Leu. Importantly, these two water molecules are also present in the published wt-sfGFP crystal structure (2B3P).30 To determine what, if any, effects these water molecules might have on the structural dynamics of residue 74, we also created initial structures of these variants in which these two water molecules were deleted.
All sfGFP mutant proteins were built using the tleap program of AmberTools 1938 and the AMBER ff14SB force field.39 We used the unpublished GFP chromophore parameters of the Krueger group provided with the AmberTools 19 distribution. Each protein was solvated in a truncated octahedron of TIP3P water molecules40 and neutralized by the addition of 7 sodium ions using Joung-Cheatham monovalent ion parameters for TIP3P.41
All energy minimizations and MD simulations were performed using pmemd and pmemd.cuda of Amber 18. Periodic boundary conditions were used with a 9.0 Å cutoff for real space nonbonded interactions, PME for long-range electrostatics, and an analytic correction for long-range van der Waals interactions. First, each system was minimized with 500 steps of steepest descent minimization, followed by 500 steps of conjugate gradient minimization. During this phase of minimization, the protein atoms were restrained with a harmonic force constant of 10.0 kcal mol−1 Å−2. Next, the same amount of minimization was performed without restraints.
The subsequent molecular dynamics simulations were performed using a 2.0 fs time step and with SHAKE to constrain all bonds with hydrogen atoms. First, the systems were heated linearly from 100 K to 298.15 K over 20 ps with an additional 20 ps of NVT equilibration using a Langevin thermostat with a coupling constant of 1.0 ps−1. Next, 50 ps of NPT equilibration was performed at the same temperature and with a pressure of 1.013 bar using a Berendsen barostat with a coupling constant of 2.0 ps−1. During the heating and equilibration steps, the peptides were again restrained with a harmonic force constant of 10.0 kcal mol−1 Å−2. A final NPT equilibration was performed for 200 ps using a Monte Carlo barostat, with volume swaps attempted every 100 steps (200 fs). Production simulations were performed for 1.25 μs, with trajectory snapshots saved every 10 ps. The first 0.25 μs of these production simulations were discarded as a period for structure relaxation. For all six simulations, the median backbone RMSD was between 1.15 Å and 1.48 Å and displayed no discernible trend during the 1.0 μs period used for structural analysis, suggesting that the 0.25 μs relaxation period was adequate and that there were no significant changes in tertiary structure (Figure S3).
RESULTS AND DISCUSSION
Efficient Enantioselective Synthesis of 4-Cyano-L-Phenylalanine.
The widespread use of 4-cyano-L-phenylalanine (1, pCNPhe) as a vibrational reporter and its relatively high price, at least historically, led us to explore an efficient synthesis and would be easily done on large scale. A previous synthesis of pCNPhe required four steps and proceeded in 40% overall yield. 14 26 An advantage of the literature synthesis is that the nitrile was introduced using a nickel-zinc catalyst to couple potassium cyanide with the aromatic triflate, thus making it amenable to preparing isotopomers. However, the low yield and the need for time-consuming flash column chromatography purification for two of the synthetic intermediates made the scale-up of this method challenging. Another synthesis of pCNPhe utilized an enantioselective alkylation of a protected glycine using a chiral phase-transfer catalyst (PTC) 42 and, more recently, a multienzymatic amination and deracemization cascade process has been developed to produce pCNPhe.43
We chose to further investigate the chiral PTC route. Early work on this method by O’Donnell 44 led the way for later improvements by the Corey, Maruoka, and Jew groups.42,45,46 Our initial experiments tested both cinchona alkaloid and binaphthyl chiral PTCs. The latter catalyst 46 gave better results in our hands. Thus, alkylation of protected glycine 2 (10 g scale) with 4-bromomethylbenzonitrile using the (R)-Maruoka quaternary ammonium PTC at ambient temperature provided a nearly quantitative yield of nitrile 4 after a separatory funnel workup (Scheme 1). The purity of 4 was sufficient to be carried on to the final deprotection step. After brief experimentation, it was found that the best deprotection conditions involved stirring 4 with trifluoroacetic acid and dichloromethane (1:1) at ambient temperature for 24 hours. This furnished an 88% yield of the hydrochloride salt of pCNPhe as a remarkably pure white solid after a separatory funnel workup to remove the liberated benzophenone. This two-step synthesis is operationally simple and reliably produced multigram quantities of pCNPhe•HCl. Many different students have completed this synthesis over the course of the past five years. The enantiomeric purity of pCNPhe•HCl was not determined, but based on literature data 46,47 it likely is in the 80–99%ee range. Thus, even at 80%ee, the L-enantiomer accounts for 90% of the product. Initial attempts to extend this method to other important vibrational reporters were unsuccessful.
Solvent and Temperature Dependence of Nitrile Stretching Frequency of pCNPhe.
Figure S1 illustrates sensitivity of the nitrile stretch frequency to solvent for N-(tert-butoxycarbonyl)-4-cyano-L-phenylalanine (Boc-pCNPhe) dissolved in THF (open squares) and 4-cyano-L-phenylalanine (pCNPhe) dissolved in an aqueous buffer (open circles). These solvents were selected to mimic desolvated, low dielectric (THF) and fully solvated, high dielectric (water) local protein environments while the Boc protecting group was utilized for solubility in THF. Both IR spectra show a single, symmetric IR absorbance band in the region of the nitrile symmetric stretching frequency that was fit with a linear combination of a Gaussian and Lorentzian function (solid curves). Notably, the nitrile symmetric stretching frequency blue shifts from 2228.3 cm−1 for Boc-pCNPhe dissolved in THF to 2237.0 cm−1 for pCNPhe dissolved in aqueous buffer at 20.5 °C due to hydrogen bonding between water and the nitrile group of pCNPhe in the aqueous buffer. This 8.7 cm−1 blue shift is also accompanied by an increase in the full-width half-maximum (fwhm) from 5.7 cm−1 to 10.2 cm−1 upon going from THF to water as the solvent. The magnitude and direction of this shift in addition to the increase in full-width half-maximum of the nitrile IR absorbance band is consistent with previous studies on the dependence of the nitrile IR absorbance band on solvent.1
The temperature dependence of the nitrile stretching frequency of this vibrational reporter UAA in THF (open squares) and aqueous buffer (open circles) is given in Figure 2B. The slope of the best fit line (solid line) for the frequency shift of Boc-pCNPhe in THF was 5×10⁻⁵ cm−1/°C, while the slope of the best fit line for pCNPhe in aqueous buffer was −4.4×10⁻² cm−1/°C. The corresponding temperature dependent IR absorbance spectra for each of these solvents are given in the Supporting Information (Figures S2 and S3). The significantly larger magnitude of the slope (also referred to as frequency temperature line slope or FTLS)25 for pCNPhe dissolved in aqueous buffer is the result of the sensitivity of the nitrile symmetric stretch frequency to the geometry of hydrogen-bonding between the nitrile group of pCNPhe and solvent water molecules. In contrast, the nitrile symmetric stretch frequency of Boc-pCNPhe dissolved in THF is essentially temperature-independent due to the absence of specific interactions between the nitrile group of Boc-pCNPhe and THF solvent molecules. The direction and relative magnitudes of these temperature-dependent shifts in the nitrile stretching frequency of this vibrational UAA are in agreement with previous studies. 15,16,25,48 These solvent and temperature dependencies of the nitrile stretching frequency of this unnatural amino acid will serve as a reference to aid in the interpretation of the room temperature nitrile symmetric frequency and corresponding temperature dependence of this vibration of pCNPhe incorporated into various environments in sfGFP.
Figure 2.

Time series of normalized solvent accessible surface area (SASA) of pCNPhe side chain atoms from MD simulations of sfGFP-Asp133pCNPhe (blue) and sfGFP-Asn149pCNPhe (red).
Probing Two Exterior Sites in sfGFP.
IR Analysis of sfGFP-Asp133pCNPhe and sfGFP-Asn149pCNPhe.
Figure S2 highlights the sensitivity of the nitrile stretch vibration of pCNPhe to different local protein environments in sfGFP. Specifically, this figure compares the room temperature IR spectrum in the 2210 to 2260 cm−1 region of sfGFP-Asn149pCNPhe (open squares) and sfGFP-Asp133pCNPhe (open circles) in an aqueous buffer (20 mM Hepes, pH 7.5). Both protein constructs show a single, symmetric IR absorbance band in this region corresponding to the nitrile symmetric stretch vibration of the incorporated pCNPhe UAA similar to previous work in our group.14,17 The nitrile symmetric stretching frequency occurs at 2228.2 cm−1 for sfGFP-Asn149pCNPhe and 2236.1 cm−1 for sfGFP-Asp133pCNPhe. Similarly, the full-width half-maximum of the nitrile IR absorbance band increases from 9.9 to 12.5 cm−1 upon going from sfGFP-Asn149pCNPhe to sfGFP-Asp133pCNPhe. The position and fwhm of the nitrile IR absorbance band for sfGFP-Asn149pCNPhe and sfGFP-Asp133pCNPhe suggests that the nitrile group of pCNPhe is relatively buried from solvent at site 149 compared to being fully solvated at site 133. This conclusion is based primarily upon the comparison of the positions of the nitrile IR absorbance band of Boc-pCNPhe in THF and pCNPhe in aqueous buffer to the nitrile IR absorbance band of the protein constructs in aqueous buffer. Specifically, the nitrile symmetric stretching frequency of the fully solvated nitrile group of pCNPhe in aqueous buffer (2237.0 cm−1) is similar to the nitrile symmetric stretching of pCNPhe in sfGFP-Asp133pCNPhe (2236.1 cm−1). In contrast, the nitrile symmetric stretching frequency of pCNPhe at site 149 (2228.2 cm−1) is nearly the same as the stretching frequency of Boc-pCNPhe in THF (2228.3 cm−1) and pCNPhe in DMSO (2225.8 cm−1) 17, both of which represent hydrophobic environments. Similarly, the fwhm is larger for sfGFP-Asn133pCNPhe compared to sfGFP-Asp149pCNPhe, which matches the greater observed fwhm for pCNPhe dissolved in aqueous buffer compared to Boc-pCNPhe dissolved in THF. The extent of solvation of the nitrile group of pCNPhe at sites 133 and 149 is further examined below.
The local environment of the nitrile group of pCNPhe at sites 149 and 133 in sfGFP was further assessed by temperature dependent IR spectroscopy expanding upon previous work in our group.17 The corresponding temperature dependence of the nitrile symmetric stretching frequency of pCNPhe incorporated at these two sites in sfGFP is shown in Figure 1C. The slope of the linear fit (solid lines) for sfGFP-Asn149pCNPhe (open squares) and sfGFP-Asp133pCNPhe (open circles) were −2.5±0.1×10⁻² cm−1/°C and −4.2±0.1×10⁻² cm−1/°C, respectively. The different frequency temperature line slopes (FTLS)15,16,20,25,48 further illustrate that the nitrile group in these two protein constructs are in distinct local environments. Specifically, the FTLS of sfGFP-Asp133pCNPhe is similar to the FTLS of pCNPhe dissolved in aqueous buffer (−4.4×10⁻² cm−1/°C) while the FTLS of sfGFP-Asn149pCNPhe is shifted towards the FTLS of Boc-pCNPhe dissolved in THF (5×10⁻⁵ cm−1/°C). The corresponding temperature dependent IR absorbance spectra for sfGFP-Asp133pCNPhe and sfGFP-Asn149pCNPhe are given in the Supporting Information (Figures S6 and S7). Given the intermediary FTLS value of sfGFP-Asn149pCNPhe and the sensitivity of the nitrile symmetric stretching frequency to hydrogen bonding between the nitrile group of pCNPhe and water solvent molecules, the nitrile group of pCNPhe incorporated at site 149 is classified as partially buried.
X-Ray Crystallographic Analysis.
The structures of sfGFP-Asp133pCNPhe and sfGFP-Asn149pCNPhe with the 6X His-tag removed have previously been reported by our group. 17 These published structures provide snapshots of these protein constructs with pCNPhe incorporated that permit the solvent accessibility of the pCNPhe residues in each site to be assessed directly (Figure S8). The 133 site was found to be 89% solvated while the 149 site was found to be 53% solvated following refinement of each of these structures as calculated by GETAREA.17,49 These solvation percentages are in good agreement with the IR analysis of either site – the 133 site is highly solvent-accessible and the 149 site is less accessible to solvent. In addition, a structural comparison of analysis of sfGFP-Asp133pCNPhe or sfGFP-Asn149pCNPhe with the wildtype sfGFP structure indicated very little structural change upon incorporation of pCNPhe,17 supporting that this vibrational reporter is minimally perturbative to native protein structures.
Molecular Dynamics Analysis.
In concert with the analysis of the crystal structures of sfGFP-Asp133pCNPhe and sfGFP-Asn149pCNPhe, MD simulations were performed of the same proteins. Our goal was two-fold: to see if the simulations could provide credible molecular explanations for the IR spectra of pCNPhe in these proteins and also to see to what extent the dynamical simulations might agree with the static crystal structures. The normalized solvent accessible surface area (SASA) of the pCNPhe side chain over the duration of each simulation was calculated by first calculating the SASA of the pCNPhe side chain in each protein and then dividing that by the mean SASA of a pCNPhe side chain taken from a 250 ns MD simulation of a free capped dipeptide (i.e., Ace-pCNPhe-NMe). A normalized SASA value of 1 would indicate a pCNPhe side chain that is as solvent-exposed as in the dipeptide (on average), whereas a value of 0 would be completely inaccessible to solvent. The mean normalized SASA of pCNPhe in the 133 site is 0.925 (standard deviation: 0.056), while in the 149 site it is 0.45 (standard deviation: 0.14). These data suggest that the 133 site is highly solvent-exposed with little variation in environment, whereas the 149 site is partially occluded with greater variation in environment. These data are in agreement with the pCNPhe solvent accessibilities obtained from the X-ray crystal structures and inferred from the IR data, although it is clear that there are substantial fluctuations in the solvent accessibilities, particularly in the case of sfGFP-Asn149pCNPhe (Figure 2).
To better understand the origins of the differing normalized SASAs – and therefore the difference in IR spectra between the two proteins – the MD simulation trajectories were further analyzed to determine which heavy atoms of the protein were within 4.0 Å (i.e., close contacts) of the nitrile group of the pCNPhe side chain. In sfGFP-Asp133pCNPhe, the Glu132 side chain is a close contact of pCNPhe, although this occurs in fewer than 10% of the trajectory frames and is not a long-lived interaction, as is also supported by the fractional SASA time series (Figure 2). In sfGFP-Asn149pCNPhe, however, there is a substantially different picture. While there are constant close contacts from other residues on the beta sheet that site 149 is located on, there are also transient close contacts with the disordered C-terminus of the protein (residues 231–236) that are present in up to ~20% of the trajectory frames. Because of the disordered nature of the C-terminus, it is likely that this percentage is not well-converged, which is also apparent in the fluctuations of the fractional SASA time series (Figure 2). Nonetheless, this analysis provides at least a qualitative sense of the intra-protein contacts that might explain the observed differences in the IR spectra for these two proteins. Importantly, there is no interaction observed between site 149 and the C-terminus of the protein in the X-ray crystal structure (5DPH), highlighting the utility of MD simulations to understand the contribution of disordered regions to the experimentally measured IR spectra.
Probing an Interior Site in sfGFP.
IR Analysis of sfGFP-Tyr74pCNPhe.
Figure 3 shows the room temperature IR spectrum in the region of the nitrile symmetric stretching frequency for sfGFP-Tyr74pCNPhe. This construct was confirmed by mass spectrometry having an observed mass of 26869.0 Da, in agreement with the predicted mass. The IR spectrum of sfGFP-Tyr74pCNPhe shows a relatively complex absorption profile relative to the single, symmetric IR absorbance band observed in the IR spectrum in this region for sfGFP-Asn149pCNPhe and sfGFP-Asp133pCNPhe. Specifically, the IR absorbance band in this region for sfGFP-Tyr74pCNPhe consists of at least three subcomponents (Figure 3, lower right; Table 1). These central frequencies suggest three distinct local protein environments of the nitrile group of pCNPhe incorporated at site 74 of sfGFP.
Figure 3.

Room temperature FTIR spectra of pCNPhe (open circles), pC15NPhe (open squares), or p13CNPhe (open triangles) incorporated at site 74 in sfGFP dissolved in an aqueous buffer (20 mM Hepes, pH 7.5) at a concentration of ~1 mM. The spectra were intensity normalized, baseline corrected, and fit with a linear combination of Gaussian and Lorentzian functions. The overall fit is shown as a solid curve while the three subcomponents for each spectrum are shown as dashed curves.
Table 1.
Nitrile stretching frequencies, isotopic shifts, and full-width half-maximum (fwhm) values for the three subcomponents of the nitrile IR absorbance band for sfGFP-Tyr74pCNPhe and its isotopomers.
| Protein Construct | Nitrile Frequencies (cm−1) | Isotopic Red Shift (cm−1) | fwhm (cm−1) |
|---|---|---|---|
| sfGFP-Tyr74pCNPhe | 2224.5, 2232.0, 2238.5 | N/A | 7.7, 8.2, 5.4 |
| sfGFP-Tyr74pC15NPhe | 2196.5, 2203.8, 2211.7 | 28.0, 28.2, 26.8 | 7.0, 10.4, 5.9 |
| sfGFP-Tyr74p13CNPhe | 2171.4, 2179.0, 2186.5 | 53.1, 53.0, 52.0 | 6.9, 9.3, 5.8 |
To rule out the possibility that the complexity in the absorption profile of sfGFP-Tyr74pCNPhe is from accidental Fermi resonance between the nitrile symmetric stretch fundamental and a near-resonant combination band, 15N and 13C isotopomers of pCNPhe were individually incorporated into this site in sfGFP. The premise being that if accidental Fermi resonance was the cause of the IR band complexity, then shifting the nitrile fundamental symmetric stretch vibration through isotopic editing would shift this mode away from the near-resonant combination bands giving rise to the complexity in sfGFP-Tyr74pCNPhe. This premise is based upon previous work showing the modulation of the IR absorption profile of vibrational reporters upon isotopic editing.50 Thus, the IR absorption profile is expected to change with isotopomers of pCNPhe incorporated at site 74 in sfGFP if accidental Fermi resonance resulted in the observed IR absorption band. However, if the profile of the IR absorbance band in the nitrile symmetric stretching region remains essentially unchanged - other than the corresponding isotopic shift - this would suggest that the three subcomponents observed for sfGFP-Tyr74pCNPhe were the result of three distinct local environments of the nitrile vibrational reporter of pCNPhe at this site in the protein.
Figure 3 shows that the absorption profiles for sfGFP-Tyr74pC15NPhe and sfGFP-Tyr74p13CNPhe consists of three subcomponents similar to sfGFP-Tyr74pCNPhe with similar fwhm values although the profiles are red shifted as expected14 compared to the corresponding IR absorption band for sfGFP-Tyr74pCNPhe due to the increased reduced mass of the C15N and 13CN oscillators relative to the 12C14N oscillator of pCNPhe (Table 1). This result suggests that these three subcomponents are not the result of accidental Fermi resonance but rather are the result of three distinct local environments of the nitrile group of pCNPhe at site 74 of sfGFP. The central frequencies of 2224.5, 2232.0, and 2238.5 cm−1 for sfGFP-Tyr74pCNPhe suggests that the local environments of the nitrile reporter group are buried, partially buried, and involved in a hydrogen bond interaction between the nitrile group and either a water molecule or an amino acid side chain or backbone, respectively.
Temperature dependence IR spectroscopy was utilized to better correlate the three subcomponents of the nitrile IR absorbance band of sfGFP-Tyr74pCNPhe to local protein environments. Figure 4 shows the temperature-dependence of the central frequencies of the three subcomponents while the corresponding temperature dependent IR absorbance spectra are shown in Figure S9. The FTLS of the low, intermediate, and high frequency components are −0.5±0.3×10⁻² cm−1/°C, −1.8±0.2×10⁻² cm−1/°C, and −4.0±0.3×10⁻² cm−1/°C, respectively. These slopes suggest that the nitrile group giving rise to the low frequency component is in a relatively buried (hydrophobic), desolvated environment; the nitrile group giving rise to the intermediate frequency is in a partially buried environment or involved in a weak hydrogen bond; and the nitrile group giving rise to the high frequency component is involved in a hydrogen-bond interaction. These correlations are based upon the FTLS values of pCNPhe in an aqueous solution and Boc-pCNPhe dissolved in THF (Figure 1B) in addition to the FTLS values of pCNPhe incorporated at sites 149 and 133 of sfGFP (Figure 1C). This analysis further illustrates the different local protein environments experienced by the nitrile group of pCNPhe incorporated at site 74 of sfGFP first determined based upon the room temperature central frequencies of these three subcomponents. The temperature-dependence of the fractional areas of the three subcomponents is also given in the Supporting Information (Figure S10) where the fractional area of the low frequency component increases with temperature while the areas of the intermediate and high frequency components decrease with temperature. The decrease in fractional area of the high frequency component with increasing temperature is suggestive of a disruption of a hydrogen-bond interaction between the nitrile group of pCNPhe and another residue in the protein (potentially His199, see discussion below).
Figure 4.

Temperature-dependence of the nitrile symmetric stretching frequency of the three subcomponents of the nitrile IR absorbance band for sfGFP-Tyr74pCNPhe in an aqueous buffer solution fit to a straight line (solid lines). The temperature dependence of the low (open circles), intermediate (open squares) and high (open triangles) frequency subcomponents are shown. The frequency shifts were referenced to the nitrile stretching frequency of the three subcomponents measured at 11.4 °C.
X-Ray Crystallographic Analysis.
In order to examine the structural local environment around the pCNPhe residue at the 74 site and obtain a more direct image of relevant interactions, the 1.51 Å resolution X-ray crystal structure of sfGFP-Tyr74pCNPhe was solved (Table S2). Structural alignment of wt-sfGFP and sfGFP-Tyr74pCNPhe illustrated a little structural change upon incorporation of pCNPhe with an RMSD for 187 Cɑ atoms of 0.227 Å (Figure 5A), similar to previous work incorporating pCNPhe at site 133 or 149.17
Figure 5.

X-ray crystal structure of sfGFP-Tyr74pCNPhe (orange) aligned with wt-sfGFP (green). A. Overall alignment with wt-sfGFP with 0.23 Å RMSD for 187 Cɑ atoms; B. aligned local environment around site 74 with nearby residues shown in sticks and water molecules < 4 Å from the sidechain at site 74 shown in spheres.
The X-ray structure revealed strong electron density for the pCNPhe74 residue, but the electron density for nearby histidine 199 suggested two conformations for this residue (Figure S11). The solvent accessible surface area for the pCNPhe74 residue was calculated in GETAREA49 to be 2% or 5%, depending on the His199 conformation; both are similar to the 1% solvent accessible surface area of the Tyr74 in the wt-sfGFP structure. One position for His199 resembles that of His199 in the wt-sfGFP structure, while the second has a χ1 rotation of 113° from the first (Figure 5B). In the wt-sfGFP structure (2B3P), His199 participates in a 2.8 Å H-bond with the hydroxyl group of Tyr74 and a 2.9 Å hydrogen bond to a water molecule (shown in a green sphere in Figure 5B or is HOH820 in 2B3P). The 1.0σ 2Fo-Fc density in the sfGFP-Tyr74pCNPhe structure does not suggest the presence of an ordered water molecule equivalent to that participating in a hydrogen bond with His199 and Tyr74 in wt-sfGFP (Figure S11 and Figure 5B illustrated by the lack of a red sphere at the same location). In the sfGFP-Tyr74pCNPhe structure, one orientation of His199 is pointed towards the pCNPhe74 site where N𝛆 of His199 is 2.8 Å from the nitrile N of the pCNPhe residue, suggesting that in this orientation Nε is protonated and acting as a hydrogen bond donor to the nitrile. The second modeled orientation of His199 in the sfGFP-Tyr74CNPhe structure illustrates His199 rotated away from nitrile, thus incapable of participating in a hydrogen bond. The absence of an ordered water molecule near site 74 side chain and the multiple conformations of His199 (of which two were able to be modeled in this structure) in the sfGFP-Tyr74pCNPhe structure suggests a number of stable conformations of this region of the protein, consistent with the possibility of multiple unique environments around pCNPhe74 as suggested by the IR results.
Molecular Dynamics Analysis.
As was done for the previously discussed sfGFP variants, MD simulations of sfGFP-Tyr74pCNPhe were performed to elucidate the origin of the three subcomponents in its IR spectrum. Because there are crystallographic waters both hydrogen-bonded to and proximal to Tyr74 in 5DPG (and other sfGFP crystal structures) and no crystallographic water hydrogen-bonding to pCNPhe74 in the crystal structure of sfGFP-Tyr74pCNPhe (Figure 5), one simulation was performed with crystallographic waters present and another with the two crystallographic water molecules that are close contacts (<4.0 Å heavy atom distance) to the pCNPhe side chain in site 74 deleted (hereafter referred to as “crystallographic waters absent”). In both simulations, the mean fractional SASA of the pCNPhe side chain is close to zero (Table S1), suggesting that site 74 remains buried and inaccessible to bulk solvent regardless of whether water occupies the volume near the pCNPhe side chain. In addition, a close contacts analysis reveals that certain residues remain close to the pCNPhe side chain in both cases: the backbone of residues 81–82 and the side chains of Phe84 and Leu201 (Table S3). Beyond this, however, the environments surrounding pCNPhe in the two simulations differ significantly.
In the simulation with crystallographic waters present at site 74, one of the crystallographic waters remains hydrogen bonded to the nitrile group of pCNPhe throughout the duration of the 1.0 μs simulation, suggesting a significant lifetime for this state (Figure 6A). Moreover, during this simulation, the His199 residue does not form a hydrogen bond with the nitrile group, instead remaining in a single side chain conformation that leaves the Nε atom of His199 (denoted Nε2 in PDB nomenclature) oriented away from that group. In the simulation performed with crystallographic waters absent from site 74, however, a variety of different chemical environments are sampled by the pCNPhe side chain. Toward the beginning of the simulation, no water is present in site 74 and additional nonspecific close contacts with the pCNPhe side chain are made with Ile152 and Pro196. Then, ~160 ns into the simulation, the site rearranges such that the Nε atom of His199 becomes oriented toward the pCNPhe side chain and a hydrogen bond is formed between the proton attached to Nε and the nitrile group nitrogen (Figure 6B). After another ~160 ns a bulk water molecule enters the site, hydrogen bonds to the nitrile group, and displaces the hydrogen bond between that group and His199. Finally, around 500 ns into the simulation, the bulk water exits and the site returns to the same state it was in at the beginning of the simulation, with close contacts to both Ile152 and Pro196 being restored (Figure S12).
Figure 6.

Time series of heavy atom distances to pCNPhe nitrile group nitrogen atom from MD simulations of sfGFP-Tyr74pCNPhe. A. For the simulation started with crystallographic waters present at site 74, distances are shown to one of the crystallographic water molecules (blue), the closest atom of the Phe84 side chain (green), and the Nε atom of the His199 side chain (purple). B. For the simulation started with crystallographic waters absent from site 74, distances are shown to the closest bulk water molecule (orange), the closest atom of the Phe84 side chain (green), and the Nε atom of the His199 side chain (purple). The data have been downsampled by a factor of five for clarity.
These simulations suggest that although site 74 is buried, water molecules are able to enter and exit the site. In the case of the first simulation with crystallographic waters present, the residence time of the water is at least 1.0 μs, while in the second simulation, the residence time of the water is on the order of 100 ns. Because water ingress and egress from buried sites is a slow process compared to the simulation time scale, further simulations using advanced sampling techniques51 would be needed in order to rigorously compute the equilibrium fraction of time that water is present within site 74, as well as the fractions of time that various residues remain in close contact with the pCNPhe side chain (as these are correlated with the presence of water). Nonetheless, the simulations suggest that the pCNPhe side chain can sample three distinct chemical environments: one that involves no hydrogen bonds and only nonspecific van der Waals interactions, one involving a hydrogen bond with water, and one involving a hydrogen bond with His199.
Elucidating the Role of His 199.
The room temperature central frequency and FTLS analysis of sfGFP-Tyr74pCNPhe suggests the high frequency component of the IR absorption profile of sfGFP-Tyr74pCNPhe in the nitrile symmetric stretch vibration region corresponds to the nitrile group of pCNPhe at site 74 involved in hydrogen-bond interaction (Figures 3, 4, and S9). Based upon the crystal structure of sfGFP-Tyr74pCNPhe and MD analysis of sfGFP (Figures 5 and 6), this hydrogen-bond interaction could be between the nitrile group of pCNPhe and a hydrogen bound to Nε on the side chain of a histidine residue at site 199. Thus, His199 was mutated to a leucine to generate the sfGFP-Tyr74pCNPhe_His199Leu construct. This construct was confirmed by mass spectrometry having an observed mass of 26845.0 Da in agreement with the predicted mass. A comparison of the room temperature IR spectra in the nitrile symmetric stretching region of sfGFP-Tyr74pCNPhe and sfGFP-Tyr74pCNPhe_His199Leu is shown in Figure 7. The sfGFP-Tyr74pCNPhe_His199Leu IR spectrum shows an IR absorption profile consisting of only two subcomponents. The central frequency of these components are 2227.9 and 2232.9 cm−1 with a fwhm of 5.0 and 5.1 cm−1, respectively. Thus, the high frequency component of sfGFP-Tyr74pCNPhe is no longer present in the sfGFP-Tyr74pCNPhe_His199Leu IR spectrum. This suggests that the high frequency component of sfGFP-Tyr74pCNPhe (Table 1) was the result of a specific hydrogen bonding interaction between the nitrogen of the nitrile group of pCNPhe at site 74 and the Nε-H imidazole side chain hydrogen of histidine at site 199. The temperature dependence of the central frequencies of the two components of sfGFP-Tyr74pCNPhe_His199Leu is given in the Supporting Information (Figures S13 and S14). While crystals of the sfGFP-Tyr74pCNPhe_His199Leu structure were obtained, the resolution did not exceed 2.5 Å and was highly mosaic. Upon initial refinement it was clear that the structure would not provide atomistic detail in the area of interest near the 74 site and thus was not further refined, emphasizing the need for an alternate approach to visualize the site.
Figure 7.

Room temperature FTIR spectra of sfGFP-Tyr74pCNPhe (open square) and sfGFP-Tyr74pCNPhe_His199Leu (open circles) dissolved in an aqueous buffer (20 mM Hepes, pH 7.5) at a concentration of ~1 mM. The spectra were intensity normalized, baseline corrected, and fit with a linear combination of Gaussian and Lorentzian functions. The overall fit is shown as a solid curve while the subcomponents for each spectrum are shown as dashed curves.
MD simulations were performed to better understand the origin of the two subcomponents in the IR spectrum of sfGFP-Tyr74pCNPhe_His199Leu. As was done for sfGFP-Tyr74pCNPhe, two simulations were performed: one with crystallographic water molecules (from 5DPG) present at site 74 and one with the two water molecules absent from that site. The solvent accessibility of site 74 as quantified by fractional SASA is unchanged by the His199Leu mutation, remaining buried in both simulations (Table S1). In the simulation with water initially present at site 74, the water remains near the pCNPhe side chain, although it never forms a hydrogen bond with the nitrile group nitrogen. Instead, bulk water molecules enter the site later in the simulation and form short-lived hydrogen bonds (~10 ns) with that nitrogen atom (Figure 8A). The shorter residence time of water in this site may be due to the increased hydrophobicity of Leu199 as compared to His199, which could help stabilize water molecules in the case of sfGFP-Tyr74pCNPhe. The other close contacts of the pCNPhe side chain are the backbone of residues 81–82 and the side chains of Phe84, Ile152, Pro196, and Leu199 (Table S3). As in the simulations of sfGFP-Tyr74pCNPhe, these are all nonspecific van der Waals interactions.
Figure 8.

Time series of heavy atom distances to pCNPhe nitrile group nitrogen atom from MD simulations of sfGFP-Tyr74pCNPhe_His199Leu. A. For the simulation started with crystallographic waters present at site 74, distances are shown to one of the crystallographic water molecules (blue), the closest bulk water molecule (orange), and the closest atoms of the Phe84 side chain (green) and Leu199 side chain (purple). B. For the simulation started with crystallographic waters absent from site 74, distances are shown to the closest atom of the Phe84 side chain (green) and the Leu199 side chain (purple). The data have been downsampled by a factor of five for clarity.
In the simulation with water initially absent from site 74, no water molecules are seen to enter the site. Moreover, the close contacts in this simulation are largely similar to the one in which water molecules are initially present in the site (Figure 8B). It is difficult to draw many conclusions from the absence of water near site 74 in this simulation, as again it is likely that water ingress/egress from the site is a slow process relative to the simulation timescale. Despite this limitation, these two simulations suggest that there are two different chemical environments sampled by the pCNPhe side chain in sfGFP-Tyr74pCNPhe_His199Leu: one in which no water molecules are present and the only interactions with the pCNPhe side chain are nonspecific van der Waals interactions and one in which water molecules are present at site 74 and can form hydrogen bonds with the nitrile group nitrogen, consistent with the IR data.
CONCLUSIONS
In this study, a general approach combining temperature-dependent IR spectroscopy, X-ray crystallography and MD simulations was utilized to explore the local environment of pCNPhe individually incorporated at two exterior sites (sites 133 and 149) and an interior site (site 74) in sfGFP. We validated this multi-faceted experimental and computational approach by first exploring the two previous sites studied by room-temperature IR spectroscopy and X-ray crystallography (sites 133 and 149).17 The similarity of both the room-temperature nitrile symmetric stretching frequency and FTLS of pCNPhe incorporated at site 133 or 149 to free pCNPhe in aqueous buffer or THF suggested that the nitrile group is fully solvated or partially solvated at these sites, respectively. This assignment was further verified by MD simulations. Thus, for both sites 133 and 149, all three techniques were in agreement with the assignment of chemical environments around the pCNPhe side chain.
The successful application of this approach to the study of sites 133 and 149 instilled confidence in the ability of this methodology to probe the local environment of a previously unstudied interior site (site 74). Unlike the room-temperature IR spectra of sfGFP-Asp133pCNPhe and sfGFP-Asn149pCNPhe, the IR spectrum for sfGFP-Tyr74pCNPhe in the region of the nitrile symmetric stretch frequency showed an IR absorption profile consisting of three subcomponents (Table 1). Accidental Fermi resonance was ruled out as the cause of these three subcomponents by isotopic labeling the nitrile group of pCNPhe incorporated at this site.
Temperature-dependent IR spectroscopy alone could not provide an adequate molecular picture of the nitrile group of pCNPhe at site 74, although the data (Table 1) suggest that the low frequency component represents a hydrophobic region while the other two components represent a partially hydrated and/or hydrogen-bonding environment. The X-ray crystal structure of sfGFP-Tyr74pCNPhe revealed that pCNPhe displayed two conformations of His199, one of which is potentially able to form a hydrogen bond with pCNPhe at site 74 (Figure 5B). To test this interaction, His199 was mutated to a leucine residue, and the resulting room-temperature IR spectra showed only two subcomponents in the absorption profile in the region of the nitrile symmetric stretching frequency (Figure 7). The sfGFP-Tyr74pCNPhe-His199Leu IR spectrum thus suggests the high-frequency component in the IR spectrum of sfGFP-Tyr74pCNPhe was due to hydrogen-bonding between the nitrile group of pCNPhe and His199. Similarly, the MD simulation of sfGFP-Tyr74pCNPhe demonstrated that the pCNPhe side chain can sample three distinct chemical environments: one that involves no hydrogen bonds and only nonspecific van der Waals interactions, one involving a hydrogen bond with water, and one involving a hydrogen bond with His199 (Figure 9). Based upon the data and the interplay of the three techniques employed, these three environments are likely represented by the low, intermediate, and high frequency subcomponents in the IR spectrum of sfGFP-Tyr74pCNPhe (Figure 3), respectively. The correlation of the subcomponents to different chemical environments in the protein is in agreement with previous work correlating the two subcomponents of the IR spectrum in the nitrile region of acetonitrile dissolved in methanol to different chemical environments of the nitrile group.52
Figure 9.
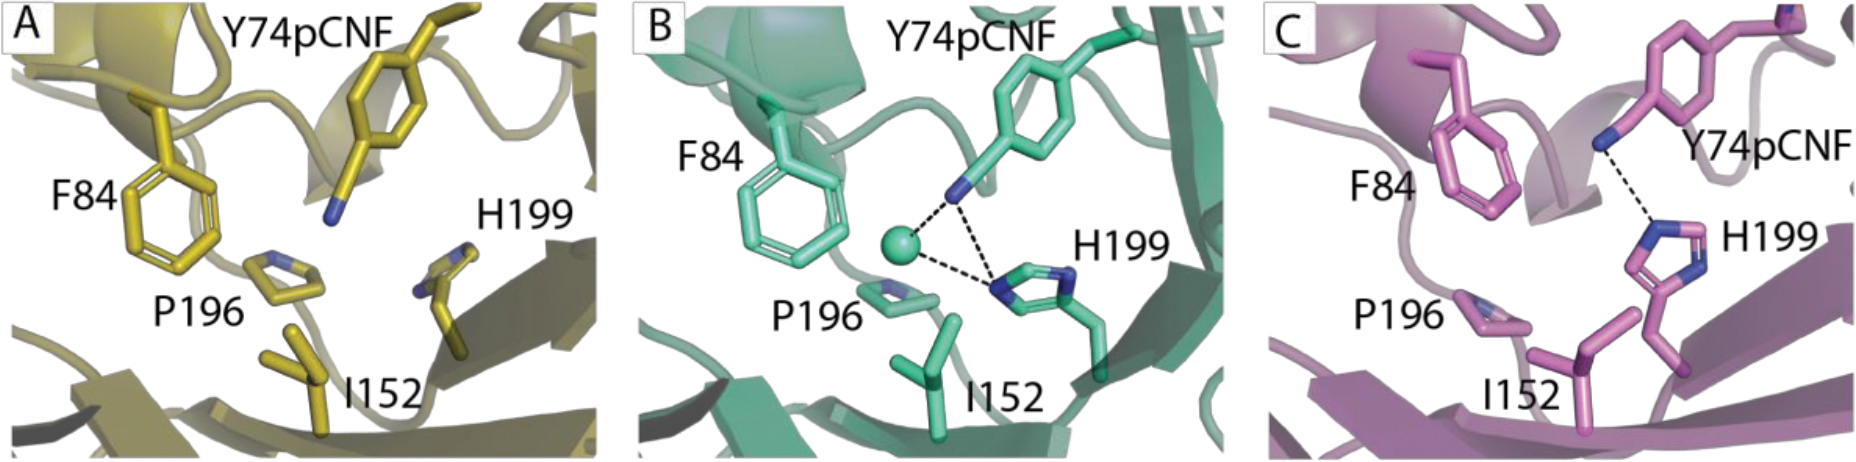
Three representative structures of the 74pCNPhe site from the MD simulations of sfGFP-Tyr74pCNPhe. A. The gold structure illustrates a state where the pCNPhe is not involved in a hydrogen bond with a nearby atom and His199 is rotated away from the orientation where it is able to hydrogen bond with the nitrile or stabilize a water molecule hydrogen bonding with the nitrile. B. The violet structure illustrates a state where the pCNPhe is hydrogen bonding to Histidine 199 (d(NCN-NHis) is 3.1 Å). C. The cyan structure illustrates a state where the pCNPhe is hydrogen bonded to a water molecule (d(NCN–OWAT) is 2.8 Å), which is also stabilized by His199 (d(OWAT-NHis) is 3.2 Å and d(NCN-NHis) is 3.5 Å).
While it is possible that the complex environment experienced by the nitrile group of pCNPhe at site 74 in sfGFP could have been induced by the presence of the UAA – specifically the removal of a functional group that can act as both a hydrogen-bond acceptor and donor (hydroxyl group) with a group that can only act as a hydrogen-bond acceptor (nitrile group) – the resulting approach was successful at providing a molecular picture of these different chemical environments present in the pCNPhe74 site. This study demonstrates that simple and complex local chemical environments in proteins can be effectively probed using 4-cyano-L-phenylalanine as a vibrational reporter when site-specifically incorporated into proteins.
Supplementary Material
ACKNOWLEDGEMENTS
This research was supported by the National Science Foundation (Grant No. CAREER-1847937, CNS-1828779, and CNS-2018427); Henry Dreyfus Teacher-Scholar Awards (TH-15-009 and TH-21-007), and National Institutes of Health (R15GM093330). The NASA Minority University Research and Education Project (MUREP) Institutional Research Opportunity grant NNX15AQ06A, Hackman Fund (F&M), and Eyler Fund (F&M) provided student support. Data for the crystal structure were collected at the Northeastern Collaborative Access Team beamlines, which are funded by the National Institute of General Medical Sciences from the National Institutes of Health (P41 GM103403). This research used resources of the Advanced Photon Source, a U.S. Department of Energy (DOE) Office of Science User Facility operated for the DOE Office of Science by Argonne National Laboratory under Contract No. DE-AC02-06CH11357. We thank Christopher Bazewicz (F&M), Jacqueline Penn (F&M), and Trexler Hirn (F&M) for the synthesis of the isotopically labeled pCNPhe; Kenneth Hess (F&M) for the collection and analysis of mass spectral data; and Lisa Mertzman (F&M) and Julie Gemmel (F&M) for administrative support.
Footnotes
SUPPORTING INFORMATION
The Supporting Information is available free of charge at https://pubs.acs.org.
Included in the Supporting Information are room temperature FTIR spectra for free pCNPhe in water and THF, sfGFP-Asp133pCNPhe, and sfGFP-Asn149pCNPhe; RMSD plots of MD simulations; additional temperature-dependent FTIR absorbance spectra; temperature dependence of fractional areas for FTIR absorbance spectrum subcomponents of sfGFP-Tyr74pCNPhe; X-ray crystallographic refinement of sfGFP-Tyr74pCNPhe; additional time series from MD simulation of sfGFP-Tyr74pCNPhe; temperature dependence of subcomponents in FTIR absorbance spectrum of sfGFP-Tyr74pCNPhe_His199Leu. (PDF)
AMBER ff14SB-compatible frcmod and lib files for pCNPhe residue. (ZIP)
REFERENCES
Bibliography
- (1).Getahun Z; Huang C-Y; Wang T; De León B; DeGrado WF; Gai F J. Am. Chem. Soc. 2003, 125, 405. [DOI] [PubMed] [Google Scholar]
- (2).Glasscock JM; Zhu Y; Chowdhury P; Tang J; Gai F Biochemistry 2008, 47, 11070. [DOI] [PMC free article] [PubMed] [Google Scholar]
- (3).Weeks CL; Polishchuk A; Getahun Z; Degrado WF; Spiro TG J. Raman Spectrosc. 2008, 39, 1606. [DOI] [PMC free article] [PubMed] [Google Scholar]
- (4).Waegele MM; Culik RM; Gai F J. Phys. Chem. Lett. 2011, 2, 2598. [DOI] [PMC free article] [PubMed] [Google Scholar]
- (5).Fafarman AT; Boxer SG J. Phys. Chem. B 2010, 114, 13536. [DOI] [PMC free article] [PubMed] [Google Scholar]
- (6).Urbanek DC; Vorobyev DY; Serrano AL; Gai F; Hochstrasser RM J. Phys. Chem. Lett. 2010, 1, 3311. [DOI] [PMC free article] [PubMed] [Google Scholar]
- (7).Bagchi S; Fried SD; Boxer SG J. Am. Chem. Soc. 2012, 134, 10373. [DOI] [PMC free article] [PubMed] [Google Scholar]
- (8).Bagchi S; Boxer SG; Fayer MD J. Phys. Chem. B 2012, 116, 4034. [DOI] [PMC free article] [PubMed] [Google Scholar]
- (9).Hu W; Webb LJ J. Phys. Chem. Lett. 2011, 2, 1925. [Google Scholar]
- (10).Zimmermann J; Thielges MC; Seo YJ; Dawson PE; Romesberg FE Angew. Chem. Int. Ed 2011, 50, 8333. [DOI] [PubMed] [Google Scholar]
- (11).Tucker MJ; Oyola R; Gai F J. Phys. Chem. B 2005, 109, 4788. [DOI] [PubMed] [Google Scholar]
- (12).Schultz KC; Supekova L; Ryu Y; Xie J; Perera R; Schultz PG J. Am. Chem. Soc. 2006, 128, 13984. [DOI] [PubMed] [Google Scholar]
- (13).Taskent-Sezgin H; Chung J; Patsalo V; Miyake-Stoner SJ; Miller AM; Brewer SH; Mehl RA; Green DF; Raleigh DP; Carrico I Biochemistry 2009, 48, 9040. [DOI] [PubMed] [Google Scholar]
- (14).Bazewicz CG; Lipkin JS; Smith EE; Liskov MT; Brewer SH J. Phys. Chem. B 2012, 116, 10824. [DOI] [PubMed] [Google Scholar]
- (15).Slocum JD; Webb LJ J. Am. Chem. Soc. 2016, 138, 6561. [DOI] [PubMed] [Google Scholar]
- (16).First JT; Slocum JD; Webb LJ J. Phys. Chem. B 2018, 122, 6733. [DOI] [PubMed] [Google Scholar]
- (17).Dippel AB; Olenginski GM; Maurici N; Liskov MT; Brewer SH; Phillips-Piro CM Acta Crystallogr. D Struct. Biol. 2016, 72, 121. [DOI] [PMC free article] [PubMed] [Google Scholar]
- (18).Miyake-Stoner SJ; Miller AM; Hammill JT; Peeler JC; Hess KR; Mehl RA; Brewer SH Biochemistry 2009, 48, 5953. [DOI] [PubMed] [Google Scholar]
- (19).Adhikary R; Zimmermann J; Dawson PE; Romesberg FE ChemPhysChem 2014, 15, 849. [DOI] [PubMed] [Google Scholar]
- (20).Kearney C; Olenginski LT; Hirn TD; Fowler GD; Tariq D; Brewer SH; Phillips-Piro CM RSC Adv. 2018, 8, 13503. [DOI] [PMC free article] [PubMed] [Google Scholar]
- (21).Choi J-H; Oh K-I; Lee H; Lee C; Cho M J. Chem. Phys. 2008, 128, 134506. [DOI] [PubMed] [Google Scholar]
- (22).Deb P; Haldar T; Kashid SM; Banerjee S; Chakrabarty S; Bagchi S J. Phys. Chem. B 2016, 120, 4034. [DOI] [PubMed] [Google Scholar]
- (23).Baiz CR; Błasiak B; Bredenbeck J; Cho M; Choi J-H; Corcelli SA; Dijkstra AG; Feng C-J; Garrett-Roe S; Ge N-H; Hanson-Heine MWD; Hirst JD; Jansen TLC; Kwac K; Kubarych KJ; Londergan CH; Maekawa H; Reppert M; Saito S; Roy S; Zanni MT Chem. Rev. 2020, 120, 7152. [DOI] [PMC free article] [PubMed] [Google Scholar]
- (24).Huang C-Y; Wang T; Gai F Chem. Phys. Lett. 2003, 371, 731. [Google Scholar]
- (25).Adhikary R; Zimmermann J; Romesberg FE Chem. Rev. 2017, 117, 1927. [DOI] [PubMed] [Google Scholar]
- (26).Bazewicz CG; Lipkin JS; Lozinak KA; Watson MD; Brewer SH Tetrahedron Lett. 2011, 52, 6865. [Google Scholar]
- (27).Hammill JT; Miyake-Stoner S; Hazen JL; Jackson JC; Mehl RA Nat. Protoc. 2007, 2, 2601. [DOI] [PubMed] [Google Scholar]
- (28).Kabsch W Acta Crystallogr. D Biol. Crystallogr. 2010, 66, 125. [DOI] [PMC free article] [PubMed] [Google Scholar]
- (29).McCoy AJ; Grosse-Kunstleve RW; Adams PD; Winn MD; Storoni LC; Read RJ J. Appl. Crystallogr. 2007, 40, 658. [DOI] [PMC free article] [PubMed] [Google Scholar]
- (30).Pédelacq J-D; Cabantous S; Tran T; Terwilliger TC; Waldo GS Nat. Biotechnol. 2006, 24, 79. [DOI] [PubMed] [Google Scholar]
- (31).Liebschner D; Afonine PV; Baker ML; Bunkóczi G; Chen VB; Croll TI; Hintze B; Hung LW; Jain S; McCoy AJ; Moriarty NW; Oeffner RD; Poon BK; Prisant MG; Read RJ; Richardson JS; Richardson DC; Sammito MD; Sobolev OV; Stockwell DH; Adams PD Acta Crystallogr. D Struct. Biol. 2019, 75, 861. [DOI] [PMC free article] [PubMed] [Google Scholar]
- (32).Emsley P; Lohkamp B; Scott WG; Cowtan K Acta Crystallogr. D Biol. Crystallogr. 2010, 66, 486. [DOI] [PMC free article] [PubMed] [Google Scholar]
- (33).Cieplak P; Cornell WD; Bayly C; Kollman PA J. Comput. Chem. 1995, 16, 1357. [Google Scholar]
- (34).Barca GMJ; Bertoni C; Carrington L; Datta D; De Silva N; Deustua JE; Fedorov DG; Gour JR; Gunina AO; Guidez E; Harville T; Irle S; Ivanic J; Kowalski K; Leang SS; Li H; Li W; Lutz JJ; Magoulas I; Mato J; Gordon MS J. Chem. Phys. 2020, 152, 154102. [DOI] [PubMed] [Google Scholar]
- (35).Dupradeau F-Y; Pigache A; Zaffran T; Savineau C; Lelong R; Grivel N; Lelong D; Rosanski W; Cieplak P Phys. Chem. Chem. Phys. 2010, 12, 7821. [DOI] [PMC free article] [PubMed] [Google Scholar]
- (36).Wang J; Wolf RM; Caldwell JW; Kollman PA; Case DA J. Comput. Chem. 2004, 25, 1157. [DOI] [PubMed] [Google Scholar]
- (37).Guex N; Peitsch MC Electrophoresis 1997, 18, 2714. [DOI] [PubMed] [Google Scholar]
- (38).Case DA; Ben-Shalom IY; Brozell SR; Cerutti DS; Cheatham TEIII; Cruzeiro VWD; Darden TA; Duke RE; Ghoreishi D; Gilson MK; Gohlke H; Goetz AW; Greene D; Harris R; Homeyer N; Izadi S; Kovalenko A; Kurtzman T; Lee TS; LeGrand S; Kollman PA 2019.
- (39).Maier JA; Martinez C; Kasavajhala K; Wickstrom L; Hauser KE; Simmerling C J. Chem. Theory Comput. 2015, 11, 3696. [DOI] [PMC free article] [PubMed] [Google Scholar]
- (40).Jorgensen WL; Chandrasekhar J; Madura JD; Impey RW; Klein ML J. Chem. Phys. 1983, 79, 926. [Google Scholar]
- (41).Joung IS; Cheatham TE J. Phys. Chem. B 2008, 112, 9020. [DOI] [PMC free article] [PubMed] [Google Scholar]
- (42).Park H; Jeong B-S; Yoo M-S; Lee J-H; Park M; Lee Y-J; Kim M-J; Jew S Angewandte Chemie International Edition 2002. [Google Scholar]
- (43).Parmeggiani F; Lovelock SL; Weise NJ; Ahmed ST; Turner NJ Angew Chem Weinheim Bergstr Ger 2015, 127, 4691. [DOI] [PMC free article] [PubMed] [Google Scholar]
- (44).O’Donnell MJ; Bennett WD; Wu SJ Am. Chem. Soc. 1989, 111, 2353. [Google Scholar]
- (45).Corey EJ; Xu F; Noe MC J. Am. Chem. Soc. 1997, 119, 12414. [Google Scholar]
- (46).Kitamura M; Shirakawa S; Maruoka K Angew. Chem. Int. Ed 2005, 44, 1549. [DOI] [PubMed] [Google Scholar]
- (47).Pekošak A; Filp U; Škrinjar J; Poot AJ; Windhorst AD Org. Biomol. Chem. 2017, 15, 570. [DOI] [PubMed] [Google Scholar]
- (48).Adhikary R; Zimmermann J; Dawson PE; Romesberg FE Anal. Chem. 2015, 87, 11561. [DOI] [PubMed] [Google Scholar]
- (49).Fraczkiewicz R; Braun W J. Comput. Chem. 1998, 19, 319. [Google Scholar]
- (50).Lipkin JS; Song R; Fenlon EE; Brewer SH J. Phys. Chem. Lett. 2011, 2011, 1672. [DOI] [PMC free article] [PubMed] [Google Scholar]
- (51).Ben-Shalom IY; Lin C; Radak BK; Sherman W; Gilson MK J. Chem. Theory Comput. 2021, 17, 7366. [DOI] [PMC free article] [PubMed] [Google Scholar]
- (52).Kim YS; Hochstrasser RM Proc Natl Acad Sci USA 2005, 102, 11185. [DOI] [PMC free article] [PubMed] [Google Scholar]
Associated Data
This section collects any data citations, data availability statements, or supplementary materials included in this article.