

Abstract
Objective
Exposure to the nerve agent, soman (GD), induces status epilepticus (SE), epileptogenesis, and even death. Although rodent models studying the pathophysiological mechanisms show females to be more reactive to soman, no tangible sex differences in brains postexposure have been reported. In this study, we used multimodal imaging using MRI in adult rats to determine potential sex‐based biomarkers of soman effects.
Methods
Male and female Sprague Dawley rats were challenged with 1.2 × LD50 soman followed by medical countermeasures. Ten weeks later, the brains were analyzed via structural and functional MRI.
Results
Despite no significant sex differences in the initial SE severity after soman exposure, long‐term MRI‐based structural and functional differences were evident in the brains of both sexes. While T2 MRI showed lesser soman‐induced neurodegeneration, large areas of T1 enhancements occurred in females than in males, indicating a distinct pathophysiology unrelated to neurodegeneration. fMRI‐based resting‐state functional connectivity (RSFC), indicated greater reductions in soman‐exposed females than in males, associating with the T1 enhancements (unrelated to neurodegeneration) rather than T2‐hyperintensity or T1‐hypointensity (representing neurodegeneration). The wider T1 enhancements associating with the decreased spontaneous neuronal activity in multiple resting‐state networks in soman‐exposed females than males suggest that neural changes unrelated to cellular atrophy impinge on brain function postexposure. Taken together with lower spontaneous neural activity in soman‐exposed females, the results indicate some form of neuroprotective state that was not present in males.
Significance
The results indicate that endpoints other than neurodegeneration may need to be considered to translate sex‐based nerve agent effects in humans.
Keywords: epilepsy, MRI resting state, nerve agent, neurodegeneration, status epilepticus
Abbreviations
- AChE
acetylcholinesterase
- AFNI
analysis of functional neuroimages
- BOLD
blood oxygen level dependent
- DFP
diisopropylfluorophosphate
- DICOM
digital imaging and communications in medicine
- EPI
echo planar imaging
- FIESTA
fast imaging employing steady‐state acquisition
- fMRI
functional magnetic resonance imaging
- GD
soman
- GRE
gradient recalled echo
- MDZ
midazolam
- MRI
magnetic resonance imaging
- NIFTI
neuroimaging informatics initiative
- OPNA
organophosphate nerve agent
- PBS
phosphate buffered saline
- RF
radiofrequency
- ROI
regions of interest
- RSFC
resting‐state functional connectivity
- SE
status epilepticus
- SPGR
spoiled gradient recalled
- SRS
spontaneous recurring seizures
- TE
time to echo
- TR
repetition time
Key Points.
Large brain areas of T1 enhancements occurred in soman‐exposed females than males in long‐term.
fMRI‐based RSFC indicated greater reductions in soman‐exposed females than males.
1. INTRODUCTION
Organophosphate nerve agents (OPNAs) such as soman, sarin, tabun, VX, and cyclosarin are chemically weaponizable and pose potential threats to both civilians and military personnel worldwide. Following OPNA exposure, prolonged convulsive seizures or status epilepticus (SE) ensues, 1 , 2 , 3 , 4 , 5 with no effective treatments for the victims. 6 , 7 OPNAs are irreversible acetylcholinesterase (AChE) inhibitors that cause acute respiratory and cardiac symptoms. 8 , 9 , 10 , 11 However, neurological consequences such as SE leading to SRS and neurodegeneration are serious concerns. In the efforts to find effective treatments, animal models of OPNA toxicity are crucial and may provide clues to disease progression and discovery of potential disease modifiers. 11 , 12 , 13 , 14 In the efforts to discover potential therapeutics, nerve agent‐induced pathophysiological processes in both females and males are important for better clinical translation.
Our prior mixed‐sex cohort studies of OPNA toxicity using soman and its surrogate, diisopropylfluorophosphate (DFP), have shown that both induce severe SE, immediately after exposure, leading to epileptogenesis as evidenced by prolonged SRS, reactive gliosis, and neurodegeneration. 2 , 15 Although SE severity (a valuable initial neurological outcome marker) was independent of estrous cycle in females, it was higher in female rats than males exposed to soman implying females are more reactive to soman. 2 As the main contributor to neurological damage is from prolonged SRS, which associates to a large extent with SE severity after nerve agent exposure, 16 we hypothesized that soman‐exposed animals with severe SE (>20 min) will show MRI‐based neurodegeneration in both sexes and with a larger impact on females. As quantitative MRI can predict neurodegeneration in rat models of OPNA exposure, 17 , 18 , 19 , 20 we investigated structural MRI‐based brain outcomes in combination with fMRI‐based functional changes in adult rats of both sexes with similar SE severity after exposure to soman. To understand the long‐term sex‐based outcomes of soman exposure on brain glucose metabolism, we performed [18F]‐fluorodeoxyglucose (18F‐FDG)‐based positron emission tomography (PET) imaging. Glucose uptake between control males and females and soman‐exposed males and females was compared.
2. MATERIALS AND METHODS
All animal procedures were approved by the Institutional Animal Care and Use Committees (IACUC) of Iowa State University (Ames, IA), the University of Iowa (Iowa City, IA), and the MRI Global, Kansas City, MO (IACUC‐21‐118; IACUC‐20‐090). Twenty‐four adult Sprague Dawley rats of both sexes (aged 7–8 weeks; 12 females/12 males) were randomized into control vehicle and soman‐treated groups. Rats were treated with vehicle (phosphate buffered saline; PBS) or soman (GD, 132 μg/kg, s.c. 1.2 × LD50), followed by HI‐6 dimethanesulfonate (125 mg/kg, i.m) and atropine sulfate (2 mg/kg, i.m) to control for mortality/peripheral effects. Following soman intoxication, animals were observed at each minute for the development of behavioral convulsive seizures as described in our previous studies. 2 The number of minutes spent in a convulsive seizure between soman exposure and midazolam treatment (60 minutes) was used as the measurement for SE severity. All soman‐exposed animals had convulsive seizures for >20 minutes before SE termination with midazolam (MDZ, 3 mg/kg, i.m). Ten weeks after soman exposure, animals were transferred to the University of Iowa for the magnetic resonance imaging (MRI) studies to determine translational markers of brain changes. At the end of the study, all animals were euthanized with pentobarbital sodium (100 mg/kg, i.p). The experiments were designed and reported as per the principles of the ARRIVE guidelines. 21
2.1. Structural MRI
MRI measures of the brain were acquired using a GE Discovery MR901 7 Tesla horizontal bore scanner after the rats were induced with 3% isoflurane and maintained with 1.5% isoflurane in 30% O2/70%N2 delivered through a nose cone. Warm air circulated in the bore to keep body temperature stable and respiratory rate was monitored with a pneumatic pillow. Animals' heads were fixed using bite bars to limit motion and placed in the bore of a volume transmit RF coil of a 7 cm diameter with a four‐channel surface receive coil. T2 steady‐state contrast images were obtained using a fast imaging employing steady‐state acquisition (FIESTA) sequence for rapid scanning and coverage of the whole brain. MRI parameters used were: TR/TE = 4.3 ms/1.9 ms, 108 axial slices of thickness 0.3 mm, and in‐plane resolution of 0.13 mm × 0.13 mm covering a 25 mm × 25 mm field of view. Subsequently, a spoiled gradient recalled echo (SPGR) pulse sequence with TR/TE 13 ms/2 ms and flip angle 20 degrees acquired 56 slices of 0.6 mm thickness with 0.13 mm × 0.16 mm resolution over a 25 mm × 25 mm field of view to generate T1‐weighted images.
2.2. Functional MRI (fMRI)
After completion of the structural T1 and T2 sequences, approximately 10 minutes of fMRI measurements were obtained using a T2*‐weighted gradient recalled echo (GRE) segmented echo planar imaging (EPI) sequence with blood oxygen level‐dependent (BOLD) weighting. The imaging parameters were as follows: TR/TE = 1500 ms/15 ms, 4 segments per image, slice thickness of 0.9 mm, field of view 32 mm × 32 mm over a 96 × 96 matrix, utilizing 27 slices to cover the whole brain from the olfactory lobe to the cerebellum. A total of 80 image volumes were obtained with a repetition time of 6 seconds per image volume.
2.3. Image processing and statistics
SE severity of the animals that were used for brain MRI was compared between males and females using a t test. The average number of minutes animals spent in a convulsive seizure prior to the administration of midazolam was compared. All images were obtained in the DICOM format and were reconstructed into NIFTI for preprocessing and registration using BioImage suite. 22 Further statistical analysis and parametric mapping were performed using AFNI software program. 23 The sigma rat MRI template (https://www.nitrc.org/projects/sigma_template/) was used as the standard spatial template to which a single control rat brain MRI was nonlinearly registered (50 iterations, normalized mutual information, otherwise default) using BioImage suite. 22 The resulting “study baseline template” was used to nonlinearly register all other subject MRIs. Using the sigma template mask, nonbrain regions were removed and subsequent analysis carried out only on the brain parenchyma. T1 and T2 MRI intensities were normalized across all subject brains using a low and high threshold of 0.001 and 1, respectively, with a maximum value of 255.
Statistical parametric mapping of the whole brain was performed using a two‐sample t test (two‐tailed) using AFNI. 23 Statistical differences between groups were analyzed with a corrected threshold probability of P < 0.05, determining voxels with a significant difference (active voxels) using a family‐wise error control of a minimum cluster of 30 contiguous voxels to correct for multiple comparisons. MRI intensity differences obtained from the t test means were depicted in color with hot colors indicating a positive mean difference and cold colors depicting a negative mean difference and overlayed on the mean anatomical MRI of the control group animals. Regions of interest (ROI) analysis was performed using the sigma rat template anatomical atlas labeled regions to obtain the region‐specific masks. Significant MRI intensity changes across each ROI were determined by estimating the number of significantly different (active) voxels between any two group comparisons (positive or negative changes) from the t test and multiplying with the voxel volume to determine the brain‐wide MRI changes.
Using the fMRI dataset of the “study template control subject,” fMRI datasets of all other animals were linearly co‐registered. Subsequently, all image volumes in each animal were motion corrected to the 5th image of the respective animal using AFNI. 23 All resting‐state BOLD voxel‐level time series data were linearly detrended to remove temporal signal drifts and band‐pass filtered between 0.005 and 0.1 Hz before further analysis. Individual resting‐state functional connectivity (RSFC) maps were obtained by seed‐based cross‐correlation analysis where the BOLD time series (from a 3 × 3 = 9 voxel volume) was averaged to obtain the mean seed voxel time series, which was subsequently cross‐correlated with all other voxel time series within the brain. This process was repeated across both hemispheres yielding two individual RSFC maps. Cortical, hippocampal, and thalamic seed regions were used to obtain the respective RSFC networks across each animal. Average RSFC map in each animal and for each seed region network was determined after converting the correlation coefficients in the individual RSFC maps to z‐value using a Fisher z‐transform. Postaveraging, the z‐map was reconverted to correlation coefficients through an inverse Fisher z‐transformation as implemented in our earlier studies. 24 , 25 Group differences in the cortical, hippocampal, and thalamic RSFC networks across the control or soman‐treated animals were determined by a two‐sample t test (two‐tailed). Significant differences between groups (at the voxel level) were determined with a threshold of P < 0.05; corrected for multiple comparisons using a family‐wise error control cluster threshold of 20 contiguous voxels.
2.4. Rigor, sample size, and inclusion or exclusion criteria
All animals used in this study were bought from the same source (Charles River, USA). Animals were first randomized ignoring sex, stage of estrous cycle, and bodyweight. Once exposed to soman, equal number of females and males that had continuous SE for >20 minutes was chosen for MRI studies at 10‐week postexposure. Age‐ and sex‐matched controls and the soman‐exposed groups were blinded. Three animals, one from control and one from each sex of soman‐exposed group, were excluded from the analysis due to poor quality MRI acquisition as per the predetermined criteria. The sample size and power were determined based on our previous OPNA studies outcome from gliosis and neurodegeneration parameters 26 at 95% confidence interval.
3. RESULTS
In the animals used for MRI at 10‐week postexposure, there was no statistically significant difference in the initial SE severity after exposure to soman (Figure 1A ).
FIGURE 1.

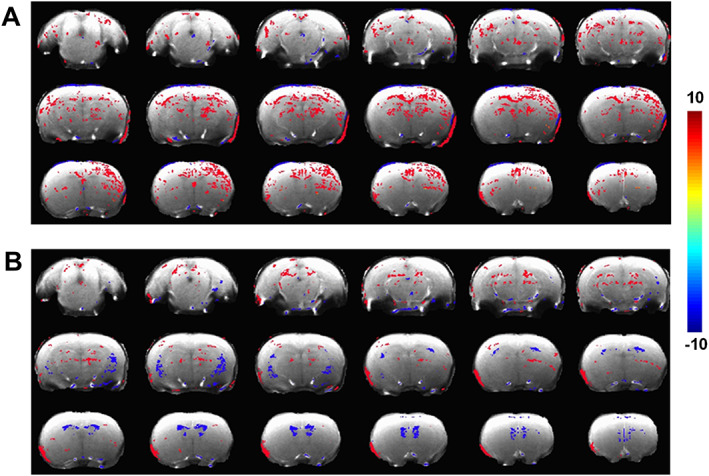
A, SE severity comparison between females and males. SE severity was measured by the number of minutes an animal spent in a convulsive seizure prior to the administration of midazolam. No significant differences were observed following t test. (B, C) Significant differences in FIESTA‐T2 hyperintensities and hypointensities were observed between sexes after soman exposure when compared to respective controls using a two‐tailed t test at the voxel level across the brain. A, Female (soman; n = 8) vs (control; n = 4). B. Male (soman; n = 8) vs (control; n = 4). Color overlay depicts active voxels (significantly different; corrected P < 0.05). A family‐wise error control of a minimum cluster of 30 contiguous voxels to correct for multiple comparisons. Hot colors depict hyperintense voxels and cold colors depict hypointense voxels, respectively, after soman exposure.
3.1. Structural MRI
3.1.1. FIESTA‐T2‐weighted
Structural MRI using FIESTA‐T2 in female and male adult rats indicated distinct trajectories of neurodegeneration with females more resistant to soman exposure‐induced neurodegeneration. T2‐hyperintense regions, indicative of neurodegeneration, were less prominent across females (Figure 1B; hot colors) when compared to males (Figure 1C; hot colors). Clusters of T2‐hypointense regions were also observed in a sparse manner across the caudate putamen among soman‐exposed females, typically not observed in males (Figure 1B; cold colors). Corpus callosum, hippocampus, and thalamus were affected across both sexes with lesser intensity in the females. Wider soman‐induced T2 hyperintensities were observed in males only, encompassing additional areas such as the caudate putamen, cortex, hypothalamus, and amygdala.
3.1.2. SPGR‐T1‐weighted
SPGR‐T1‐weighted MRI showed soman‐induced T1 intensity decreases that were relatively more prominent across males than females (Figure 2; cold colors), reproducing some of the spatial neurodegenerative profiles indicated by the T2 hyperintensities across both sexes (Figure 1; hot colors). However, T1 intensity enhancements were also observed across larger areas of the brain after soman exposure encompassing the caudate putamen, hippocampus, thalamus, and corpus callosum, which were relatively larger across females (Figure 2A) than males (Figure 2B).
FIGURE 2.
Significant differences in T1 intensities after soman exposure when compared to controls using a two‐tailed t test. A, Female (soman; n = 7) vs (control; n = 4). B, Male (soman; n = 6) vs (control; n = 3). T test was performed in very voxel comparing the two groups. Color overlay depicts active voxels (significantly different; corrected P < 0.05). A family‐wise error control of a minimum cluster of 30 contiguous voxels to correct for multiple comparisons. Hot colors depict T1 intensity increase after soman exposure and cold colors depict T1 intensity decrease after soman exposure.
3.1.3. T1/T2 ratio
To unequivocally delineate neurodegenerative regions, the T1/T2 ratio, an indicator of demyelination and dendritic loss, 27 , 28 was estimated at the voxel level utilizing the T1 and T2 modalities. The soman exposure‐induced T1/T2 ratio changes across the sexes (Figure 3) consistently overlapped with the soman‐induced T2 hyperintense areas (Figure 1B,C) and the T1 hypointense areas (Figure 2). As shown in Figure 3, control groups tended to have higher T1/T2 ratios in the regions where neurodegenerative changes were observed in soman‐exposed females, which was significantly lower when compared to males. Overall, the T2 hyperintensities, T1 hypointensities, and the T1/T2 ratio collectively indicated larger areas of neurodegeneration inflicted by soman exposure in males when compared to females. However, T1 intensity enhancements were observed over wider areas of soman‐exposed females than males, which seem to indicate another distinct sex‐based brain parenchymal change, such as cortical and hippocampal glial scars or dendritic loss, that was not directly related to neurodegeneration.
FIGURE 3.
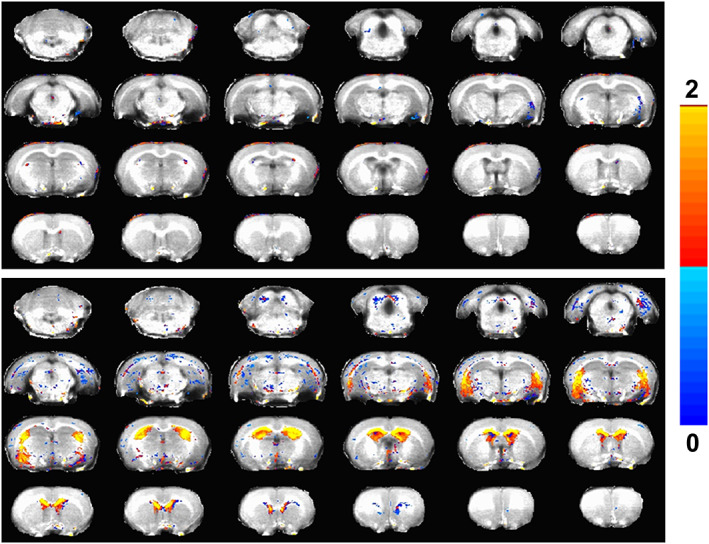
Significant differences in the T1/T2 ratio between control and soman‐exposed groups using a two‐tailed t test. A, Female (control; n = 4) vs (soman; n = 7). B, Male (control; n = 3) vs (soman; n = 6). T test was performed in very voxel comparing the two groups. Color overlay depicts active voxels (significantly different; corrected P < 0.05). A family‐wise error control of a minimum cluster of 30 contiguous voxels to correct for multiple comparisons. Color bar depicts the T1/T2 ratio range from 0 to 2.
3.1.4. Functional MRI
Brain functional changes were obtained using resting‐state BOLD‐fMRI measures from the female and male animals in the same scanning session as the structural T1 and T2 MRI measures. As neurodegeneration was confirmed by structural MRI across the cortical and hippocampal regions (Figures 1 and 3), we determined seed‐based resting‐state functional connectivity (RSFC) across the hippocampal, cortical, and thalamic networks, to determine soman‐induced brain functional changes. RSFC across the cortical, hippocampal, and thalamic networks were regionally distinct and symmetrical across the hemispheres and did not show any significant differences between the sexes (Figures 4A, 5A and 6A). Spatial extent of the cortical RSFC network diminished across both sexes after soman exposure with relatively more intense reductions in the soman‐exposed females (Figure 4A,E) than in males (Figure 4B,E). Similar effects of soman were observed with reductions in RSFC across the hippocampal (Figure 5) and thalamic networks (Figure 6), with relatively larger decreases in soman‐exposed females than males. Overall, the resting‐state fMRI results indicated a relatively intense brain functional impact of soman exposure in females than males. The RSFC reductions across multiple brain networks in the soman‐exposed rats of both sexes did not seem to correspond with the accruing neurodegeneration as indicated by the T2 hyperintensity (Figure 1) or T1/T2 ratio changes (Figure 3), respectively, but rather followed the T1 intensity enhancements in the soman‐exposed females and males that were unrelated to neurodegeneration (Figure 2).
FIGURE 4.

Seed‐based resting‐state functional connectivity (RSFC) cortical network in A, Female control (n = 4); B, Female soman (n = 7); C, Male control (n = 4); D, Male soman; n = 7. Activation maps determine voxels with correlation coefficients ≥ 0.2 (P < 0.05) corrected for multiple comparisons using a family‐wise error control of 20 contiguous voxel cluster. E, spatial extent of the cortical RSFC network (number of voxels) in the control and soman‐treated rats of both sexes.
FIGURE 5.

Seed‐based resting‐state functional connectivity (RSFC) hippocampal network in A, Female control (n = 4); B, Female soman (n = 7); C, Male control (n = 4); D, Male soman; n = 7. Activation maps determine voxels with correlation coefficients ≥ 0.2 (P < 0.05) corrected for multiple comparisons using a family‐wise error control of 20 contiguous voxel cluster. E, spatial extent of the hippocampal RSFC network (number of voxels) in the control and soman‐treated rats of both sexes.
FIGURE 6.

Seed‐based resting‐state functional connectivity (RSFC) thalamic network in A, Female control (n = 4); B, Female soman (n = 7); C, Male control (n = 4); D, Male soman; n = 7. Activation maps determine voxels with correlation coefficients ≥ 0.2 (P < 0.05) corrected for multiple comparisons using a family‐wise error control of 20 contiguous voxel cluster. E, spatial extent of the thalamic RSFC network (number of voxels) in the control and soman‐treated rats of both sexes.
4. DISCUSSION
Exposure to the organophosphate nerve agent, soman, causes immediate convulsive seizures and SE and leads to the development of SRS accompanied by progressive neurodegeneration. 2 In this study, we used MRI imaging measures of the brain and revealed sex‐based pathophysiological differences 10 weeks following soman intoxication. Neurodegeneration from T1 decreases or T2 enhancements was contrary to our hypothesis of greater impact on females as we observed soman‐exposed males showing larger neurodegeneration than females despite equivalent initial SE severity in the present cohort of animals used for MRI. However, certain T1 enhancements (not related to neurodegeneration) across wider brain areas of soman‐exposed females than males associated with brain neuronal activity impairment and were in line with our hypothesis of greater functional impairment in females.
The structural T1 and T2 contrast‐based results from the present study suggest that soman‐induced behavioral SE severity (a critical initial neurological outcome marker) alone is not predictive of chronic neurodegenerative outcomes across the sexes. Additional mechanisms (unrelated to neurodegeneration) seem to exist that severely debilitate neuronal function across females than males, thus necessitating functional MRI studies to better understand nerve agent‐induced pathophysiology across human populations. Resting‐state functional connectivity (RSFC), obtained from resting‐state fMRI, constitutes spontaneous neuronal activity in the working brain (at rest or in the absence of any stimulus) and manifests across both awake and anesthetized states. 29 , 30 , 31 , 32 RSFC is modular, with spatially distinct networks of neuronal populations in temporal coherence, 33 , 34 and can detect brain pathological states due to neurodegeneration or synaptic dysfunctions. Spatial extent or the connectivity strengths of the RSFC networks are highly reproducible, making it one of the most powerful translatable applications across humans 32 , 35 , 36 and animal models. 37 , 38 As observed by the current results, soman exposure‐induced RSFC decreases did not seem to correspond with the extent of neurodegeneration as indicated by the structural MRI‐based T2 intensity enhancements (Figure 1) or T1/T2 ratio decreases (Figure 3), but rather followed the T1 enhancements (not related to neurodegeneration), which was relatively greater across soman‐exposed females than males (Figure 2). While structural MRI indicated soman‐induced neurodegeneration in the hippocampus, subventricular zones, piriform cortex, and amygdala areas with male predominance, brain‐wide T1 enhancements, indicating certain neural change (unrelated to atrophy) occurred across the cortex, corpus callosum, hippocampus, caudate putamen, and thalamus with female predominance. These brain‐wide nonneurodegenerative neural changes correlated well with the greater reductions in RSFC among soman‐exposed females. Such a change indicated that severe neuronal network functional impairments, typically associated with the epileptic brain, 39 may coexist with mild neurodegenerative consequences in soman‐exposed females when compared to males. It is also likely that the females may have had exaggerated behavioral convulsive seizures due to the peripheral effects of AChE inhibition rather than the central effects. Recently, we had shown significant sex differences between behavioral vs EEG‐based SE severity. 15 Gender differences exist in the pharmacokinetics of atropine. The AUC (0‐inf) and Cmax for atropine were 15% higher in females than males; therefore, the half‐life of atropine is ~20 minutes shorter in females than males (FDA, 2018). An oxime, HI‐6, was used to reactivate AChE postsoman in this study. Despite no sex differences in tissue distribution of HI‐6, with a minimal brain penetration even after exposure to soman, enhanced efficacy of HI‐6 was reported in females. 40 It is probable that in females the peripheral and central actions of sex hormones may have contributed to the protective effects.
Epilepsy is known to increase iron deposits as determined by both human 41 , 42 and animal model studies. 43 , 44 Iron accumulation in the form of ferritin in the epileptogenic brain 41 , 43 , 44 can trigger downstream pathological processes such as ferroptosis, 45 , 46 which needs to be considered as a possible mechanism of neurodegeneration postnerve agent exposure. Females have lower levels of iron in serum and brain compared with men. Consequently, MRI images of males' brain showed higher iron concentrations in the cortical white matter and subcortical nuclei. 47 , 48 In SD rats, though nonheme iron levels are similar in both sexes, 49 neurological insults such as SE could alter their levels. 44 While it is not known whether lesser iron accumulation in females likely affected the lesser neurodegenerative consequence observed here, but with severe neural functional deficit of a nonatrophic nature, future sex‐based distinction in iron accumulation after nerve agent exposure may better answer this question. A caveat of iron accumulation is that it can intrinsically reduce the MRI T1 and T2 intensities, 50 leading to confounds of underestimating the T2 hyperintensities and overestimating the T1 hypointensities in the soman‐exposed animals. As the effect of iron is similar on T1 and T2, we estimated T1/T2 ratio as an unequivocal biomarker of neurodegeneration (free of the iron confound), which clearly reproduced the larger neurodegeneration across males when compared to females (Figure 3). Larger accumulation of iron in female rats exposed to soman may also lead to lesser T2* signal, which can diminish the BOLD‐fMRI fluctuation signals originating from the spontaneous neuronal activity. 31 , 51 While RSFC indeed diminished to a greater extent in soman‐exposed females than males, it is very unlikely that iron accumulation (if present) may have influenced RSFC reductions in a significant manner.
Although rats generally have a lower basal level of iron deposition in the brain, especially in young animals (<1 year), when compared to humans, 52 , 53 changes in iron homeostasis in pathological conditions can be sensitively measured by MRI approaches in specific regions of the rat brain. 54 It is well established that glial cells are the richest in iron and any iron dyshomeostasis leading to neurodegeneration can originate from both neurons and glia. 55 It is also feasible to estimate ferritin concentrations (a major component originating ferroptosis) based on measured iron concentrations and reasonable assumptions on iron load in the brain compartments. 55 If iron accumulation was indeed higher in soman‐exposed males, the present results indicating higher neurodegeneration across males clearly support the formulation of the ferroptosis hypothesis as a significant mechanism of neurodegeneration. However, severe functional consequences in the female brain after soman exposure evident from the RSFC measures warrant the consideration of alternative nonatrophic mechanisms after nerve agent exposure.
Other factors that may have influenced the MRI‐based sex differences in T1 and T2 contrast changes and functional connectivity are seizure‐induced mitochondrial response. Recent studies have suggested mitochondrial differences across males and females whereby intrinsic sex hormones afford protection to mitochondria in several pathological conditions, including SE. 56 In a recent 18F‐FDG‐PET study of mixed‐sex cohorts of Long–Evans rats, higher SUVs occurred in females than males, leading to the conclusion that the sex differences could emerge from different levels of nonradioactive glucose in blood plasma during isoflurane anesthesia. 57 While this limitation exists in the current study too, a further systematic correlation of nonradioactive glucose levels with fMRI outcomes in control and soman‐exposed brains in a mixed‐sex cohort may reveal the actual sex differences in soman‐induced pathological process in the brain. Further studies are also required to investigate early timepoints to gain a deeper understanding of the pathology and sex differences during the early phase of epileptogenesis.
5. CONCLUSIONS
Multimodal structural and functional MRI along with metabolic imaging is warranted to better understand the nuanced differences between sexes due to nerve agent exposure. As quantitative MRI and fMRI markers are available from larger nerve agent‐exposed clinical populations, differential iron accumulation as a biomarker and additional structural markers of neurodegeneration can be combined with functional measures of brain activity to gain a deeper understanding of distinct sex‐based brain outcomes. Furthermore, ferroptosis and mitochondrial vulnerability leading to energy metabolic failure enroute to greater neurodegeneration should be considered after nerve agent poisoning in males, while female mitochondrial resilience and upregulation of oxidative glucose utilization as a possible neuroprotective factor should be considered in females.
AUTHOR CONTRIBUTIONS
T. Thippeswamy contributed to conceptualization, funding acquisition, methodology, project administration, supervision, writing, reviewing, and editing; S. Kannurpatti contributed to methodology, data curation, conceptualization, image processing, and writing—original draft preparation; M. Gage contributed to visualization, investigation, and original draft preparation; SS Vasanthi, NS Rao, and C Meyer contributed to visualization, investigation, validation, and data curation; DR Thedens contributed to methodology and MRI acquisition.
CONFLICT OF INTEREST STATEMENT
The authors declare that there is no conflict of interest.
ANIMAL ETHICS STATEMENT
All animal procedures were approved by the IACUC of Iowa State University, the University of Iowa, and the MRI Global, Kansas City, MO.
ETHICAL PUBLICATION STATEMENT
We confirm that we have read the journal's position on issues involved in ethical publication and affirm that this report is consistent with those guidelines.
ACKNOWLEDGMENTS
This project is funded by the NIH/NINDS CounterACT program (U01 NS117284). Open access funding provided by the Iowa State University Library.
Gage M, Vasanthi SS, Meyer CM, Rao NS, Thedens DR, Kannurpatti SS, et al. Sex‐based structural and functional MRI outcomes in the rat brain after soman (GD) exposure‐induced status epilepticus. Epilepsia Open. 2023;8:399–410. 10.1002/epi4.12701
DATA AVAILABILITY STATEMENT
The raw data will be made available through the Iowa State University open source. Please contact the corresponding author (tswamy@iastate.edu).
REFERENCES
- 1. Gage M, Putra M, Wachter L, et al. Saracatinib, a Src tyrosine kinase inhibitor, as a disease modifier in the rat DFP model: sex differences, Neurobehavior, gliosis, neurodegeneration, and nitro‐oxidative stress. Antioxidants. 2022;11:61. [DOI] [PMC free article] [PubMed] [Google Scholar]
- 2. Gage M, Rao NS, Samidurai M, Putra M, Vasanthi SS, Meyer C, et al. Soman (GD) rat model to mimic civilian exposure to nerve agent: mortality, video‐EEG based status epilepticus severity, sex differences, spontaneously recurring seizures, and brain pathology. Front Cell Neurosci. 2022;15:573. [DOI] [PMC free article] [PubMed] [Google Scholar]
- 3. Gage M, Gard M, Thippeswamy T. Characterization of cortical glial scars in the rat diisopropylfluorophosphate (DFP) model of epilepsy. Front Cell Dev Biol. 2022;10:867949. [DOI] [PMC free article] [PubMed] [Google Scholar]
- 4. Putra M, Sharma S, Gage M, Gasser G, Hinojo‐Perez A, Olson A, et al. Inducible nitric oxide synthase inhibitor, 1400 W, mitigates DFP‐induced long‐term neurotoxicity in the rat model. Neurobiol dis. 2020;133:104443. 10.1016/j.nbd.2019.03.031 [DOI] [PMC free article] [PubMed] [Google Scholar]
- 5. Putra M, Gage M, Sharma S, et al. Diapocynin, an NADPH oxidase inhibitor, counteracts diisopropylfluorophosphate‐induced long‐term neurotoxicity in the rat model. Ann N Y Acad Sci. 2020;1479:75–93. [DOI] [PMC free article] [PubMed] [Google Scholar]
- 6. Dolgin E. Syrian gas attack reinforces need for better anti‐sarin drugs. Nat Med. 2013;19:1194–5. [DOI] [PubMed] [Google Scholar]
- 7. Ciottone GR. Toxidrome recognition in chemical‐weapons attacks. N Engl J Med. 2018;378:1611–20. [DOI] [PubMed] [Google Scholar]
- 8. Auta J, Costa E, Davis J, Guidotti A. Imidazenil: a potent and safe protective agent against diisopropyl fluorophosphate toxicity. Neuropharmacology. 2004;46:397–403. [DOI] [PubMed] [Google Scholar]
- 9. Grunwald J, Raveh L, Doctor BP, Ashani Y. Huperzine a as a pretreatment candidate drug against nerve agent toxicity. Life Sci. 1994;54:991–7. [DOI] [PubMed] [Google Scholar]
- 10. Kerenyi SZ, Murphy MR, Hartgraves SL. Toxic interactions between repeated soman and chronic pyridostigmine in rodents. Pharmacol Biochem Behav. 1990;37:267–71. [DOI] [PubMed] [Google Scholar]
- 11. Lemercier G, Carpentier P, Sentenac‐Roumanou H, Morelis P. Histological and histochemical changes in the central nervous system of the rat poisoned by an irreversible anticholinesterase organophosphorus compound. Acta Neuropathol. 1983;61:123–9. [DOI] [PubMed] [Google Scholar]
- 12. Prager EM, Figueiredo TH, Long RP, et al. LY293558 prevents soman‐induced pathophysiological alterations in the basolateral amygdala and the development of anxiety. Neuropharmacology. 2015;89:11–8. [DOI] [PMC free article] [PubMed] [Google Scholar]
- 13. Schultz MK, Wright LKM, de Araujo FM, et al. Caramiphen edisylate as adjunct to standard therapy attenuates soman‐induced seizures and cognitive deficits in rats. Neurotoxicol Teratol. 2014;44:89–104. [DOI] [PubMed] [Google Scholar]
- 14. Schultz MK, Wright LKM, Stone MF, Schwartz JE, Kelley NR, Moffett MC, et al. The anticholinergic and antiglutamatergic drug caramiphen reduces seizure duration in soman‐exposed rats: synergism with the benzodiazepine diazepam. Toxicol Appl Pharmacol. 2012;259:376–86. [DOI] [PubMed] [Google Scholar]
- 15. Rao NS, Meyer C, Vasanthi SS, et al. DFP‐induced status epilepticus severity in mixed‐sex cohorts of adult rats housed in the same room: behavioral and EEG comparisons. Front Cell Dev Biol. 2022;10:895092. 10.3389/FCELL.2022.895092 [DOI] [PMC free article] [PubMed] [Google Scholar]
- 16. Myhrer T, Enger S, Aas P. Anticonvulsant efficacy of drugs with cholinergic and/or glutamatergic antagonism microinfused into area tempestas of rats exposed to soman. Neurochem Res. 2008;33:348–54. [DOI] [PubMed] [Google Scholar]
- 17. Bhagat YA, Obenaus A, Hamilton MG, et al. Magnetic resonance imaging predicts neuropathology from soman‐mediated seizures in the rodent. Neuroreport. 2001;12:1481–7. [DOI] [PubMed] [Google Scholar]
- 18. Gullapalli RP, Aracava Y, Zhuo J, Neto EH, Wang J, Makris G, et al. Magnetic resonance imaging reveals that galantamine prevents structural brain damage induced by an acute exposure of Guinea pigs to soman. Neurotoxicology. 2010;31:67–76. [DOI] [PubMed] [Google Scholar]
- 19. Reddy SD, Wu X, Kuruba R, Sridhar V, Reddy DS. Magnetic resonance imaging analysis of long‐term neuropathology after exposure to the nerve agent soman: correlation with histopathology and neurological dysfunction. Ann N Y Acad Sci. 2020;1480:116–35. [DOI] [PMC free article] [PubMed] [Google Scholar]
- 20. Lee K, Bohnert S, Bouchard M, et al. Quantitative T2 MRI is predictive of neurodegeneration following organophosphate exposure in a rat model. Sci Rep. 2020;10:13007. 10.1038/S41598-020-69991-Z [DOI] [PMC free article] [PubMed] [Google Scholar]
- 21. Kilkenny C, Browne WJ, Cuthill IC, Emerson M, Altman DG. Improving bioscience research reporting: the ARRIVE guidelines for reporting animal research. PLoS Biol. 2010;8:e1000412. [DOI] [PMC free article] [PubMed] [Google Scholar]
- 22. Duncan JS, Papademetris X, Yang J, Jackowski M, Zeng X, Staib LH. Geometric strategies for neuroanatomic analysis from MRI. Neuroimage. 2004;23:S34–45. [DOI] [PMC free article] [PubMed] [Google Scholar]
- 23. Cox RW. AFNI: software for analysis and visualization of functional magnetic resonance neuroimages. Comput Biomed Res. 1996;29:162–73. [DOI] [PubMed] [Google Scholar]
- 24. Kannurpatti SS, Sanganahalli BG, Herman P, Hyder F. Role of mitochondrial calcium uptake homeostasis in resting state fMRI brain networks. NMR Biomed. 2015;28:1579–88. [DOI] [PMC free article] [PubMed] [Google Scholar]
- 25. Sanganahalli BG, Chitturi J, Herman P, Elkabes S, Heary R, Hyder F, et al. Supraspinal sensorimotor and pain‐related reorganization after a Hemicontusion rat cervical spinal cord injury. J Neurotrauma. 2021;38:3393–405. [DOI] [PMC free article] [PubMed] [Google Scholar]
- 26. Gage M, Putra M, Estrada CG, et al. Differential impact of severity and duration of status epilepticus, medical countermeasures, and a disease‐modifier, saracatinib (AZD0530), on brain regions in the rat diisopropylfluorophosphate (DFP) model. Front Cell Neurosci. 2021;15:426. [DOI] [PMC free article] [PubMed] [Google Scholar]
- 27. Luo X, Li K, Zeng Q, et al. Application of T1−/T2‐weighted ratio mapping to elucidate Intracortical demyelination process in the Alzheimer's disease continuum. Front Neurosci. 2019;13:904. 10.3389/FNINS.2019.00904 [DOI] [PMC free article] [PubMed] [Google Scholar]
- 28. Petracca M, El Mendili MM, Moro M, et al. Laminar analysis of the cortical T1/T2‐weighted ratio at 7T. Neurol Neuroimmunol Neuroinflammation. 2020;7:e900. 10.1212/NXI.0000000000000900 [DOI] [PMC free article] [PubMed] [Google Scholar]
- 29. Hyder DSF, Sanganahalli BG, Herman P, et al. Neurovascular and Neurometabolic couplings in dynamic calibrated fMRI: transient oxidative Neuroenergetics for block‐design and event‐related paradigms. Front Neuroenergetics. 2010;2:18. [DOI] [PMC free article] [PubMed] [Google Scholar]
- 30. Kannurpatti SS, Biswal BB, Kim YR, Rosen BR. Spatio‐temporal characteristics of low‐frequency BOLD signal fluctuations in isoflurane‐anesthetized rat brain. Neuroimage. 2008;40:1738–47. [DOI] [PMC free article] [PubMed] [Google Scholar]
- 31. Logothetis NK, Pauls J, Augath M, et al. Neurophysiological investigation of the basis of the fMRI signal. Nat. 2001;412:150–7. [DOI] [PubMed] [Google Scholar]
- 32. Raichle ME, MacLeod AM, Snyder AZ, et al. A default mode of brain function. Proc Natl Acad Sci U S A. 2001;98:676–82. [DOI] [PMC free article] [PubMed] [Google Scholar]
- 33. Sanganahalli BG, Herman P, Hyder F, Kannurpatti SS. Mitochondrial functional state impacts spontaneous neocortical activity and resting state fMRI. PLoS One. 2013;8:e63317. [DOI] [PMC free article] [PubMed] [Google Scholar]
- 34. Schwarz AJ, Gozzi A, Bifone A. Community structure and modularity in networks of correlated brain activity. Magn Reson Imaging. 2008;26:914–20. [DOI] [PubMed] [Google Scholar]
- 35. Biswal B, Zerrin Yetkin F, Haughton VM, Hyde JS. Functional connectivity in the motor cortex of resting human brain using echo‐planar MRI. Magn Reson Med. 1995;34:537–41. [DOI] [PubMed] [Google Scholar]
- 36. Cordes D, Haughton VM, Arfanakis K, Wendt GJ, Turski PA, Moritz CH, et al. Mapping functionally related regions of brain with functional connectivity MR imaging. AJNR Am J Neuroradiol. 2000;21:1636–44. [PMC free article] [PubMed] [Google Scholar]
- 37. Mishra AM, Bai X, Sanganahalli BG, et al. Decreased resting functional connectivity after traumatic brain injury in the rat. PLoS One. 2014;9:e95280. 10.1371/JOURNAL.PONE.0095280 [DOI] [PMC free article] [PubMed] [Google Scholar]
- 38. Parent M, Li Y, Santhakumar V, Hyder F, Sanganahalli BG, Kannurpatti SS. Alterations of parenchymal microstructure, neuronal connectivity, and cerebrovascular resistance at adolescence after mild‐to‐moderate traumatic brain injury in early development. J Neurotrauma. 2019;36:601–8. [DOI] [PMC free article] [PubMed] [Google Scholar]
- 39. Christiaen E, Goossens MG, Raedt R, Descamps B, Larsen LE, Craey E, et al. Alterations in the functional brain network in a rat model of epileptogenesis: a longitudinal resting state fMRI study. Neuroimage. 2019;202:116144. 10.1016/J.NEUROIMAGE.2019.116144 [DOI] [PubMed] [Google Scholar]
- 40. Lundy PM, Hand BT, Broxup BR, et al. Distribution of the bispyridinium oxime [14C] HI‐6 in male and female rats. Arch Toxicol. 1990;64:377–82. [DOI] [PubMed] [Google Scholar]
- 41. Zimmer TS, David B, Broekaart DWM, Schidlowski M, Ruffolo G, Korotkov A, et al. Seizure‐mediated iron accumulation and dysregulated iron metabolism after status epilepticus and in temporal lobe epilepsy. Acta Neuropathol. 2021;142:729–59. [DOI] [PMC free article] [PubMed] [Google Scholar]
- 42. Roggenhofer E, Toumpouli E, Seeck M, Wiest R, Lutti A, Kherif F, et al. Clinical phenotype modulates brain's myelin and iron content in temporal lobe epilepsy. Brain Struct Funct. 2022;227:901–11. [DOI] [PMC free article] [PubMed] [Google Scholar]
- 43. Gorter JA, Mesquita ARM, van Vliet EA, et al. Increased expression of ferritin, an iron‐storage protein, in specific regions of the parahippocampal cortex of epileptic rats. Epilepsia. 2005;46:1371–9. [DOI] [PubMed] [Google Scholar]
- 44. Aggarwal M, Li X, Gröhn O, Sierra A. Nuclei‐specific deposits of iron and calcium in the rat thalamus after status epilepticus revealed with quantitative susceptibility mapping (QSM). J Magn Reson Imaging. 2018;47:554–64. [DOI] [PMC free article] [PubMed] [Google Scholar]
- 45. Dixon SJ, Lemberg KM, Lamprecht MR, Skouta R, Zaitsev EM, Gleason CE, et al. Ferroptosis: an iron‐dependent form of nonapoptotic cell death. Cell. 2012;149:1060–72. [DOI] [PMC free article] [PubMed] [Google Scholar]
- 46. Yang T, Dai YJ, Chen G, Cui SS. Dissecting the dual role of the glial scar and scar‐forming astrocytes in spinal cord injury. Front Cell Neurosci. 2020;14:78. [DOI] [PMC free article] [PubMed] [Google Scholar]
- 47. Kumar N, Fagart J, Liere P, Mitchell SJ, Knibb AR, Petit‐Topin I, et al. Nestorone® as a novel progestin for nonoral contraception: structure‐activity relationships and brain metabolism studies. Endocrinology. 2017;158:170–82. [DOI] [PMC free article] [PubMed] [Google Scholar]
- 48. Ramos P, Santos A, Pinto NR, Mendes R, Magalhães T, Almeida A. Iron levels in the human brain: a post‐mortem study of anatomical region differences and age‐related changes. J Trace Elem Med Biol. 2014;28:13–7. [DOI] [PubMed] [Google Scholar]
- 49. Ba M, Kong M, Ma G. Postsynaptic density protein 95‐regulated NR2B tyrosine phosphorylation and interactions of Fyn with NR2B in levodopa‐induced dyskinesia rat models. Drug des Devel Ther. 2014;9:199–206. [DOI] [PMC free article] [PubMed] [Google Scholar]
- 50. Drayer B, Burger P, Hurwitz B, Dawson D, Cain J. Reduced signal intensity on MR images of thalamus and putamen in multiple sclerosis: increased iron content? AJR Am J Roentgenol. 1987;149:357–63. [DOI] [PubMed] [Google Scholar]
- 51. Salami A, Avelar‐Pereira B, Garzón B, Sitnikov R, Kalpouzos G. Functional coherence of striatal resting‐state networks is modulated by striatal iron content. Neuroimage. 2018;183:495–503. [DOI] [PubMed] [Google Scholar]
- 52. Suh YJ, David S. Age‐related changes in iron homeostasis and cell death in the cerebellum of ceruloplasmin‐deficient mice. J Neurosci. 2006;26:9810–9. [DOI] [PMC free article] [PubMed] [Google Scholar]
- 53. Liu CY, Yang Y, Ju WN, Wang X, Zhang HL. Emerging roles of astrocytes in neuro‐vascular unit and the tripartite synapse with emphasis on reactive gliosis in the context of alzheimer's disease. Front Cell Neurosci. 2018;12:193. [DOI] [PMC free article] [PubMed] [Google Scholar]
- 54. Olmedo‐Díaz S, Estévez‐Silva H, Orädd G, af Bjerkén S, Marcellino D, Virel A. An altered blood‐brain barrier contributes to brain iron accumulation and neuroinflammation in the 6‐OHDA rat model of Parkinson's disease. Neuroscience. 2017;362:141–51. [DOI] [PubMed] [Google Scholar]
- 55. Reinert A, Morawski M, Seeger J, Arendt T, Reinert T. Iron concentrations in neurons and glial cells with estimates on ferritin concentrations. BMC Neurosci. 2019;20:1–14. [DOI] [PMC free article] [PubMed] [Google Scholar]
- 56. Scharfman HE, MacLusky NJ. Sex differences in the neurobiology of epilepsy: a preclinical perspective. Neurobiol Dis. 2014;72:180–92. 10.1016/j.nbd.2014.07.004 [DOI] [PMC free article] [PubMed] [Google Scholar]
- 57. Sijbesma JWA, van Waarde A, Vállez García D, Boersma HH, Slart RHJA, Dierckx RAJO, et al. Test‐retest stability of cerebral 2‐Deoxy‐2‐[18F]Fluoro‐D‐glucose ([18F]FDG) positron emission tomography (PET) in male and female rats. Mol Imaging Biol. 2019;21:240–8. [DOI] [PubMed] [Google Scholar]
Associated Data
This section collects any data citations, data availability statements, or supplementary materials included in this article.
Data Availability Statement
The raw data will be made available through the Iowa State University open source. Please contact the corresponding author (tswamy@iastate.edu).