

Abstract
Objective
We used the lateral fluid percussion injury (LFPI) model of moderate‐to‐severe traumatic brain injury (TBI) to identify early plasma biomarkers predicting injury, early post‐traumatic seizures or neuromotor functional recovery (neuroscores), considering the effect of levetiracetam, which is commonly given after severe TBI.
Methods
Adult male Sprague–Dawley rats underwent left parietal LFPI, received levetiracetam (200 mg/kg bolus, 200 mg/kg/day subcutaneously for 7 days [7d]) or vehicle post‐LFPI, and were continuously video‐EEG recorded (n = 14/group). Sham (craniotomy only, n = 6), and naïve controls (n = 10) were also used. Neuroscores and plasma collection were done at 2d or 7d post‐LFPI or equivalent timepoints in sham/naïve. Plasma protein biomarker levels were determined by reverse phase protein microarray and classified according to injury severity (LFPI vs. sham/control), levetiracetam treatment, early seizures, and 2d‐to‐7d neuroscore recovery, using machine learning.
Results
Low 2d plasma levels of Thr231‐phosphorylated tau protein (pTAU‐Thr231) and S100B combined (ROC AUC = 0.7790) predicted prior craniotomy surgery (diagnostic biomarker). Levetiracetam‐treated LFPI rats were differentiated from vehicle treated by the 2d‐HMGB1, 2d‐pTAU‐Thr231, and 2d‐UCHL1 plasma levels combined (ROC AUC = 0.9394) (pharmacodynamic biomarker). Levetiracetam prevented the seizure effects on two biomarkers that predicted early seizures only among vehicle‐treated LFPI rats: pTAU‐Thr231 (ROC AUC = 1) and UCHL1 (ROC AUC = 0.8333) (prognostic biomarker of early seizures among vehicle‐treated LFPI rats). Levetiracetam‐resistant early seizures were predicted by high 2d‐IFNγ plasma levels (ROC AUC = 0.8750) (response biomarker). 2d‐to‐7d neuroscore recovery was best predicted by higher 2d‐S100B, lower 2d‐HMGB1, and 2d‐to‐7d increase in HMGB1 or decrease in TNF (P < 0.05) (prognostic biomarkers).
Significance
Antiseizure medications and early seizures need to be considered in the interpretation of early post‐traumatic biomarkers.
Keywords: inflammation, lateral fluid percussion injury, levetiracetam, neuromotor recovery, tau, traumatic brain injury
Key points.
The lateral fluid percussion injury (LFPI) model of moderate to severe brain trauma was used to identify early plasma protein biomarkers.
Early seizures and levetiracetam (LEV) affect the predictive value of early post‐traumatic plasma protein biomarkers.
Prior craniotomy is best predicted by low phosphorylated TAU (pTAU‐Thr231) and S100B plasma levels, 2 days after craniotomy in LFPI rats.
LEV prevented the seizure effects on plasma pTAU‐Thr231 and UCHL1. High 2d‐IFNγ plasma levels predicted LEV‐resistant early seizures.
Neuromotor recovery was predicted by S100B, HMGB1, TNF.
1. INTRODUCTION
Traumatic brain injury (TBI) is a major risk factor for acquired epilepsy (post‐traumatic epilepsy: PTE). Approximately 25% (16%‐50%) of individuals with severe TBI develop PTE. 1 , 2 Severe TBIs cause significant tissue damage, bleeding, neuronal and glial death, as well as axonal, vascular, and metabolic abnormalities. 3 , 4 , 5 , 6 During the acute post‐TBI period, post‐traumatic seizures may occur in 18%‐30% of patients with severe TBI who are under EEG monitoring. 7 , 8 , 9 , 10 Early post‐traumatic seizures, that is, those occurring within a week from TBI, are associated with increased rates of admission and length of stay in intensive care units, ventilation, hospital length of stay, and discharge to inpatient rehabilitation rather than home, 11 and carry a higher risk for PTE 9 , 11 or for developing hippocampal atrophy. 8 The Quality Standards Subcommittee of the American Academy of Neurology recommends the use of prophylactic antiseizure medications (ASMs) during the first week after severe TBI. 12 One of the commonly used ASMs is levetiracetam (LEV), 13 , 14 , 15 , 16 , 17 which has gained popularity due to the lack of significant drug interactions and good tolerability profile. However, there is no robust evidence for antiepileptogenic effects of LEV or other ASMs on PTE in humans. 15 , 18 , 19 , 20
Biomarkers, for example, blood‐based protein markers, magnetic resonance imaging (MRI), or electroencephalography (EEG), have been sought to provide molecular, anatomical, physiological, or functional information on the extent and/or progression of injury or epileptogenesis. 6 Clinical evidence for genetic factors, 21 , 22 , 23 , 24 , 25 contribution of TBI severity, 1 , 2 early EEG epileptiform activities 26 or seizures, including nonconvulsive ones, 8 , 9 in modifying risk for post‐traumatic seizures and PTE has been published. The search for biomarkers has also produced candidates that when obtained during the first hours after head trauma may predict intracranial injury and hemorrhage or long‐term outcomes (Glial Fibrillary Acidic Protein [GFAP] and Ubiquitin C‐Terminal Hydrolase [UCHL1]) 27 , 28 or 6‐12 month TBI outcomes (calcium binding protein S100B, neuron‐specific enolase [NSE], GFAP, UCHL1), 29 or recovery (TAU protein, neurofilament L [NFL]). 29
Among the models of TBI/PTE, the lateral fluid percussion injury (LFPI) model of moderate/severe TBI manifests spontaneous convulsive or nonconvulsive seizures (25%‐50% between 6 and 12 months post‐TBI) and is commonly used to study PTE. 30 , 31 In the preclinical Project 2 of the Epilepsy Bioinformatics Study for Antiepileptogenic Therapy (EpiBioS4Rx), we selected the LFPI model of severe TBI to explore candidate therapy targets and treatments but also identify blood‐based biomarkers for TBI and PTE. We used reverse phase protein microarray (RPPM) because it enabled us to study 12 biomarkers using small volumes of plasma. In this study, we used machine learning methods to identify the optimal early timepoints and plasma biomarker panels within the first week from TBI that predict injury, early seizure occurrence, and neuromotor system functional recovery assessed with the composite neuroscores in rats with severe LFPI. Comparison was done with naïve controls, equivalent to “healthy controls” often used in comparing protein biomarkers in clinical studies, as well as sham rats, to control for the effect of craniotomy, anesthesia, and analgesia which may also affect plasma biomarkers. Furthermore, we explored whether prophylactic use of LEV alters the levels of these biomarker panels, which would be important when comparing biomarker data from clinical trials where most of the patients with severe TBI are on prophylactic ASMs, such as LEV. 9
2. MATERIALS AND METHODS
2.1. Study design, animals
This was a prospective, vehicle‐controlled, randomized study; outcome assessments and protein biomarker analyses were done blinded to group allocation. Adult male Sprague Dawley rats were received between 9 and 10 weeks of age (Taconic Biosciences) and were individually housed in a 12 h light/12 h dark cycle (lights on from 07:00 to 19:00 h), in a controlled environment (temperature 20‐22°C; humidity 30%‐70%). Pellet food (Laboratory rodent diet 5001—Labdiet) and water were provided ad libitum. At 11 weeks of age, rats were randomized into 3 induction groups subjected to either lateral fluid percussion injury (LFPI) (n = 28), or sham craniotomy (n = 6) or naïve controls (n = 10) which did not undergo any surgical procedures. All procedures were approved by the Einstein Institutional Animal Care and Use Committee (protocol #20170107). Procedures and experiments were in accordance with the guidelines of the American Association for the Accreditation of Laboratory Animal Care, National Institutes of Health Guide for the Care and Use of Laboratory Animals and Animal Research: Reporting of in Vivo Experiment guidelines.
2.2. Craniotomy and LFPI induction
Rats received buprenorphine 0.05 mg/kg subcutaneously (SC), (Henry Schein) after isoflurane anesthesia induction. LFPI and shams underwent a 5 mm left parietal craniotomy under isoflurane anesthesia (5% induction, 1.5%‐2.5% maintenance, in 100% oxygen) with manual trephination (center coordinates: −4.5 mm posterior to bregma [AP], 3 mm left of midline [ML]), under continuous pulse oximetry and temperature control. 32 The female end of an 18G Luer lock needle adapter (3.5‐4 mm internal diameter) was fixed over the edges of the craniotomy with 3 M Vetbond tissue adhesive (n‐butyl cyanoacrylate, 3 M Animal products) and acrylic cement (Jet denture repair, Lang Dental Mfg Co Inc). The craniotomy hub was filled with sterile saline and anesthesia was discontinued. When the first toe pinch response was documented, LFPI rats were connected to the fluid percussion injury (FPI) device (AmScien Fluid Percussion Device model FP 302) through the Luer lock and were subjected to a ~3 atm pressure pulse. 30 , 31 , 33 , 34 , 35 Shams underwent the same procedures as LFPI, but no pressure pulse was given. Measurements of acute injury severity included: (a) time to first visible respiration (apnea time), (b) time to first toe pinch reflex (pain response), (c) time to first self‐righting behavior (SRT), from the time when pressure pulse was delivered (LFPI), or shams were connected to the FPI device. 35
2.3. Neuromotor system function assessment (neuroscore test)
A composite neuroscore value was assigned to each sham and LFPI rat using contraflexion, lateral pulsion and angle board tests 36 , 37 at baseline (before surgery), 2 days (2d), and 7d post‐craniotomy/LFPI. The composite neuroscore scale ranged from 0 to 28, with 0 indicating no response (maximal impairment) and 28 normal responses. Contraflexion test (score 0‐4 for each of the forelimbs) consisted in having the rat gently lifted by its tail and strength and position of forelimbs forward extension was assessed. Hindlimb flexion test (score 0‐4 for each of the hindlimbs) consisted in having the rat gently pulled back from its tail while eyes were covered. Strength and position of hindlimbs were then assessed. Lateral pulsion test (score 0‐4 for each side) assessed the strength of resistance of the rat as it was pushed sideways using a wooden ruler. In the angleboard test (score 0‐4) an inclined board covered with vertically grooved rubber mat was used as platform where the animal was placed on either facing up, facing to the left or right for at least 5 seconds without support. The angle of the board was gradually increased by 2.5° from 40° until the animal could no longer stand on the platform; the maximal angle where balance was maintained was recorded in baseline. Post‐surgery, the test started at an angle equal to “maximal angle at baseline testing −10°” and a point was deducted from the score for each 2.5° reduction in the angle. Neuromotor score tests were done by a blinded experimenter.
2.4. Treatments
Levetiracetam (LEV) (HY‐B0106, MedChem Express) was dissolved in 0.9% sterile saline. ALZET 2ML1 osmotic pumps (Durect Corporation) were filled with LEV (200 mg/kg/day, subcutaneous) or vehicle solution and kept at 37°C overnight for priming before implantation, as recommended by the manufacturer. LFPI rats received 200 mg/kg of LEV (LFPI‐LEV200, n = 14) or vehicle (LFPI‐LEV0, n = 14) intraperitoneally (i.p.) immediately after injury. An hour later, LFPI rats underwent subcutaneous (SC) placement of an ALZET 2ML1 minipump under isoflurane anesthesia ~1 cm posterior to the shoulder blade. Blood collection from the lateral tail vein was done under isoflurane anesthesia at 2d and 7d, prior to minipump removal (7d post‐implantation). Equivalent timepoints were used for sham and naïve control rats.
2.5. EEG electrode placement
Electrode implantation was done under isoflurane anesthesia (5% induction, 1.5%‐2% maintenance) immediately after minipump placement in LFPI rats to monitor for seizures and the effects of LEV. Six stainless steel epidural screw electrodes (EM/12/120, Plastics One) were placed in burr holes at the following coordinates: left and right prefrontal (Fp1, Fp2) +1.5 mm anterior to bregma (AP), ML ±2.5 mm; left and right central (C3, C4) −1.72 mm AP, ML ±2.5 mm; left and right occipital (O1, O2) −7.56 mm AP, ML ±2.5 mm. Ground and reference screw electrodes were placed over the cerebellum. In addition, two bipolar tungsten microelectrodes (EM12 T/5‐2TW/SP, 1 mm distance among tips Plastics One) were implanted into the anterior hippocampus, targeting CA1, and dentate gyrus (coordinate of longest tip: AP −3 mm, ML 1.4 mm left of midline, dorsoventral [DV] −3.6 mm from brain surface) and anterior or posterior perilesional cortices layers II and VI (anterior: AP −1.72 mm, ML 4 mm left, DV −1.8 mm, or posterior: AP −7.56 mm, ML 4 mm left, DV −1.8 mm). Rats were randomized to receive the hippocampal and one of the cortical microelectrodes.
2.6. Video‐EEG (vEEG) acquisition and monitoring
Immediately after electrode implantation, rats were connected to the vEEG system and monitored continuously. EEG was acquired using high‐density Digital Lynx SX, using Cheetah 6.4.1 software (Neuralynx) at a sampling rate of 2 kHz sampling rate, and low‐/high‐frequency filters set at 0.1 Hz and 500 Hz respectively. Video was recorded in gray scale on 640 × 480 pixels resolution using an infrared light for dark periods. Seizures were evolving patterns consisting of rhythmic spikes above baseline activity that rapidly progressed into high amplitude rhythmic spikes, spike–wave or polyspike–wave complexes, and eventually regressed into arrhythmic spike–waves with decreasing amplitude lasting ≥10 seconds. Bursts of spike‐wave discharges were not included in this analysis as they are commonly seen in rats. 38 , 39
2.7. Blood collection and plasma preparation
Blood samples were collected at 2d and 7d post‐surgery, or equivalent timepoints for naïve rats through lateral tail vein puncture under isoflurane anesthesia (induction 5% for 1 min, maintenance 2.5%), centrifuged at 1300 g for 10 min at 4°C, plasma was separated, aliquoted, and stored in Protein LoBind microcentrifuge tubes (#022431064, Thermo Fisher Scientific) at −80°C until analysis. Plasma samples were checked for hemoglobin using spectrophotometry (Nanodrop, Thermo Fisher Scientific); samples with absorbance greater than 0.25 at 414 nm, indicative of hemolysis, were excluded. 40
2.8. Protein biomarker analyses using RPPM
Plasma samples were analyzed by using the RPPM, a high sensitivity, high‐throughput proteomics platform according to established procedures (see Appendix S1 for details). 41 , 42 , 43 , 44 , 45 , 46 , 47 , 48 , 49 , 50 Denatured samples were serially diluted in a 1:2 manner (5‐step) and printed onto nitrocellulose film slides by using an Quanterix 2470 Arrayer. Slides were dried and blocked with Azure Protein‐Free Blocking Buffer and incubated with primary antibodies overnight (8‐12 h) at 4°C (see Table 1 for antibodies and dilution details). After washing, slides were incubated with biotinylated secondary antibodies (1:100 000 dilution), followed by tyramide‐based signal amplification. Slides were scanned in an Innopsys InnoScan 710‐IR scanner for XDR (extended dynamic range) signal acquisition at 785 nm. Fluorescence data were imported into a Microsoft Excel‐based bioinformatics program, and net intensity vs. dilution was plotted on a log2‐log2 scale. The total amount of antigen is determined by the Y‐axis intercept or Y‐cept (i.e., by extrapolating the regression line to zero). Here, we express the Y‐cept values as log2‐transformed Y‐cept values, which correspond to the total net intensity of the undiluted plasma sample.
TABLE 1.
List of primary antibodies, indications, commercial sources, and dilutions.
| Elevated levels indicate | Abbreviation (full name) | Source, catalogue number, dilution |
|---|---|---|
| Neuron and glia damage/injury | UCHL1 (Ubiquitin C‐Terminal Hydrolase) | Cell Signaling Technology, 11 896; 1:100 |
| GFAP (Glial Fibrillary Acidic Protein) | Abcam, ab7260; 1:1000 | |
| Axon damage/injury | TAU (Microtubule‐associated protein TAU) | Abcam, ab64193; 1:20 |
| pTAU‐Thr231 (Phosphorylated TAU at Thr231) | Sigma Aldrich, SAB4504563; 1:100 | |
| NFL (Neurofilament light) | ProteinTech, 12 998‐1‐AP, 1:100 | |
| Cell injury, death, activation of immune response to damage (Damage Associated Molecular Patterns: DAMPs) | HMGB1 (High mobility group box protein 1) | Abcam, ab79823; 1:100 |
| Hsp70 (Heat shock protein 70kD) | Abcam, ab194360; 1:100 | |
| S100B (calcium‐binding protein) | Abcam, ab52642, 1:100 | |
| Inflammation | IL‐1β (Interleukin 1 beta) | Abcam, ab2105; 1:50 |
| IL‐6 (Interleukin 6) | Protein Tech, 21 865‐1‐AP; 1:200 | |
| TNF (tumor necrosis factor) | Abcam, ab6671; 1:100 | |
| IFN‐γ (interferon gamma) | Abcam, ab133566; 1:50 |
2.9. Measurement of plasma LEV levels (University of Minnesota)
Plasma LEV was extracted from plasma and analyzed using liquid chromatography‐tandem mass spectrometry (LC–MS/MS) analysis as described in. 51 The standard concentrations were linear from 1 to 1000 mg/L. Relative standard deviation (SD) for replicate measurements in plasma samples was <5%.
2.10. Statistical analysis (severity assessments and neuroscore, biomarkers)
D'Agostino and Pearson tests were used to test distribution normality. T‐tests were used to compare variables that were normally distributed while Mann–Whitney test (for two groups) or Kruskal–Wallis test (for ≥3 groups) were used to compare variables that were not normally distributed. Differences in the mean protein plasma biomarker levels were analyzed with linear mixed model considering repeated measures when changes across time were studied (JMP Pro 16, SAS institute). Post hoc pairwise comparisons were done with Tukey's HSD and also Student's t‐test for exploring differences. Linear discriminant analysis (LDA) was used to distinguish between groups within the 12 biomarkers using leave‐one‐out cross‐validation. Penalized logistic regression with the Lasso penalty was also used to select biomarkers that were more important to the groupings whereas coefficients for variables with minimal contribution may be set as zero. Logistic regression was used on these selected biomarkers and the area under the receiver operating characteristic curve (ROC AUC) was computed. These analyses were conducted for the following comparisons: LFPI injury status (LFPI vs. no LFPI), LEV treatment [LFPI‐LEV200 vs. LFPI‐LEV0] (treatment exposure), early seizure status (yes vs. no) among all LFPI rats, early seizure status (yes vs. no) among LFPI‐LEV200 rats, early seizure status (yes vs. no) among LFPI‐LEV0 rats, and composite neuroscores (severe injury <18 vs. not ≥18) and were repeated for the following data from 2d alone, 7d alone, both days and changes from 2d to 7d. Penalized linear regression with Lasso penalty was used to analyze biomarkers associated with continuous composite neuroscore values. The biomarkers with non‐zero coefficients were selected and underwent linear regression to obtain a P‐value. These machine learning analyses were done using R version 4.0.3. 52 Statistical significance was set as P < 0.05.
3. RESULTS
3.1. Anesthesia duration, injury, and severity measures, composite neuroscores
Isoflurane anesthesia during the craniotomy lasted for 30.57 ± 5.17 seconds, with O2 saturation > 98% (Figure 1). There were no significant differences in FPI pulse pressure, the resultant apnea, time to pain response or SRT between LFPI‐LEV0 and LFPI‐LEV200 rats (t‐test comparisons). Both LFPI groups (n = 14 each) had significant prolongation of SRT compared to sham (n = 6) (LFPI‐LEV0 vs. sham P = 0.0054; LFPI‐LEV200 vs. sham P = 0.0016, Dunn's test). Composite neuroscores were impaired in both LFPI groups at 2d compared to baseline and sham and partially improved at 7d, without any differences between LFPI‐LEV0 and LFPI‐LEV200.
FIGURE 1.

LFPI induction conditions and injury severity assessments. (A) Injury induction conditions and early outcomes in LFPI‐LEV0, LFPI‐LEV200, and sham groups. No difference was found between LFPI‐LEV0 and LFPI‐LEV200 in any of the parameters observed after injury except for SRT which was significantly shorter in the sham groups compared to LFPI‐LEV0 or LFPI‐LEV200 groups (*P < 0.05 vs. sham). (B) Composite neuroscores in LFPI‐LEV0, LFPI‐LEV200, and sham rats at baseline (BL), 2 d, and 7 d show significant group and time‐dependent differences, as demonstrated in C. (C) P values for each comparison between group and timepoint, determined by Tukey HSD post hoc analyses, using linear mixed model with repeated measures. Both LFPI groups have significant differences from sham at every post‐LFPI timepoint. Both LFPI groups show significant deterioration in composite neuroscores at each post‐LFPI timepoint vs. BL, partial improvement from 2 d to 7 d, and no significant differences between LFPI‐LEV and LFPI‐LEV200. Sham show mild impairment of composite neuroscores post‐craniotomy but this is not statistically significant. Atm, atmospheres; BL, baseline; d, days; LEV200, levetiracetam 200 mg/kg bolus followed by 200 mg/kg/day treated LFPI rats; LFPI, lateral fluid percussion injury; LFPI‐LEV0, vehicle‐treated LFPI rats; SD, standard deviation; s, seconds; SRT, self‐righting time. (D) Electrographic early seizure in an LFPI rat, focal onset (left cortical) to bilateral. Sampling rate 2 kHz; low frequency filter 0.1 Hz; high frequency filter 500 Hz. Fp1/Fp2: left and right frontal; C3/C4: left and right central; O1/O2: left and right occipital; PoCx1/PoCx2: left posterior cortical microelectrodes; Hippo1/Hippo2: left hippocampal microelectrodes; Ref: right cerebellar reference (epidural screw electrode); ground: left cerebellar epidural screw electrode. Recording was done with the Neuralynx system.
3.2. Effect of hemolysis on protein biomarker levels
We did not find significant correlation between protein levels and Abs414, except for pTAU‐Thr231 (Figure S1). No significant differences were found in Abs414 across groups [F (3,70.9) = 1.33, P = 0.27] or timepoints [F (1,71) = 0.75, P = 0.389] using linear mixed model analyses with repeated measures.
3.3. Plasma protein biomarkers of LFPI and craniotomy
Reverse phase protein microarray results are presented in Table 2. Using linear mixed model analyses, 6 biomarkers were identified as candidate LFPI biomarkers, with altered protein levels at 2d post‐LFPI: UCHL1 and GFAP levels were higher than in sham, and IFNγ, pTAU‐Thr231, S100B, and HMGB1 levels were all lower than in naïve (Figure 2). The pTAU‐Thr231/TAU ratio was lower in LFPI vs. naïve rats. Sham rats with craniotomy only had lower pTAU‐Thr231 and S100B plasma levels at 2d and higher IL‐1β plasma levels at 7d compared to naïve rats.
TABLE 2.
Plasma protein biomarker expression by RPPM in LFPI, sham, and naïve rats
| Group | LFPI‐LEV0 | LFPI‐LEV200 | Naïve | Sham | ||||
|---|---|---|---|---|---|---|---|---|
| Timepoint | 2 d | 7 d | 2 d | 7 d | 2 d | 7 d | 2 d | 7 d |
| Abs (414 nm) | ||||||||
| n | 14 | 13 | 14 | 14 | 10 | 9 | 6 | 6 |
| Mean | 0.12 | 0.12 | 0.11 | 0.14 | 0.14 | 0.14 | 0.14 | 0.14 |
| SD | 0.04 | 0.05 | 0.03 | 0.05 | 0.04 | 0.03 | 0.03 | 0.04 |
| UCHL1 | ||||||||
| n | 12 | 12 | 11 | 14 | 10 | 9 | 6 | 4 |
| Mean | 10.96 | 9.41 | 6.16 | 8.76 | 7.88 | 8.03 | 7.04 | 10.38 |
| SD | 2.91 | 2.68 | 4.00 | 3.38 | 4.70 | 4.55 | 1.62 | 4.97 |
| GFAP | ||||||||
| n | 14 | 13 | 14 | 14 | 10 | 9 | 6 | 6 |
| Mean | 14.10 | 14.40 | 13.84 | 14.07 | 13.56 | 13.82 | 12.81 | 13.49 |
| SD | 1.15 | 0.97 | 1.14 | 1.09 | 0.81 | 0.91 | 0.65 | 0.91 |
| pTAU‐Thr231 | ||||||||
| n | 14 | 13 | 14 | 14 | 10 | 9 | 6 | 6 |
| Mean | 13.29 | 14.00 | 14.17 | 14.26 | 15.37 | 14.71 | 13.69 | 14.08 |
| SD | 1.08 | 1.64 | 0.89 | 1.02 | 0.93 | 1.62 | 0.93 | 1.25 |
| S100B | ||||||||
| n | 14 | 13 | 14 | 14 | 10 | 9 | 6 | 6 |
| Mean | 10.25 | 11.66 | 9.63 | 10.69 | 12.15 | 10.41 | 10.01 | 10.31 |
| SD | 2.24 | 2.45 | 1.77 | 2.62 | 1.15 | 2.86 | 1.86 | 1.25 |
| IL‐1β | ||||||||
| n | 14 | 13 | 14 | 14 | 10 | 9 | 6 | 6 |
| Mean | 19.35 | 20.97 | 21.17 | 21.80 | 20.48 | 20.65 | 20.38 | 22.06 |
| SD | 5.58 | 1.03 | 1.77 | 1.02 | 1.82 | 0.73 | 1.78 | 0.75 |
| IL‐6 | ||||||||
| n | 14 | 13 | 14 | 14 | 10 | 9 | 6 | 6 |
| Mean | 16.44 | 16.70 | 16.92 | 17.33 | 16.27 | 17.19 | 16.84 | 17.32 |
| SD | 2.09 | 0.97 | 0.78 | 1.59 | 0.54 | 1.22 | 0.95 | 1.03 |
| IFNγ | ||||||||
| n | 13 | 12 | 14 | 14 | 10 | 9 | 6 | 6 |
| Mean | 13.13 | 14.35 | 15.28 | 15.19 | 15.11 | 14.65 | 13.96 | 14.00 |
| SD | 2.65 | 1.20 | 1.32 | 3.48 | 1.26 | 1.02 | 0.59 | 0.91 |
| HMGB1 | ||||||||
| n | 14 | 13 | 14 | 14 | 10 | 9 | 6 | 6 |
| Mean | 13.78 | 14.33 | 15.76 | 16.28 | 15.19 | 15.58 | 14.18 | 14.78 |
| SD | 1.32 | 1.53 | 1.19 | 1.42 | 1.66 | 1.11 | 0.81 | 1.26 |
| TAU | ||||||||
| n | 14 | 13 | 14 | 14 | 10 | 9 | 6 | 6 |
| Mean | 16.07 | 17.01 | 16.25 | 17.02 | 15.35 | 15.78 | 15.10 | 15.55 |
| SD | 1.65 | 1.39 | 1.69 | 1.67 | 1.31 | 1.62 | 0.75 | 1.19 |
| HSP70 | ||||||||
| n | 14 | 13 | 14 | 14 | 10 | 9 | 6 | 6 |
| Mean | 14.10 | 13.87 | 12.73 | 14.07 | 14.63 | 14.48 | 13.81 | 13.82 |
| SD | 2.09 | 2.33 | 2.57 | 2.89 | 2.19 | 1.31 | 2.07 | 0.75 |
| pTAU‐Thr231/TAU | ||||||||
| n | 14 | 13 | 14 | 14 | 10 | 9 | 6 | 6 |
| Mean | 0.83 | 0.83 | 0.88 | 0.84 | 1.01 | 0.94 | 0.91 | 0.91 |
| SD | 0.10 | 0.10 | 0.10 | 0.07 | 0.10 | 0.15 | 0.06 | 0.11 |
| NFL | ||||||||
| n | 14 | 12 | 14 | 14 | 9 | 10 | 6 | 6 |
| Mean | 13.59 | 13.85 | 15.68 | 14.24 | 13.98 | 13.89 | 14.01 | 13.62 |
| SD | 0.82 | 0.75 | 2.15 | 1.19 | 0.90 | 1.77 | 0.71 | 0.90 |
| TNF | ||||||||
| n | 14 | 13 | 14 | 14 | 10 | 10 | 6 | 6 |
| Mean | 12.87 | 12.59 | 13.16 | 12.69 | 13.29 | 13.13 | 13.27 | 12.66 |
| SD | 0.89 | 1.16 | 0.48 | 0.75 | 0.70 | 0.58 | 0.50 | 0.68 |
Note: The protein level of each marker is expressed as the log2‐transformed Y‐cept derived from the RPPM assay and is a measure of the total net intensity of the biomarker in the undiluted plasma sample.
Abbreviations: Abs(414 nm), absorbance at 414 nm (hemoglobin) to assess hemolysis; d, day; GFAP, glial fibrillary acidic protein; HMGB1, high mobility group box protein 1; HSP70, heat shock protein 70 kD; IFNγ, interferon γ; IL‐1β, Interleukin 1β; IL‐6, Interleukin‐6; LFPI‐LEV0, vehicle‐treated LFPI rats; LFPI‐LEV200, levetiracetam 200 mg/kg bolus i.p. followed by 200 mg/kg/day treated LFPI rats; NFL, neurofilament light chain; pTAU‐Thr231, phosphorylated TAU at Thr231; RPPM, reverse phase protein microarray; S100B, calcium binding protein S100B; SD, standard deviation; TAU, microtubule‐associated protein; TNF, tumor necrosis factor; UCHL1, ubiquitin C‐terminal hydrolase.
FIGURE 2.

Plasma protein biomarker levels in LFPI‐LEV0, LFPI‐LEV200, sham, and naïve control rats at 2 d or 7 d post‐craniotomy/LFPI and equivalent timepoints in controls. (A) Plasma levels of the biomarkers expressed as log2‐transformed Y‐cept values, representing total biomarker signal intensity of undiluted plasma sample. (B) Summary of significant pairwise differences in plasma biomarker levels. The matrices depict significant pairwise differences of LFPI‐LEV0, LFPI‐LEV200 or sham vs. the rest of the groups from the same day (2 d or 7 d), using the pairwise Student's t‐test results (P < 0.05). “Higher” (red boxes) or “lower” (blue boxes) values indicate higher or lower levels respectively in the reference group (left columns, i.e., LFPI‐LEV0 or LFPI‐LEV200, or Sham in each table) vs. the comparator group indicated in each column, during the same timepoint. Statistical comparisons were done by linear mixed model analyses, considering repeated measures. Pairwise comparisons were done with Tukey HSD (red arrows indicate P < 0.05) and for exploratory purpose with Student t‐tests (blue arrows indicate P < 0.05). d, days; GFAP, glial fibrillary acidic protein; HMGB1, high mobility group box protein 1; HSP70, heat shock protein 70 kD; IFNγ, interferon γ; IL‐1β, Interleukin 1β; IL‐6, Interleukin‐6; LFPI‐LEV0, vehicle‐treated LFPI rats; LFPI‐LEV200, levetiracetam 200 mg/kg bolus i.p. followed by 200 mg/kg/day treated LFPI rats; NFL, neurofilament light chain; pTAU‐Thr231, phosphorylated TAU at Thr231; S100B, calcium‐binding protein S100B; TAU, microtubule‐associated protein; TNF, tumor necrosis factor; UCHL1, ubiquitin C‐terminal hydrolase.
3.4. LEV treatment effects on plasma biomarkers
LFPI‐LEV200 had lower UCHL1 levels and higher pTAU‐Thr231, IFNγ, HMGB1, and NFL plasma levels at 2d, and higher IL‐1β and HMGB1 plasma levels at 7d (Figure 2). Specifically, LEV treatment abolished the LFPI‐related differences in UCHL1 plasma levels from the sham rats and in plasma HMGB1 and IFNγ levels from naïve controls at 2d. LEV treatment did not affect GFAP plasma levels in LFPI rats, which were still elevated compared to sham. LEV was not sufficient to restore plasma pTAU‐Thr231 or S100B levels, or pTAU‐Thr231/TAU ratio to naïve control levels. On the other hand, LFPI‐LEV200 rats had reduced HSP70 levels compared to naïve, even though HSP70 was not affected by LFPI.
At 7d post‐LFPI, fewer group differences in biomarker values were noted than at 2d, and LFPI‐LEV0 rats had reduced IL‐1β and pTAU‐Thr231/pTAU levels compared to sham and lower HMGB1 levels than naïve rats. LFPI‐LEV200 had similar IL‐1β plasma levels to sham rats and both LFPI‐LEV200 and sham had elevated IL‐1β plasma levels compared to naïve rats. LFPI‐LEV200 rats also had lower pTAU‐Thr231/TAU plasma levels than sham.
All comparisons that reached statistical significance with Tukey HSD tests in Figure 2 had power >80%.
3.5. Linear discriminant analysis (LDA) of plasma biomarkers
We used LDA to explore the predictive accuracy of biomarker panels that emerged from the linear mixed model analyses for LFPI status and LEV treatment. We excluded the pTAU‐Thr231/TAU ratio from LDA given that the value range of this ratio was very different from the 12 protein biomarkers.
3.5.1. Biomarkers of LFPI
Using LDA on the 2d panel of the 12 biomarkers, we differentiated LFPI from no LFPI groups with an accuracy of 74%. However, when we included only the 6 biomarkers that emerged from the linear mixed model analyses as altered by LFPI, namely UCHL1, GFAP, pTAU‐Thr231, S100B, IFNγ, HMGB1, the LFPI group was differentiated from the no LFPI groups with excellent accuracy of 81%.
3.5.2. Biomarkers of LEV treatment
Linear discriminant analysis on the 2d panel of 12 biomarkers predicted LFPI‐LEV200 from LFPI‐LEV0 with a modest predictive accuracy of 68%, suggesting that additional factors or biomarkers need to be considered.
3.6. Effects of early post‐TBI seizures on plasma biomarker levels of LFPI‐LEV200 and LFPI‐LEV0
The vEEG analyses during the first post‐TBI week revealed that 50% (10/20 rats) of the LFPI‐LEV0 rats had early seizures vs. 38% of the LFPI‐LEV200 (8/21 rats) (P = 0.5063, Pearson's chi‐square test), which occurred the first 2d post‐LFPI (Figure 3). An example of an early seizure is shown in Figure 1D.
FIGURE 3.

Effects of early post‐LFPI seizures and LEV upon protein biomarkers in LFPI rats. (A) Plasma levels of the biomarkers expressed as log2‐transformed Y‐cept values, representing total biomarker signal intensity of undiluted plasma sample, in LFPI‐LEV0 (LEV0 in the graphs) and LFPI‐LEV200 (LEV200 in the graphs) rats with (Sz) or without seizures (No Sz) at 2 d or 7 d post‐LFPI. (B) Summary of the significant pairwise differences in plasma biomarker levels observed in the mixed model analyses with repeated measures shown in panel A. “Higher” (red boxes) or “lower” (blue boxes) indicate higher or lower levels respectively in the reference group [left columns of each table, i.e., LFPI‐LEV0 with seizures (LFPI‐LEV0, Sz), or LFPI‐LEV200 with seizures (LFPI‐LEV200, Sz), or LFPI‐LEV0 without seizures (LFPI‐LEV0, No Sz)] vs. the comparator group indicated in each column of the matrix, during the same timepoint. Early seizures and LEV treatment significantly alter plasma levels of several biomarkers, including pTAU‐Thr231, pTAU‐Thr231/TAU, UCHL1, IFNγ, HMGB1, NFL. The presence of early seizures is associated with lower levels of 2d‐pTAU‐Thr231 and 2d‐pTAU‐Thr231/TAU only in LFPI rats that were not treated with LEV, but this effect is transient and not seen at 7d. LFPI‐LEV0 rats with early seizures have higher levels of UCHL1 at 2d than LFPI‐LEV200 rats with or without seizures. On the other hand, the presence of early seizures in LFPI‐LEV200 rats is marked by higher 2d‐IFNγ plasma levels than in LFPI‐LEV0 or LFPI rats without early seizures. LFPI‐LEV200 rats have higher HMGB1 plasma levels at both 2 d and 7 d, regardless of early seizure presence. LFPI‐LEV200 rats have higher NFL plasma levels at 2 d but not at 7 d, regardless of early seizure presence. Significant pairwise differences after linear mixed model analyses and post hoc Tukey HSD (red arrows) or Student's t‐test (blue arrows). d, days; GFAP, glial fibrillary acidic protein; HMGB1, high mobility group box protein 1; HSP70, heat shock protein 70 kD; IFNγ, interferon γ; IL‐1 β, Interleukin 1β; IL‐6, Interleukin‐6; LFPI‐LEV0, vehicle‐treated LFPI rats; LFPI‐LEV200, levetiracetam 200 mg/kg bolus i.p. followed by 200 mg/kg/day treated LFPI rats; NFL, neurofilament light chain; pTAU‐Thr231, phosphorylated TAU at Thr231; S100B, calcium‐binding protein S100B; Sz, early seizures; TAU, microtubule‐associated protein; TNF, tumor necrosis factor; UCHL1, ubiquitin C‐terminal hydrolase.
Biomarker data from LFPI rats were therefore analyzed according to early seizure presence in LEV (n = 14) or vehicle‐treated LFPI rats (n = 14), which were randomly selected and had acceptable Abs414. Early post‐TBI seizures were associated with lower 2d plasma pTAU‐Thr231 levels and pTAU‐Thr231/TAU ratio and higher 2d‐UCHL1 plasma levels, but only in LFPI‐LEV0 rats, suggesting that LEV treatment counteracted the effects of seizures on plasma pTAU‐Thr231 and UCHL1 levels. The seizure effect on 2d‐pTAU‐Thr231 and 2d‐UCHL1 levels was transient and not seen at 7d. In contrast, early seizures in the LFPI‐LEV200 group were associated with elevated 2d‐IFNγ plasma levels, suggesting that 2d‐IFNγ may be a marker of LEV‐resistant early seizures.
LFPI‐LEV200 rats had higher plasma 2d‐HMGB1 and 2d‐NFL levels than LFPI‐LEV0 rats, irrespective of whether they had early seizures or not; the increase in 2d‐HMGB1 plasma levels persisted until 7d only in LFPI rats with early seizures, whereas the LEV‐associated increase in 2d‐NFL levels was transient.
The power for all comparisons that reached significance with Tukey HSD test in Figure 3 was greater than 80% except for two comparisons. The comparison of 2d‐IFNγ in LFPI‐LEV200 with seizures (LFPI‐LEV200‐Sz) vs. 2d‐LFPI‐LEV200 without seizures (LFPI‐LEV200‐No Sz) had power of 78.4% with sample sizes of 5 and 8. To reach the power of 80%, we would need to have sample sizes of 8 and 8. The power for the comparison of 2d‐HMGB1 LFPI‐LEV200‐Sz vs. 2d‐LFPI‐LEV0‐Sz was 79.2% with sample sizes of 5 and 5. To reach the power of 80%, we will need to have sample sizes of 6 and 6.
3.7. Selection of best predictive biomarkers using penalized logistic regression models with the Lasso penalty
To select the most predictive biomarkers for LFPI, LEV treatment, early seizures, and composite neuroscore recovery, we used penalized logistic regression with the Lasso penalty (Figures 4 and 5).
FIGURE 4.
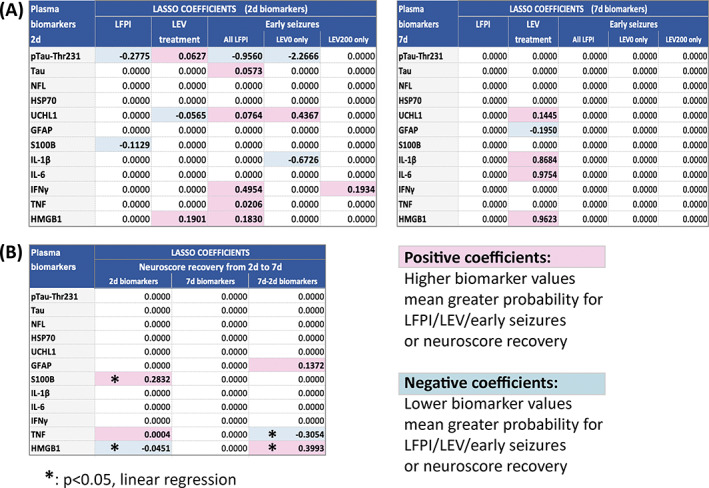
Selection of the most predictive biomarkers with the penalized logistic regression with the Lasso penalty. (A) LASSO coefficients of 2d and 7d biomarkers predicting LFPI, LEV treatment or early seizures considering all LFPI rats combined, LFPI‐LEV0 only, or LFPI‐LEV200 only. The 2 d biomarkers offer better prediction for LFPI status or early seizures whereas both 2 d and 7 d biomarkers were predictive of LEV treatment. (B) LASSO coefficients of 2 d, 7 d, or change from 2 d to 7 d plasma biomarkers predicting neuromotor functional recovery based on composite neuroscore improvement from 2 d to 7 d. Better neuromotor functional recovery (i.e., composite neuroscore improvement) from 2 d to 7 d is predicted by higher S100B and lower HMGB1 plasma levels at 2 d post‐LFPI and increase in HMGB1 and decrease in TNF plasma levels from 2 d to 7 d. Although 2d‐TNFα and (7d‐2d)‐GFAP plasma levels had non‐zero predictive coefficients, further linear regression showed borderline (P = 0.053) statistical significance for 2d‐TNF and no significance for (7d‐2d)‐GFAP (P = 0.185). d, days; GFAP, glial fibrillary acidic protein; HMGB1, high mobility group box protein 1; HSP70, heat shock protein 70 kD; IFNγ, interferon γ; IL‐1β, Interleukin 1β; IL‐6, Interleukin‐6; LFPI‐LEV0, vehicle‐treated LFPI rats; LFPI‐LEV200, levetiracetam 200 mg/kg bolus i.p. followed by 200 mg/kg/day treated LFPI rats; NFL, neurofilament light chain; pTAU‐Thr231, phosphorylated TAU at Thr231; S100B, calcium binding protein S100B; TAU, microtubule‐associated protein; TNF, tumor necrosis factor; UCHL1, ubiquitin C‐terminal hydrolase.
FIGURE 5.

ROC curves of biomarkers of LFPI or craniotomy (A), Levetiracetam (B) and early seizures (C). (A) ROC curves for biomarkers predicting LFPI vs. controls (sham or naïve), LFPI vs. controls only, or Sham ve controls (diagnostic biomarkers). (B) ROC curves for biomarkers predicting LEV treatment among LFPI rats (pharmacodynamic biomarkers). (C) ROC curves for biomarkers predicting early seizures among LFPI‐LEV0 (prognostic biomarkers) and LFPI‐LEV200 rats (prognostic or response biomarkers). The ROC AUC values (in parentheses) of the selected biomarkers are presented under each ROC. Biomarkers are color matched to the corresponding biomarker's ROC line. “Combined” means combination of the selected predictive biomarkers for each characteristic.
3.7.1. Best biomarkers predicting LFPI and/or craniotomy
Comparison of LFPI vs. no LFPI (control or sham) yielded as best predictors low 2d‐pTAU‐Thr231 (Lasso coefficient −0.2775; ROC AUC = 0.7277) and 2d‐S100B (Lasso coefficient −0.1129; ROC AUC = 0.7143) plasma levels alone or in combination (ROC AUC = 0.7790). However, these two biomarkers did not differ significantly between LFPI and Sham (Figure 2) and differentiated equally well the LFPI from naïve controls and the Sham from naïve controls (Figure 5), suggesting that these are biomarkers of Sham craniotomy rather than biomarkers of LFPI or injury severity. No biomarker of LFPI status emerged at 7d.
3.7.2. Best biomarkers predicting LEV treatment
More biomarkers predicted LEV treatment at 7d (high IL‐6, HMGB1, IL‐1β and UCHL1, and low GFAP) than at 2d. The selected 2d biomarkers of LEV treatment included high 2d‐HMGB1 (ROC AUC 0.8485) or 2d‐pTAU‐Thr231 (ROC AUC = 0.8333) and low 2d‐UCHL1 (ROC AUC = 0.8182). The use of combined 2d‐pTAU‐Thr231, 2d‐HMGB1, and 2d‐UCHL1 data yielded an excellent ROC AUC = 0.9394.
3.7.3. Best biomarkers predicting early seizures
Considering all LFPI rats, the following biomarkers were selected as best predictors of early seizures, by order of magnitude of their coefficient: low 2d‐pTAU‐Thr231, and elevated 2d‐IFNγ, 2d‐HMGB1, 2d‐UCHL1, 2d‐TAU, 2d‐TNF. However, the biomarker panels predicting early seizures differed depending on LEV treatment. Among LFPI‐LEV0 rats, low 2d‐pTAU‐Thr231 (ROC AUC = 1) and high 2d‐UCHL1 (ROC AUC = 0.833) were most predictive of early seizures. In contrast, early seizures in the presence of LEV (LFPI‐LEV200 rats) were best predicted by high plasma 2d‐IFNγ levels (ROC AUC = 0.875), suggesting that this may be a biomarker of LEV‐resistant early seizures. No biomarker of early seizures emerged from the 7d data.
3.7.4. Best biomarkers for neuromotor (composite neuroscore) functional recovery from 2d to 7d post‐LFPI
Using penalized linear regression with Lasso penalty, the biomarkers that emerged as best predictors of neuromotor functional recovery, based on non‐zero coefficients, were: high 2d‐S100B, low 2d‐HMGB1, high 2d‐TNF, 2d‐to‐7d change in TNF (reduction at 7d), HMGB1 (increase at 7d), and GFAP (increase at 7d). However, linear regression fit using only this subset of selected biomarkers confirmed a significant predictive value for the 2d‐S100B (P = 0.009), 2d‐HMGB1 (P = 0.026), (7d‐2d)‐HBGB1 (P = 0.001), and (7d‐2d)‐TNF (P = 0.02), whereas 2d‐TNF had borderline significance (P = 0.053) and (7d‐2d)‐GFAP was not significant (P = 0.185). Figure 6 illustrates the summary of the 2d biomarker results.
FIGURE 6.

Plasma protein biomarkers of LFPI injury, early seizures, LEV treatment, and neuromotor functional recovery in the LFPI model, at 2 d post‐LFPI. LFPI injury is predicted by low pTAU‐Thr231 and S100B plasma levels. Early seizures are predicted by high UCHL1 and low pTAU‐Thr231 plasma levels in LFPI‐LEV0 rats and by high IFNγ plasma levels in LEV‐treated LFPI rats, suggesting that high IFNγ plasma levels may serve as marker of early seizures despite LEV treatment, and therefore of LEV resistance. The effects of LEV treatment are predicted by high HMGB1 plasma levels and full or partial normalization of UCHL1 and pTAU‐Thr231 plasma levels. LEV treatment of LFPI rats is also associated with high NFL plasma levels, positively correlating with the duration of post‐LFPI apnea. Neuromotor functional recovery (i.e., composite neuroscore improvement) from 2 d to 7 d is predicted by higher S100B and lower HMGB1 plasma levels at 2 d post‐LFPI. Red arrows indicate increase and gray arrows decrease of a biomarker plasma levels under a specific condition. Biomarkers in yellow boxes have emerged as best predictors in penalized logistic regression with the Lasso penalty. GFAP, glial fibrillary acidic protein; HMGB1: High mobility group box protein 1; IFNγ, interferon γ; NFL, neurofilament light chain; pTAU‐Thr231, phosphorylated TAU at Thr231; S100B, calcium binding protein S100B; UCHL1, Ubiquitin C‐Terminal Hydrolase.
3.8. 2d‐NFL plasma levels are higher in LFPI‐LEV200 rats with long apnea durations
We further investigated whether the duration of anesthesia or the injury severity, as assessed by the early outcome assessments (apnea, SRT, time to first pain response) contributed to the apparent changes in plasma biomarker levels in LFPI rats and as a function of LEV treatment (Figure 7). The only significant correlation was a positive correlation between 2d‐NFL plasma levels and apnea durations (P = 0.032), which was selectively seen in the LFPI‐LEV200 rats (P = 0.001) and not in LFPI‐LEV0. LFPI‐LEV200 rats with longer apneas (>20 seconds) had higher 2d‐NFL levels than those with shorter apnea times (P = 0.02); however, this was not observed in LFPI‐LEV0 rats. These data suggest that LEV treatment of LFPI rats may have enhanced the impact of injuries with long apnea times on the 2d‐NFL plasma levels.
FIGURE 7.

Plasma NFL levels at 2d post‐TBI are higher in LFPI‐LEV200 rats with longer apnea times. (A) Plasma 2d‐NFL levels correlate positively with apnea duration in LFPI‐LEV200 rats (P = 0.001) but not in LFPI‐LEV0 (P = 0.959). Linear regression plots for the two groups are shown in this panel. (B). Plasma 2d‐NFL levels are higher in LFPI‐LEV200 rats with apneas longer than 20 s (P = 0.02, Exact test, Wilcoxon/Kruskal–Wallis test). ANOVA yielded significant effects for LEV treatment (F = 13.818, P = 0.001), apnea >20 s (F = 8.032, P = 0.009), and the interaction of LEV treatment and apnea >20 s (F = 6.211, P = 0.02). LFPI‐LEV0, vehicle‐treated LFPI rats; LFPI‐LEV200, levetiracetam 200 mg/kg bolus i.p. followed by 200 mg/kg/day treated LFPI rats; NFL, neurofilament light chain.
3.9. Correlations between plasma biomarker levels 2d post‐LFPI
We looked at possible correlations between plasma biomarkers at 2d post‐LFPI, the timepoint when most of the biomarker changes were noted (Figure S2). Positive correlations were seen between biomarkers indicating (a) axonal injury (NFL, TAU), (b) inflammation (IFNγ, IL‐1β) (c) axonal injury (TAU or pTAU‐Thr231 or NFL), and inflammation (IFNγ or HMGB1), or (d) cell and glial injury (HSP70 and GFAP), (e) inflammation (IL‐1β), and glial injury (GFAP). Negative correlations were seen between biomarkers of (a) cell injury (S100B, UCHL1) and inflammation (IL‐1β, IFNγ), or (β) inflammation (IL6 with IFNγ).
In the presence of LEV, most of these correlations were preserved or new ones emerged (e.g., NFL or pTAU‐Thr231 or TNF with HMGB1, GFAP with pTAU‐Thr231 or IL‐1β, pTAU‐Thr231 with S100B). In contrast, in LFPI‐LEV0 rats, most of these correlations were lost, suggesting that LEV treatment may promote the coregulation of plasma biomarkers. Similar analyses as a function of early seizure status did not yield any consistent patterns of coregulation of plasma biomarker levels.
3.10. Plasma levels of levetiracetam
Plasma levels of LEV were determined in a subset of rats. LEV plasma concentration was 25.89 ± 5.94 μg/mL at 2d and 19.56 ± 5.91 μg/mL at 1 week.
4. DISCUSSION
Using machine learning, we identified panels of plasma biomarkers that offer excellent prediction alone or in tandem for LEV treatment (2d‐pTAU‐Thr231, 2d‐HMGB1, 2d‐UCHL1), recent early seizures (2d‐pTAU‐Thr231 and 2d‐UCHL1 in LFPI‐LEV0; 2d‐IFNγ in LFPI‐LEV200), craniotomy surgery (2d‐pTAU‐Thr231, 2d‐S100B), and neuromotor recovery [(7d‐2d)‐HMGB1, (7d‐2d)‐TNF, 2d‐S100B] during the first post‐TBI week. Prophylactic LEV treatment may fully or partially modify certain plasma biomarkers of early post‐traumatic seizures (2d‐UCHL1, 2d‐pTAU‐Thr231) or increase others (2d‐HMGB1). However, several plasma biomarkers altered by injury or craniotomy surgery (2d‐GFAP, 2d‐S100B) were not altered by LEV, whereas plasma 2d‐NFL levels were specifically higher in LEV‐treated LFPI rats and associated with longer apneas. Our findings highlight the importance of incorporating factors that are commonly encountered in the clinical setting (prophylactic antiseizure medications, seizures, injury severity) when interpreting early post‐TBI biomarkers.
Although several biomarkers were altered at 2d between LFPI and controls and/or sham rats (Figure 2), penalized regression with LASSO penalty selected 2d‐pTAU‐Thr231 and 2d‐S100B plasma levels as strong predictors of injury after comparing LFPI with controls and sham rats. However, further analyses suggested that 2d‐pTAU‐Thr231 and 2d‐S100B plasma levels tracked the craniotomy surgery rather than the LFPI (Figure 5A). Among the LFPI rats, we also found that high 2d‐S100B plasma levels also correlated with better neuromotor functional recovery. Among the peri‐operative factors, recent isoflurane anesthesia, as used in our study, may result in low plasma S100B levels in rabbits 3d after embolic stroke, 53 as well as in patients who underwent bladder cancer resection surgery. 54 The effects of isoflurane on plasma pTAU‐Thr231 are unknown. Craniotomy may also produce mild pathologies in the brain, 55 as also shown here by the mild impairment of neuroscores in Sham rats (Figure 1). Increased expression of pTAU forms has been reported in the brain of patients with TBI or chronic traumatic encephalopathy, in animal models of TBI following time‐, region‐, and phosphorylation site‐specific patterns, but also in other neurological conditions, including dementias or epilepsy. 5 , 35 , 56 , 57 , 58 Elevated blood‐based exosomal pTAU levels have been reported in veterans with remote history of TBI and cognitive impairment, 59 combat‐related repetitive mild TBI, 60 or in acute TBI patients, particularly those with severe TBI and intracranial lesions. 57 Our data on the astroglial marker S100B also appears at odds with the literature; however, our study was done at 2d, rather than the first 6 hours from acute injury, when elevated serum or plasma S100B levels suggest high risk for intracranial lesions, poor outcome after TBI, and blood brain barrier impairment, whereas low initial levels suggest mild TBI and better functional recovery. 61 , 62 , 63 , 64 Serum/plasma S100B exhibits high sensitivity but relatively low specificity as a biomarker of TBI, partially due to extracranial sources of S100B, such as muscle. 63 , 65 The existing clinical studies however do not always demonstrate serum S100B increases after TBI. 66 , 67 In a CENTER‐TBI study of 65 TBI patients, S100B was not among the serum biomarkers that predicted CNS injury in patients with moderate to severe TBI (P = 0.093), or unrecorded Glasgow coma scale (P = 0.512), or the overall cohort (P = 1) and the observed trends in serum S100B levels were either increase or decrease or no change, respectively. 67 In animal models of TBI, S100B was increased peripherally at earlier timepoints in lungs (≤12 hours in 68 ), serum (CCI rat model, 1 day but not at 3‐28 days in 69 ) or plasma (piglet scaled cortical impact, 5‐7 days to 4 months). 70 The estimated short half‐life of S100B may contribute to the early but transient increase in S100B, mostly reflecting de novo release. 66 , 71 , 72
Interestingly, the biomarkers of early seizures were different in LEV‐ vs. vehicle‐treated LFPI rats. In LFPI‐LEV0 rats, early post‐TBI seizures were predicted by lower 2d‐pTAU‐Thr231 and higher 2d‐UCHL1 plasma levels, both of which are reversed by LEV. High plasma 2d‐pTAU‐Thr231 levels were an excellent marker of LEV treatment (ROC AUC = 0.8333; pharmacodynamic biomarker) whereas low 2d‐pTAU‐Thr231 plasma levels track early seizures in the LFPI‐LEV0 rats (ROC AUC = 1) but not in the LFPI‐LEV200 rats, possibly serving as a prognostic biomarker of LEV‐responsive early seizures. The impact of seizures upon peripheral pTAU levels was not investigated. The mechanism through which early post‐LFPI seizures are associated with lower plasma 2d‐pTAU‐Thr231 levels is unclear. It may reflect pathological trapping of pTAU in the brain of animals with seizures or modulation of the blood brain barrier permeability, or plasma clearance, or may be due to technical reasons, such as specificity of antibodies for the various pTAU forms and method of blood collection and processing. Furthermore, the contribution of release from peripheral sources of pTAU cannot be excluded, given that TAU proteins exist in lymphocytes or peripheral tissues. 73 , 74
High‐plasma HMGB1 levels differentiated LEV‐treated rats with (2d, 7d) or without (2d) early seizures from vehicle treated (pharmacodynamic biomarker). We did not find any association of HMGB1 levels with LFPI status. The literature reports variable effects of LFPI on plasma HMGB1 levels, including increased post‐LFPI levels 75 , 76 or no change. 77 , 78 In humans, elevated plasma HMGB1 levels after TBI predicted poor 1 year outcomes and mortality. 79 The prior TBI studies have not addressed the role of various treatments, such as LEV, or early seizures, as done in our study. Seizures may result in increased HMGB1 plasma levels during the first postictal hours in humans, 80 , 81 and in rats 4d after status epilepticus. 82 Interestingly, in a cohort of adults with drug‐resistant temporal lobe epilepsy, plasma HMGB1 levels were lower than controls and were not affected by seizure severity. 83 In our setting, LFPI or early seizures did not alter plasma HMGB1 levels. Similarly, LEV treatment was associated with elevated plasma 7d‐IL‐1β levels, but there was no significant effect of early seizures or LFPI on plasma IL‐1β levels. Although seizures 84 and TBI 85 have been associated with elevated plasma IL‐1β levels, the literature also presents examples where plasma IL‐1β levels, are not elevated after brain trauma 86 , 87 or may be elevated in some but not all patients with severe TBI. 88
In contrast, early seizures despite LEV treatment, i.e., LEV‐resistant early seizures, are predicted by high plasma 2d‐IFNγ levels (response biomarker). Seizures may transiently increase serum biomarkers in humans including TAU, NFL, GFAP, and UCHL1 but this effect is not universal. 89 , 90 The short half‐life of some of these biomarkers (e.g., TAU or UCHL1 in humans) 66 may limit the sensitivity of detection of such early postictal or post‐TBI increases in their levels when biomarkers are assayed at times more distant to the seizures. The LEV binding site, SV2A, is also expressed in peripheral tissues, including lymphocytes, 91 which may release IFNγ, but the exact effects of LEV on IFNγ release in the setting of seizures have not been investigated.
LEV increased selected plasma biomarkers (e.g., 2d‐HMGB1) in rats with or without early seizures, or partially (2d‐pTAU‐Thr231) or fully (2d‐UCHL1) reversed the effects of early seizures upon others. Some of these LEV effects could be considered as partial modification of biomarkers of TBI and associated conditions, such as seizures, since the modified biomarkers emerged as promising biomarkers of LFPI and/or early seizures in our model. However, LEV was not able to reverse all the biomarker changes detected after LFPI or early seizures, for example, 2d‐GFAP, 2d‐S100B, 2d‐IFNγ, whereas LEV treatment increased plasma 2d‐NFL levels in LFPI rats, regardless of the presence of early seizures. LEV was a promising ASM in the Operation Brain Trauma Therapy (OBTT) studies, leading to reduction in hemispheric tissue loss, improvement in visuospatial learning (in the FPI and CCI models; but not in the penetrating ballistic‐like brain injury [PBBI] model) and balance (CCI; but not in FPI or PBBI). 92 We did not see, any beneficial effect of LEV on composite neuroscore assessments. Although it has been reported that LEV may prevent the development of spontaneous epileptiform activity post‐TBI in ex vivo cortical slice experiments, 93 there is no evidence of PTE prevention by LEV in animal models of PTE in vivo. 18 , 19
The LEV effects in LFPI rats could be due to either direct or indirect pharmacological effects of LEV or through modulation of seizures, although its antiseizure effects were not sufficient to reduce the incidence of early seizures in our study. The plasma LEV levels were within the range of the reference or therapeutic plasma LEV levels seen in clinical studies. 94 , 95 Mechanistically, the reversal of early post‐TBI seizure effects on plasma biomarkers (e.g., pTAU‐Thr231, UCHL1) by LEV could be attributed to inhibition of activity‐dependent synaptic transmission, both inhibitory and excitatory, 96 through binding to SV2A, a synaptic vesicle protein involved in activity‐dependent release of neurotransmitters. SV2A reduction may also increase TAU and certain pTAU forms (i.e., pTAU‐Ser356), 97 suggesting that LEV might also directly regulate pTAU, which merits further investigation. In the OBTT, LEV did not alter plasma UCHL1 levels 4‐24 hr after trauma, in any of the 3 models [FPI, CCI, PBBI]. 92 However, the OBTT studies did not report potential interference of early seizures on the LEV effects upon the plasma biomarkers; our findings suggested rather that LEV inhibits the seizure‐induced increase in 2d‐UCHL1. We did not see any significant effect of LEV upon plasma GFAP levels, similar to a previous study in the central fluid percussion micro‐pig model of mild TBI. 98 However, LEV reduced serum GFAP levels within 24 hrs in the CCI and PBBI models. 92 Additionally, LEV has been reported to have anti‐inflammatory or anti‐oxidant effects, preventing blood brain barrier dysfunction, which may contribute to antiseizure effects. 99 , 100 , 101 , 102 , 103 We did not find any LEV‐related changes in other cytokines, such as IL‐6, IL‐1β, TNF in LEV‐treated LFPI rats at 2d or 7d post‐LFPI. Chronic treatment with LEV also did not affect blood cytokines (IL‐6, IL‐1β, TNF) in human patients. 104
Levetiracetam‐treated LFPI rats had higher plasma 2d‐NFL levels compared to vehicle‐treated LFPI rats as well as naïve and controls, whereas vehicle‐treated LFPI rats showed similar 2d‐NFL levels to sham or naïve controls. We observed a positive correlation of 2d‐NFL with longer apnea durations, a marker of injury severity, but only in LEV‐treated rats. There was no impact of LEV treatment on other measures of severity, such as neuroscores to suggest worse outcomes, within the timeframe of this experiment. Serum NFL levels have also been proposed to be a biomarker of seizure‐related neuronal injury in patients with status epilepticus, however, in our analyses, the higher NFL plasma levels in LFPI‐LEV200 rats were independent of early seizures. In the OBTT, LEV reduced the plasma levels of phosphorylated neurofilament heavy chain (pNF‐H) in three models of TBI (controlled cortical impact, parasagittal fluid percussion, penetrating ballistics‐like brain injury), in which pNF‐H had been proposed as a biomarker of traumatic axonal injury in TBI. 105 The effects on NFL were not examined in that study. Overall, our findings strongly suggest that plasma protein biomarkers of injury severity may be modulated by medications that are commonly given in patients with severe TBI, making it important to adopt experimental conditions that resemble the clinical environment.
Elevated NFL levels have been used as a biomarker of TBI severity in humans 106 , 107 , 108 , 109 , 110 , 111 , 112 , 113 , 114 , 115 , 116 and in animal models 117 , 118 , 119 , 120 and have also been proposed to predict progression to brain atrophy and traumatic axonal injury. 106 , 120 In a 1‐year prospective study of 207 patients with mild TBI, plasma GFAP and TAU were increased acutely but NFL was only increased at 2 weeks and 3 months post‐TBI. 121 In veterans with remote history of TBI, blood exosomal NFL levels were increased only in those with cognitive impairment, regardless of prior TBI. 59 Interestingly, elevation of serum NFL was not observed in a systematic review of military‐related concussions, including blast injuries without acute neurological dysfunction. This underlines how critical it is to take into account the biomechanical forces and the primary injury mechanism and the heterogeneity of TBI and also suggests that additional factors control serum NFL levels. 110 In further support of the heterogeneity in biomarker trajectories in TBI patients, the CARE study demonstrated clustering of individuals with or without significant blood NFL increase post‐TBI. 122 NFL is not specific for TBI and elevated plasma or serum levels have been reported in other central or peripheral neurological conditions with neuroaxonal injury, which highlight the importance of considering same‐subject baselines and trajectories of plasma biomarker levels after TBI but also support the value of using panels of biomarkers to improve predictive value and interpretation. 110 , 123
We also identified candidate biomarkers predicting neuromotor functional recovery at 7d after LFPI, which included markers of inflammatory response [(7d‐2d)‐HMGB1, 2d‐HMGB1, and 2d‐TNF] or of astroglial injury and blood brain barrier permeability [(7d‐2d)‐GFAP, 2d‐S100B] (prognostic biomarkers). Interestingly, S100B which predicted neuromotor recovery in our study was also included in the panel of biomarkers that best predicted outcome in humans, as determined by the Glasgow outcome scale, that is, S100B, GFAP, UCHL1, and TAU. 61 Elevated plasma GFAP levels have been associated with higher risk for intracranial lesions after TBI and in some studies with outcomes. 61 , 124 In our study, we found elevated plasma 2d‐GFAP levels in LFPI rats compared to sham rats, even though the difference from naïve rats was not significant.
Sham rats exhibited mild impairments in 2d and 7d neuromotor function compared to baseline, as well as selected plasma biomarker changes compared to naïve rats, that followed the trends seen in LFPI rats: decreased 2d‐pTAU‐Thr231 and 2d‐S100B. These are consistent with reports of mild pathological changes in the brain of sham rats that undergo craniotomy. 55
Limitations of our study include the inclusion of only two timepoints of assessment (2d, 7d) which may not be sensitive in detecting earlier acute post‐TBI changes, particularly of biomarkers with short half‐lives, such as S100B, TAU, or UCHL1, or in tracking the trajectory of changes. It should be taken into account that numerous known and also unknown factors affect plasma levels of protein biomarkers. 125 Our ongoing multicenter longitudinal biomarker studies from the EpiBioS4Rx preclinical project 2, will further test the relevance of these biomarkers across centers, including comparisons with same‐subject baseline and more detailed trajectories across time and correlation with histological changes in the brain and long‐term outcomes. A further limitation is that biomarker levels derived with the RPPM method are expressed as values relative to controls, rather than plasma concentrations. The use of RPPM was however necessary in this exploratory study because, unlike the available clinical assays, it enabled us to study dozens of biomarkers on the same small volume rat plasma samples.
In summary, using machine learning, we report several plasma biomarkers that predict alone or in tandem the craniotomy (2d‐pTAU‐Thr231, 2d‐S100B, diagnostic biomarkers), LEV‐responsive early seizures (2d‐pTAU‐Thr231, 2d‐UCHL1, prognostic biomarkers of early seizures among vehicle‐treated LFPI rats) or LEV response (2d‐HMGB1, pharmacodynamic biomarker), LEV‐resistant early seizures (2d‐IFNγ, response biomarker) or neuromotor functional recovery (HMGB1, TNF, S100B, prognostic biomarkers). Although our study is a preclinical exploratory study and further validation of the biomarker data needs to be done, it carries a strong translational message for the design of future preclinical and clinical biomarker studies for TBI. Our data underline the importance of considering the presence of early seizures as well as of treatments given during the early post‐TBI period, such as LEV, in addition to injury severity and timepoint of assessment that are commonly used, when evaluating the predictive value of biomarkers, as these have pronounced effects on plasma biomarker levels. Furthermore, the heterogeneity of TBI presentations and its reflection on the peripheral biomarkers underlines the value of studying combinations of biomarkers to improve the predictive accuracy.
CONFLICT OF INTEREST STATEMENT
WBM is on the editorial board of Epilepsia Open. JC received research support from Pfizer for a project unrelated to this study. TJO's institution has received funding and consultancy fees from Eisai, UCB, Biogen, Supernus, Praxis, ES Therapeutics, and Epiminder. SLM is serving as Associate Editor of Neurobiology of Disease. He is on the editorial board of Brain and Development, Pediatric Neurology, Annals of Neurology, MedLink and Physiological Research. He receives from Elsevier for his work as Associate Editor in Neurobiology of Disease; annual compensation from MedLink; and royalties from 2 books he co‐edited. DVA is Associate Editor of Frontiers in Neurology, without compensation. ASG is the Editor‐in‐Chief of Epilepsia Open, associate editor of Neurobiology of Disease, and receives royalties from Elsevier (publications, journal editorial board participation), Medlink (publications), and Morgan and Claypool (publications). The other authors do not report conflicts of interests that relate to this study.
Supporting information
Appendix S1.
Figure S1.
Figure S2.
ACKNOWLEDGMENTS
The study was funded by the NINDS Center without Walls, U54 NS100064 (EpiBioS4Rx). Additional research support is listed below. WBM acknowledges grant support by NINDS U54 NS100064, NINDS R01 NS127524, and U.S. Department of Defense (W81XWH2210510, W81XWH2210210). JC was supported by NINDS/NIDDK U54 NS065768, NINDS NS100064, NIMH R01 MH107394, NICHD R21 HD101075, and a research grant from Pfizer. SRS was supported by a NHMRC Career Development Fellowship (#APP1159645). TJOB was supported by a NHMRC Investigator Grant (#APP1176426) and NINDS U54 NS100064, NINDS R01 NS127524. RJS was supported by R01 NS106957, NS127524, and U54 NS100064. SLM is the Charles Frost Chair in Neurosurgery and Neurology and acknowledges grant support by NIH U54 NS100064, NINDS R01 NS127524, and NS43209, U.S. Department of Defense (W81XWH‐18‐1‐0612, W81XWH‐22‐1‐0510, W81XWH‐22‐1‐0210), the Heffer Family and the Segal Family Foundations, and the Abbe Goldstein/Joshua Lurie and Laurie Marsh/Dan Levitz families. ASG acknowledges grant support by NINDS U54 NS100064, NINDS R01 NS127524, R01 NS091170, U.S. Department of Defense (W81XWH‐18‐1‐0612, W81XWH‐22‐1‐0510, W81XWH‐22‐1‐0210), American Epilepsy Society seed grant, the Heffer Family and the Segal Family Foundations, and the Abbe Goldstein/Joshua Lurie and Laurie Marsh/Dan Levitz families. We acknowledge the technical contribution of Dr Christos Lisgaras. We confirm that we have read the Journal's position on issues involved in ethical publication and affirm that this report is consistent with those guidelines.
Saletti PG, Mowrey WB, Liu W, Li Q, McCullough J, Aniceto R, et al. for the EpiBioS4Rx Study Group. Early preclinical plasma protein biomarkers of brain trauma are influenced by early seizures and levetiracetam. Epilepsia Open. 2023;8:586–608. 10.1002/epi4.12738
Patricia G. Saletti and Wenzhu B. Mowrey equal first co‐authorship.
Denes V. Agoston and Aristea S. Galanopoulou equal senior co‐authorship.
Contributor Information
Denes V. Agoston, Email: denes.agoston@usuhs.edu.
Aristea S. Galanopoulou, Email: aristea.galanopoulou@einsteinmed.edu.
REFERENCES
- 1. Ding K, Gupta PK, Diaz‐Arrastia R. Epilepsy after traumatic brain injury. In: Laskowitz D, Grant G, editors. Translational research in traumatic brain injury. Boca Raton, FL: CRC Press/Taylor and Francis Group (c) 2016 by Taylor & Francis Group, LLC.; 2016. [PubMed] [Google Scholar]
- 2. Piccenna L, Shears G, O'Brien TJ. Management of post‐traumatic epilepsy: an evidence review over the last 5 years and future directions. Epilepsia Open. 2017;2:123–44. [DOI] [PMC free article] [PubMed] [Google Scholar]
- 3. Salazar AM, Grafman J. Post‐traumatic epilepsy: clinical clues to pathogenesis and paths to prevention. Handb Clin Neurol. 2015;128:525–38. [DOI] [PubMed] [Google Scholar]
- 4. Pitkanen A, Immonen R. Epilepsy related to traumatic brain injury. Neurotherapeutics. 2014;11:286–96. [DOI] [PMC free article] [PubMed] [Google Scholar]
- 5. Saletti PG, Ali I, Casillas‐Espinosa PM, Semple BD, Lisgaras CP, Moshé SL, et al. In search of antiepileptogenic treatments for post‐traumatic epilepsy. Neurobiol Dis. 2019;123:86–99. [DOI] [PMC free article] [PubMed] [Google Scholar]
- 6. Agoston DV, Kamnaksh A. Protein biomarkers of epileptogenicity after traumatic brain injury. Neurobiol Dis. 2019;123:59–68. [DOI] [PMC free article] [PubMed] [Google Scholar]
- 7. Vespa PM, Nuwer MR, Nenov V, Ronne‐Engstrom E, Hovda DA, Bergsneider M, et al. Increased incidence and impact of nonconvulsive and convulsive seizures after traumatic brain injury as detected by continuous electroencephalographic monitoring. J Neurosurg. 1999;91:750–60. [DOI] [PMC free article] [PubMed] [Google Scholar]
- 8. Vespa PM, McArthur DL, Xu Y, Eliseo M, Etchepare M, Dinov I, et al. Nonconvulsive seizures after traumatic brain injury are associated with hippocampal atrophy. Neurology. 2010;75:792–8. [DOI] [PMC free article] [PubMed] [Google Scholar]
- 9. Tubi MA, Lutkenhoff E, Blanco MB, McArthur D, Villablanca P, Ellingson B, et al. Early seizures and temporal lobe trauma predict post‐traumatic epilepsy: a longitudinal study. Neurobiol Dis. 2019;123:115–21. [DOI] [PMC free article] [PubMed] [Google Scholar]
- 10. Liesemer K, Bratton SL, Zebrack CM, Brockmeyer D, Statler KD. Early post‐traumatic seizures in moderate to severe pediatric traumatic brain injury: rates, risk factors, and clinical features. J Neurotrauma. 2011;28:755–62. [DOI] [PubMed] [Google Scholar]
- 11. Laing J, Gabbe B, Chen Z, Perucca P, Kwan P, O'Brien TJ. Risk factors and prognosis of early posttraumatic seizures in moderate to severe traumatic brain injury. JAMA Neurol. 2022;79:334–41. [DOI] [PMC free article] [PubMed] [Google Scholar]
- 12. Chang BS, Lowenstein DH, Quality Standards Subcommittee of the American Academy of Neurology . Practice parameter: antiepileptic drug prophylaxis in severe traumatic brain injury: report of the Quality Standards Subcommittee of the American Academy of Neurology. Neurology. 2003;60:10–6. [DOI] [PubMed] [Google Scholar]
- 13. Candy N, Tsimiklis C, Poonnoose S, Trivedi R. The use of antiepileptic medication in early post traumatic seizure prophylaxis at a single institution. J Clin Neurosci. 2019;69:198–205. [DOI] [PubMed] [Google Scholar]
- 14. Wat R, Mammi M, Paredes J, Haines J, Alasmari M, Liew A, et al. The effectiveness of antiepileptic medications as prophylaxis of early seizure in patients with traumatic brain injury compared with placebo or No treatment: a systematic review and meta‐analysis. World Neurosurg. 2019;122:433–40. [DOI] [PubMed] [Google Scholar]
- 15. DeGrauw X, Thurman D, Xu L, Kancherla V, DeGrauw T. Epidemiology of traumatic brain injury‐associated epilepsy and early use of anti‐epilepsy drugs: an analysis of insurance claims data, 2004‐2014. Epilepsy Res. 2018;146:41–9. [DOI] [PMC free article] [PubMed] [Google Scholar]
- 16. Zangbar B, Khalil M, Gruessner A, Joseph B, Friese R, Kulvatunyou N, et al. Levetiracetam prophylaxis for post‐traumatic brain injury seizures is ineffective: a propensity score analysis. World J Surg. 2016;40:2667–72. [DOI] [PubMed] [Google Scholar]
- 17. Jones KE, Puccio AM, Harshman KJ, Falcione B, Benedict N, Jankowitz BT, et al. Levetiracetam versus phenytoin for seizure prophylaxis in severe traumatic brain injury. Neurosurg Focus. 2008;25:E3. [DOI] [PMC free article] [PubMed] [Google Scholar]
- 18. Bakr A, Belli A. A systematic review of levetiracetam versus phenytoin in the prevention of late post‐traumatic seizures and survey of UK neurosurgical prescribing practice of antiepileptic medication in acute traumatic brain injury. Br J Neurosurg. 2018;32:237–44. [DOI] [PubMed] [Google Scholar]
- 19. Klein P, Herr D, Pearl PL, Natale J, Levine Z, Nogay C, et al. Results of phase II pharmacokinetic study of levetiracetam for prevention of post‐traumatic epilepsy. Epilepsy Behav. 2012;24:457–61. [DOI] [PMC free article] [PubMed] [Google Scholar]
- 20. Pingue V, Mele C, Nardone A. Post‐traumatic seizures and antiepileptic therapy as predictors of the functional outcome in patients with traumatic brain injury. Sci Rep. 2021;11:4708. [DOI] [PMC free article] [PubMed] [Google Scholar]
- 21. Wagner AK, Miller MA, Scanlon J, Ren D, Kochanek PM, Conley YP. Adenosine A1 receptor gene variants associated with post‐traumatic seizures after severe TBI. Epilepsy Res. 2010;90:259–72. [DOI] [PMC free article] [PubMed] [Google Scholar]
- 22. Diamond ML, Ritter AC, Failla MD, Boles JA, Conley YP, Kochanek PM, et al. IL‐1beta associations with posttraumatic epilepsy development: a genetics and biomarker cohort study. Epilepsia. 2014;55:1109–19. [DOI] [PMC free article] [PubMed] [Google Scholar]
- 23. Darrah SD, Miller MA, Ren D, Hoh NZ, Scanlon JM, Conley YP, et al. Genetic variability in glutamic acid decarboxylase genes: associations with post‐traumatic seizures after severe TBI. Epilepsy Res. 2013;103:180–94. [DOI] [PMC free article] [PubMed] [Google Scholar]
- 24. Diamond ML, Ritter AC, Failla MD, Boles JA, Conley YP, Kochanek PM, et al. IL‐1beta associations with posttraumatic epilepsy development: a genetics and biomarker cohort study. Epilepsia. 2015;56:991–1001. [DOI] [PubMed] [Google Scholar]
- 25. McFadyen CA, Zeiler FA, Newcombe V, Synnot A, Steyerberg E, Gruen RL, et al. Apolipoprotein E4 polymorphism and outcomes from traumatic brain injury: a living systematic review and meta‐analysis. J Neurotrauma. 2021;38:1124–36. [DOI] [PMC free article] [PubMed] [Google Scholar]
- 26. Kim JA, Boyle EJ, Wu AC, Cole AJ, Staley KJ, Zafar S, et al. Epileptiform activity in traumatic brain injury predicts post‐traumatic epilepsy. Ann Neurol. 2018;83:858–62. [DOI] [PMC free article] [PubMed] [Google Scholar]
- 27. Bazarian JJ, Biberthaler P, Welch RD, Lewis LM, Barzo P, Bogner‐Flatz V, et al. Serum GFAP and UCH‐L1 for prediction of absence of intracranial injuries on head CT (ALERT‐TBI): a multicentre observational study. Lancet Neurol. 2018;17:782–9. [DOI] [PubMed] [Google Scholar]
- 28. Anderson TN, Hwang J, Munar M, Papa L, Hinson HE, Vaughan A, et al. Blood‐based biomarkers for prediction of intracranial hemorrhage and outcome in patients with moderate or severe traumatic brain injury. J Trauma Acute Care Surg. 2020;89:80–6. [DOI] [PMC free article] [PubMed] [Google Scholar]
- 29. Dennis EL, Baron D, Bartnik‐Olson B, Caeyenberghs K, Esopenko C, Hillary FG, et al. ENIGMA brain injury: framework, challenges, and opportunities. Hum Brain Mapp. 2022;43:149–166. [DOI] [PMC free article] [PubMed] [Google Scholar]
- 30. Kharatishvili I, Nissinen JP, McIntosh TK, Pitkänen A. A model of posttraumatic epilepsy induced by lateral fluid‐percussion brain injury in rats. Neuroscience. 2006;140:685–97. [DOI] [PubMed] [Google Scholar]
- 31. Liu SJ, Zheng P, Wright DK, Dezsi G, Braine E, Nguyen T, et al. Sodium selenate retards epileptogenesis in acquired epilepsy models reversing changes in protein phosphatase 2A and hyperphosphorylated tau. Brain. 2016;139:1919–38. [DOI] [PubMed] [Google Scholar]
- 32. McIntosh TK, Vink R, Noble L, Yamakami I, Fernyak S, Soares H, et al. Traumatic brain injury in the rat: characterization of a lateral fluid‐percussion model. Neuroscience. 1989;28:233–44. [DOI] [PubMed] [Google Scholar]
- 33. Ndode‐Ekane XE, Santana‐Gomez C, Casillas‐Espinosa PM, Ali I, Brady RD, Smith G, et al. Harmonization of lateral fluid‐percussion injury model production and post‐injury monitoring in a preclinical multicenter biomarker discovery study on post‐traumatic epileptogenesis. Epilepsy Res. 2019;151:7–16. [DOI] [PMC free article] [PubMed] [Google Scholar]
- 34. Reid AY, Bragin A, Giza CC, Staba RJ, Engel J Jr. The progression of electrophysiologic abnormalities during epileptogenesis after experimental traumatic brain injury. Epilepsia. 2016;57:1558–67. [DOI] [PMC free article] [PubMed] [Google Scholar]
- 35. Shultz SR, Wright DK, Zheng P, Stuchbery R, Liu SJ, Sashindranath M, et al. Sodium selenate reduces hyperphosphorylated tau and improves outcomes after traumatic brain injury. Brain. 2015;138:1297–313. [DOI] [PMC free article] [PubMed] [Google Scholar]
- 36. Nissinen J, Andrade P, Natunen T, Hiltunen M, Malm T, Kanninen K, et al. Disease‐modifying effect of atipamezole in a model of post‐traumatic epilepsy. Epilepsy Res. 2017;136:18–34. [DOI] [PubMed] [Google Scholar]
- 37. Pitkanen A, Immonen R, Ndode‐Ekane X, Gröhn O, Stöhr T, Nissinen J. Effect of lacosamide on structural damage and functional recovery after traumatic brain injury in rats. Epilepsy Res. 2014;108:653–65. [DOI] [PubMed] [Google Scholar]
- 38. Akman O, Briggs SW, Mowrey WB, Moshé SL, Galanopoulou AS. Antiepileptogenic effects of rapamycin in a model of infantile spasms due to structural lesions. Epilepsia. 2021;62:1985–99. [DOI] [PMC free article] [PubMed] [Google Scholar]
- 39. Kadam SD, D'Ambrosio R, Duveau V, Roucard C, Garcia‐Cairasco N, Ikeda A, et al. Methodological standards and interpretation of video‐electroencephalography in adult control rodents. A TASK1‐WG1 report of the AES/ILAE translational TASK force of the ILAE. Epilepsia. 2017;58(Suppl 4):10–27. [DOI] [PMC free article] [PubMed] [Google Scholar]
- 40. Kamnaksh A, Puhakka N, Ali I, Smith G, Aniceto R, McCullough J, et al. Harmonization of pipeline for preclinical multicenter plasma protein and miRNA biomarker discovery in a rat model of post‐traumatic epileptogenesis. Epilepsy Res. 2019;149:92–101. [DOI] [PMC free article] [PubMed] [Google Scholar]
- 41. Gyorgy AB, Walker J, Wingo D, Eidelman O, Pollard HB, Molnar A, et al. Reverse phase protein microarray technology in traumatic brain injury. J Neurosci Methods. 2010;192:96–101. [DOI] [PubMed] [Google Scholar]
- 42. Gyorgy B, Modos K, Pallinger E, Pálóczi K, Pásztói M, Misják P, et al. Detection and isolation of cell‐derived microparticles are compromised by protein complexes resulting from shared biophysical parameters. Blood. 2011;117:e39–48. [DOI] [PubMed] [Google Scholar]
- 43. Kamnaksh A, Kwon SK, Kovesdi E, Ahmed F, Barry ES, Grunberg NE, et al. Neurobehavioral, cellular, and molecular consequences of single and multiple mild blast exposure. Electrophoresis. 2012;33:3680–92. [DOI] [PubMed] [Google Scholar]
- 44. Kovesdi E, Kamnaksh A, Wingo D, Ahmed F, Grunberg NE, Long JB, et al. Acute minocycline treatment mitigates the symptoms of mild blast‐induced traumatic brain injury. Front Neurol. 2012;3:111. [DOI] [PMC free article] [PubMed] [Google Scholar]
- 45. Kwon SK, Kovesdi E, Gyorgy AB, Wingo D, Kamnaksh A, Walker J, et al. Stress and traumatic brain injury: a behavioral, proteomics, and histological study. Front Neurol. 2011;2:12. [DOI] [PMC free article] [PubMed] [Google Scholar]
- 46. Rostami E, Davidsson J, Ng KC, Lu J, Gyorgy A, Walker J, et al. A model for mild traumatic brain injury that induces limited transient memory impairment and increased levels of axon related serum biomarkers. Front Neurol. 2012;3:115. [DOI] [PMC free article] [PubMed] [Google Scholar]
- 47. Ahmed FA, Kamnaksh A, Kovesdi E, Long JB, Agoston DV. Long‐term consequences of single and multiple mild blast exposure on select physiological parameters and blood‐based biomarkers. Electrophoresis. 2013;34:2229–33. [DOI] [PubMed] [Google Scholar]
- 48. Wright DK, Trezise J, Kamnaksh A, Bekdash R, Johnston LA, Ordidge R, et al. Behavioral, blood, and magnetic resonance imaging biomarkers of experimental mild traumatic brain injury. Sci Rep. 2016;6:28713. [DOI] [PMC free article] [PubMed] [Google Scholar]
- 49. Wright DK, Brady RD, Kamnaksh A, Trezise J, Sun M, McDonald SJ, et al. Repeated mild traumatic brain injuries induce persistent changes in plasma protein and magnetic resonance imaging biomarkers in the rat. Sci Rep. 2019;9:14626. [DOI] [PMC free article] [PubMed] [Google Scholar]
- 50. Major BP, McDonald SJ, O'Brien WT, Symons GF, Clough M, Costello D, et al. Serum protein biomarker findings reflective of oxidative stress and vascular abnormalities in male, but not female, collision sport athletes. Front Neurol. 2020;11:549624. [DOI] [PMC free article] [PubMed] [Google Scholar]
- 51. Sathe AG, Mishra U, Ivaturi V, Brundage RC, Cloyd JC, Elm JJ, et al. Early exposure of Fosphenytoin, levetiracetam, and valproic acid after high‐dose intravenous administration in young children with benzodiazepine‐refractory status epilepticus. J Clin Pharmacol. 2021;61:763–8. [DOI] [PMC free article] [PubMed] [Google Scholar]
- 52. R Core Team . R: a language and environment for statistical computing. Vienna, Austria: R Foundation for Statistical Computing; 2021. https://www.R‐project.org/ [Google Scholar]
- 53. Chen F, Long Z, Yin J, Zuo Z, Li H. Isoflurane post‐treatment improves outcome after an embolic stroke in rabbits. PLoS One. 2015;10:e0143931. [DOI] [PMC free article] [PubMed] [Google Scholar]
- 54. Guan X, Peng Q, Liu Y, Wang J. Effects of propofol intravenous anesthesia on serum NGF, S100B protein, and immune function in patients with bladder cancer after resection. Comput Math Methods Med. 2022;2022:5409323. [DOI] [PMC free article] [PubMed] [Google Scholar]
- 55. Cole JT, Yarnell A, Kean WS, Gold E, Lewis B, Ren M, et al. Craniotomy: true sham for traumatic brain injury, or a sham of a sham? J Neurotrauma. 2011;28:359–69. [DOI] [PMC free article] [PubMed] [Google Scholar]
- 56. Chung DC, Roemer S, Petrucelli L, Dickson DW. Cellular and pathological heterogeneity of primary tauopathies. Mol Neurodegener. 2021;16:57. [DOI] [PMC free article] [PubMed] [Google Scholar]
- 57. Rubenstein R, Chang B, Yue JK, Chiu A, Winkler EA, Puccio AM, et al. Comparing plasma Phospho tau, Total tau, and Phospho tau‐Total tau ratio as acute and chronic traumatic brain injury biomarkers. JAMA Neurol. 2017;74:1063–72. [DOI] [PMC free article] [PubMed] [Google Scholar]
- 58. Saletti PG, Casillas‐Espinosa PM, Lisgaras CP, Mowrey WB, Li Q, Liu W, et al. TAU phosphorylation patterns in the rat cerebral cortex after traumatic brain injury and sodium selenate effects: an EpiBioS4Rx project 2 study. J Neurotrauma. 2023; doi: 10.1089/neu.2022.0219. In press. [DOI] [PMC free article] [PubMed] [Google Scholar]
- 59. Peltz CB, Kenney K, Gill J, Diaz‐Arrastia R, Gardner RC, Yaffe K. Blood biomarkers of traumatic brain injury and cognitive impairment in older veterans. Neurology. 2020;95:e1126–33. [DOI] [PMC free article] [PubMed] [Google Scholar]
- 60. Kenney K, Qu BX, Lai C, Devoto C, Motamedi V, Walker WC, et al. Higher exosomal phosphorylated tau and total tau among veterans with combat‐related repetitive chronic mild traumatic brain injury. Brain Inj. 2018;32:1276–84. [DOI] [PubMed] [Google Scholar]
- 61. Thelin E, Al Nimer F, Frostell A, Zetterberg H, Blennow K, Nyström H, et al. A serum protein biomarker panel improves outcome prediction in human traumatic brain injury. J Neurotrauma. 2019;36:2850–62. [DOI] [PMC free article] [PubMed] [Google Scholar]
- 62. Marchi N, Rasmussen P, Kapural M, Fazio V, Kight K, Mayberg MR, et al. Peripheral markers of brain damage and blood‐brain barrier dysfunction. Restor Neurol Neurosci. 2003;21:109–21. [PMC free article] [PubMed] [Google Scholar]
- 63. Mehta T, Fayyaz M, Giler GE, Kaur H, Raikwar SP, Kempuraj D, et al. Current trends in biomarkers for traumatic brain injury. Open Access J Neurol Neurosurg. 2020;12:86–94. [PMC free article] [PubMed] [Google Scholar]
- 64. Mondello S, Sorinola A, Czeiter E, Vámos Z, Amrein K, Synnot A, et al. Blood‐based protein biomarkers for the management of traumatic brain injuries in adults presenting to emergency departments with mild brain injury: a living systematic review and meta‐analysis. J Neurotrauma. 2021;38:1086–106. [DOI] [PMC free article] [PubMed] [Google Scholar]
- 65. Bloomfield SM, McKinney J, Smith L, Brisman J. Reliability of S100B in predicting severity of central nervous system injury. Neurocrit Care. 2007;6:121–38. [DOI] [PubMed] [Google Scholar]
- 66. Hier DB, Obafemi‐Ajayi T, Thimgan MS, Olbricht GR, Azizi S, Allen B, et al. Blood biomarkers for mild traumatic brain injury: a selective review of unresolved issues. Biomark Res. 2021;9:70. [DOI] [PMC free article] [PubMed] [Google Scholar]
- 67. Richter S, Winzeck S, Czeiter E, Amrein K, Kornaropoulos EN, Verheyden J, et al. Serum biomarkers identify critically ill traumatic brain injury patients for MRI. Crit Care. 2022;26:369. [DOI] [PMC free article] [PubMed] [Google Scholar]
- 68. Gu Z, Li L, Li Q, Tan H, Zou Z, Chen X, et al. Polydatin alleviates severe traumatic brain injury induced acute lung injury by inhibiting S100B mediated NETs formation. Int Immunopharmacol. 2021;98:107699. [DOI] [PubMed] [Google Scholar]
- 69. Thelin EP, Frostell A, Mulder J, Mitsios N, Damberg P, Aski SN, et al. Lesion size is exacerbated in hypoxic rats whereas hypoxia‐inducible Factor‐1 alpha and vascular endothelial growth factor increase in injured normoxic rats: a prospective cohort study of secondary hypoxia in focal traumatic brain injury. Front Neurol. 2016;7:23. [DOI] [PMC free article] [PubMed] [Google Scholar]
- 70. Costine BA, Quebeda‐Clerkin PB, Dodge CP, Harris BT, Hillier SC, Duhaime AC. Neuron‐specific enolase, but not S100B or myelin basic protein, increases in peripheral blood corresponding to lesion volume after cortical impact in piglets. J Neurotrauma. 2012;29:2689–95. [DOI] [PMC free article] [PubMed] [Google Scholar]
- 71. Ercole A, Thelin EP, Holst A, Bellander BM, Nelson DW. Kinetic modelling of serum S100b after traumatic brain injury. BMC Neurol. 2016;16:93. [DOI] [PMC free article] [PubMed] [Google Scholar]
- 72. Jonsson H, Johnsson P, Hoglund P, Alling C, Blomquist S. Elimination of S100B and renal function after cardiac surgery. J Cardiothorac Vasc Anesth. 2000;14:698–701. [DOI] [PubMed] [Google Scholar]
- 73. Kvetnoy IM, Hernandez‐Yago J, Kvetnaia TV, Khavinson VK, Malinin VV, Yarilin AA, et al. Tau‐protein expression in human blood lymphocytes: a promising marker and suitable sample for life‐time diagnosis of Alzheimer's disease. Neuro Endocrinol Lett. 2000;21:313–8. [PubMed] [Google Scholar]
- 74. Shults NV, Seeherman S, Sariipek NE, Rybka V, Marcocci L, Gychka SG, et al. Tau protein in smooth muscle cells and tissues. bioRxiv. 2020. doi: 10.1101/2020.10.15.341867 [DOI] [Google Scholar]
- 75. Okuma Y, Liu K, Wake H, Takahashi Y, Hishikawa T, Yasuhara T, et al. Anti‐high mobility group box‐1 antibody therapy for traumatic brain injury. Ann Neurol. 2012;72:373–84. [DOI] [PubMed] [Google Scholar]
- 76. Okuma Y, Wake H, Teshigawara K, Takahashi Y, Hishikawa T, Yasuhara T, et al. Anti‐high mobility group box 1 antibody therapy may prevent cognitive dysfunction after traumatic brain injury. World Neurosurg. 2019;122:e864–71. [DOI] [PubMed] [Google Scholar]
- 77. Kyyriainen J, Kajevu N, Banuelos I, Lara L, Lipponen A, Balosso S, et al. Targeting oxidative stress with antioxidant Duotherapy after experimental traumatic brain injury. Int J Mol Sci. 2021;22:10555. [DOI] [PMC free article] [PubMed] [Google Scholar]
- 78. Webster KM, Sun M, Crack PJ, O'Brien TJ, Shultz SR, Semple BD. Age‐dependent release of high‐mobility group box protein‐1 and cellular neuroinflammation after traumatic brain injury in mice. J Comp Neurol. 2019;527:1102–17. [DOI] [PubMed] [Google Scholar]
- 79. Wang KY, Yu GF, Zhang ZY, Huang Q, Dong XQ. Plasma high‐mobility group box 1 levels and prediction of outcome in patients with traumatic brain injury. Clin Chim Acta. 2012;413:1737–41. [DOI] [PubMed] [Google Scholar]
- 80. Nass RD, Wagner M, Surges R, Holdenrieder S. Time courses of HMGB1 and other inflammatory markers after generalized convulsive seizures. Epilepsy Res. 2020;162:106301. [DOI] [PubMed] [Google Scholar]
- 81. Zhu M, Chen J, Guo H, Ding L, Zhang Y, Xu Y. High mobility group protein B1 (HMGB1) and interleukin‐1beta as prognostic biomarkers of epilepsy in children. J Child Neurol. 2018;33:909–17. [DOI] [PubMed] [Google Scholar]
- 82. Pauletti A, Terrone G, Shekh‐Ahmad T, Salamone A, Ravizza T, Rizzi M, et al. Targeting oxidative stress improves disease outcomes in a rat model of acquired epilepsy. Brain. 2019;142:e39. [DOI] [PMC free article] [PubMed] [Google Scholar]
- 83. Panina YS, Timechko EE, Usoltseva AA, Yakovleva KD, Kantimirova EA, Dmitrenko DV. Biomarkers of drug resistance in temporal lobe epilepsy in adults. Metabolites. 2023;13:83. [DOI] [PMC free article] [PubMed] [Google Scholar]
- 84. Terrone G, Frigerio F, Balosso S, Ravizza T, Vezzani A. Inflammation and reactive oxygen species in status epilepticus: biomarkers and implications for therapy. Epilepsy Behav. 2019;101:106275. [DOI] [PubMed] [Google Scholar]
- 85. Arora P, Singh K, Kumari M, Trivedi R. Temporal profile of serum metabolites and inflammation following closed head injury in rats is associated with HPA axis hyperactivity. Metabolomics. 2022;18:28. [DOI] [PubMed] [Google Scholar]
- 86. Kerr N, Lee SW, Perez‐Barcena J, Crespi C, Ibañez J, Bullock MR, et al. Inflammasome proteins as biomarkers of traumatic brain injury. PLoS One. 2018;13:e0210128. [DOI] [PMC free article] [PubMed] [Google Scholar]
- 87. Kamm K, Vanderkolk W, Lawrence C, Jonker M, Davis AT. The effect of traumatic brain injury upon the concentration and expression of interleukin‐1beta and interleukin‐10 in the rat. J Trauma. 2006;60:152–7. [DOI] [PubMed] [Google Scholar]
- 88. Tasci A, Okay O, Gezici AR, Ergün R, Ergüngör F. Prognostic value of interleukin‐1 beta levels after acute brain injury. Neurol Res. 2003;25:871–4. [DOI] [PubMed] [Google Scholar]
- 89. Nass RD, Akgun K, Elger C, Reichmann H, Wagner M, Surges R, et al. Serum biomarkers of cerebral cellular stress after self‐limiting tonic clonic seizures: an exploratory study. Seizure. 2021;85:1–5. [DOI] [PubMed] [Google Scholar]
- 90. Palmio J, Suhonen J, Keranen T, Hulkkonen J, Peltola J, Pirttilä T. Cerebrospinal fluid tau as a marker of neuronal damage after epileptic seizure. Seizure. 2009;18:474–7. [DOI] [PubMed] [Google Scholar]
- 91. Li G, Nowak M, Bauer S, Schlegel K, Stei S, Allenhöfer L, et al. Levetiracetam but not valproate inhibits function of CD8+ T lymphocytes. Seizure. 2013;22:462–6. [DOI] [PubMed] [Google Scholar]
- 92. Browning M, Shear DA, Bramlett HM, Dixon CE, Mondello S, Schmid KE, et al. Levetiracetam treatment in traumatic brain injury: operation brain trauma therapy. J Neurotrauma. 2016;33:581–94. [DOI] [PubMed] [Google Scholar]
- 93. Yang L, Afroz S, Valsamis HA, Michelson HB, Goodman JH, Ling DSF. Early intervention with levetiracetam prevents the development of cortical hyperexcitability and spontaneous epileptiform activity in two models of neurotrauma in rats. Exp Neurol. 2021;337:113571. [DOI] [PubMed] [Google Scholar]
- 94. Patsalos PN, Berry DJ, Bourgeois BF, Cloyd JC, Glauser TA, Johannessen SI, et al. Antiepileptic drugs–best practice guidelines for therapeutic drug monitoring: a position paper by the subcommission on therapeutic drug monitoring, ILAE commission on therapeutic strategies. Epilepsia. 2008;49:1239–76. [DOI] [PubMed] [Google Scholar]
- 95. Stepanova D, Beran RG. Measurement of levetiracetam drug levels to assist with seizure control and monitoring of drug interactions with other anti‐epileptic medications (AEMs). Seizure. 2014;23:371–6. [DOI] [PubMed] [Google Scholar]
- 96. Meehan AL, Yang X, Yuan LL, Rothman SM. Levetiracetam has an activity‐dependent effect on inhibitory transmission. Epilepsia. 2012;53:469–76. [DOI] [PubMed] [Google Scholar]
- 97. Kong Y, Huang L, Li W, Liu X, Zhou Y, Liu C, et al. The synaptic vesicle protein 2A interacts with key pathogenic factors in Alzheimer's disease: implications for treatment. Front Cell Dev Biol. 2021;9:609908. [DOI] [PMC free article] [PubMed] [Google Scholar]
- 98. Lafrenaye A, Mondello S, Povlishock J, Gorse K, Walker S, Hayes R, et al. Operation brain trauma therapy: an exploratory study of levetiracetam treatment following mild traumatic brain injury in the micro pig. Front Neurol. 2020;11:586958. [DOI] [PMC free article] [PubMed] [Google Scholar]
- 99. Gurses C, Ekizoglu O, Orhan N, Ustek D, Arican N, Ahishali B, et al. Levetiracetam decreases the seizure activity and blood‐brain barrier permeability in pentylenetetrazole‐kindled rats with cortical dysplasia. Brain Res. 2009;1281:71–83. [DOI] [PubMed] [Google Scholar]
- 100. Ahishali B, Kaya M, Orhan N, Arican N, Ekizoglu O, Elmas I, et al. Effects of levetiracetam on blood‐brain barrier disturbances following hyperthermia‐induced seizures in rats with cortical dysplasia. Life Sci. 2010;87:609–19. [DOI] [PubMed] [Google Scholar]
- 101. Itoh K, Ishihara Y, Komori R, Nochi H, Taniguchi R, Chiba Y, et al. Levetiracetam treatment influences blood‐brain barrier failure associated with angiogenesis and inflammatory responses in the acute phase of epileptogenesis in post‐status epilepticus mice. Brain Res. 2016;1652:1–13. [DOI] [PubMed] [Google Scholar]
- 102. Zhang Y, Li Y, Zuo L, Bao H, Xu X, Hao J, et al. Levetiracetam prevents perforin mediated neuronal injury induced by acute cerebral ischemia reperfusion. Mol Neurobiol. 2016;53:5480–91. [DOI] [PubMed] [Google Scholar]
- 103. Itoh K, Inamine M, Oshima W, Kotani M, Chiba Y, Ueno M, et al. Prevention of status epilepticus‐induced brain edema and neuronal cell loss by repeated treatment with high‐dose levetiracetam. Brain Res. 2015;1608:225–34. [DOI] [PubMed] [Google Scholar]
- 104. Guenther S, Bauer S, Hagge M, Knake S, Olmes DG, Tackenberg B, et al. Chronic valproate or levetiracetam treatment does not influence cytokine levels in humans. Seizure. 2014;23:666–9. [DOI] [PubMed] [Google Scholar]
- 105. Yang Z, Zhu T, Mondello S, Akel M, Wong AT, Kothari IM, et al. Serum‐based Phospho‐neurofilament‐heavy protein as Theranostic biomarker in three models of traumatic brain injury: an operation brain trauma therapy study. J Neurotrauma. 2019;36:348–59. [DOI] [PubMed] [Google Scholar]
- 106. Shahim P, Politis A, van der Merwe A, Moore B, Ekanayake V, Lippa SM, et al. Time course and diagnostic utility of NfL, tau, GFAP, and UCH‐L1 in subacute and chronic TBI. Neurology. 2020;95:e623–36. [DOI] [PMC free article] [PubMed] [Google Scholar]
- 107. Czeiter E, Amrein K, Gravesteijn BY, Lecky F, Menon DK, Mondello S, et al. Blood biomarkers on admission in acute traumatic brain injury: relations to severity, CT findings and care path in the CENTER‐TBI study. EBioMedicine. 2020;56:102785. [DOI] [PMC free article] [PubMed] [Google Scholar]
- 108. Gao W, Zhang Z, Lv X, Wu Q, Yan J, Mao G, et al. Neurofilament light chain level in traumatic brain injury: a system review and meta‐analysis. Medicine (Baltimore). 2020;99:e22363. [DOI] [PMC free article] [PubMed] [Google Scholar]
- 109. Ljungqvist J, Zetterberg H, Mitsis M, Blennow K, Skoglund T. Serum neurofilament light protein as a marker for diffuse axonal injury: results from a case series study. J Neurotrauma. 2017;34:1124–7. [DOI] [PubMed] [Google Scholar]
- 110. Karantali E, Kazis D, McKenna J, Chatzikonstantinou S, Petridis F, Mavroudis I. Neurofilament light chain in patients with a concussion or head impacts: a systematic review and meta‐analysis. Eur J Trauma Emerg Surg. 2021;48:1555–67. [DOI] [PubMed] [Google Scholar]
- 111. McDonald SJ, O'Brien WT, Symons GF, Chen Z, Bain J, Major BP, et al. Prolonged elevation of serum neurofilament light after concussion in male Australian football players. Biomark Res. 2021;9:4. [DOI] [PMC free article] [PubMed] [Google Scholar]
- 112. Shahim P, Zetterberg H, Tegner Y, Blennow K. Serum neurofilament light as a biomarker for mild traumatic brain injury in contact sports. Neurology. 2017;88:1788–94. [DOI] [PMC free article] [PubMed] [Google Scholar]
- 113. Dickstein DL, De Gasperi R, Gama Sosa MA, Perez‐Garcia G, Short JA, Sosa H, et al. Brain and blood biomarkers of tauopathy and neuronal injury in humans and rats with neurobehavioral syndromes following blast exposure. Mol Psychiatry. 2020;26:5940–54. [DOI] [PMC free article] [PubMed] [Google Scholar]
- 114. Gill J, Latour L, Diaz‐Arrastia R, Motamedi V, Turtzo C, Shahim P, et al. Glial fibrillary acidic protein elevations relate to neuroimaging abnormalities after mild TBI. Neurology. 2018;91:e1385–9. [DOI] [PMC free article] [PubMed] [Google Scholar]
- 115. Shahim P, Gill JM, Blennow K, et al. Fluid biomarkers for chronic traumatic encephalopathy. Semin Neurol. 2020;40:411–9. [DOI] [PubMed] [Google Scholar]
- 116. Shahim P, Politis A, van der Merwe A, Zetterberg H. Neurofilament light as a biomarker in traumatic brain injury. Neurology. 2020;95:e610–22. [DOI] [PMC free article] [PubMed] [Google Scholar]
- 117. Shin S, Hefti MM, Mazandi VM, Issadore DA, Meaney DF, Schneider ALC, et al. Plasma neurofilament light and glial fibrillary acidic protein levels over 30 days in a porcine model of traumatic brain injury. J Neurotrauma. 2022;39:935–43. [DOI] [PMC free article] [PubMed] [Google Scholar]
- 118. O'Brien WT, Pham L, Brady RD, Bain J, Yamakawa GR, Sun M, et al. Temporal profile and utility of serum neurofilament light in a rat model of mild traumatic brain injury. Exp Neurol. 2021;341:113698. [DOI] [PubMed] [Google Scholar]
- 119. Scrimgeour AG, Condlin ML, Loban A, DeMar JC. Omega‐3 fatty acids and vitamin D decrease plasma T‐tau, GFAP, and UCH‐L1 in experimental traumatic brain injury. Front Nutr. 2021;8:685220. [DOI] [PMC free article] [PubMed] [Google Scholar]
- 120. Graham NSN, Zimmerman KA, Moro F, Heslegrave A, Maillard SA, Bernini A, et al. Axonal marker neurofilament light predicts long‐term outcomes and progressive neurodegeneration after traumatic brain injury. Sci Transl Med. 2021;13:eabg9922. [DOI] [PubMed] [Google Scholar]
- 121. Clarke GJB, Skandsen T, Zetterberg H, Einarsen CE, Feyling C, Follestad T, et al. One‐year prospective study of plasma biomarkers from CNS in patients with mild traumatic brain injury. Front Neurol. 2021;12:643743. [DOI] [PMC free article] [PubMed] [Google Scholar]
- 122. Bui LA, Yeboah D, Steinmeister L, Azizi S, Hier DB, Wunsch DC, et al. Heterogeneity in blood biomarker trajectories after mild TBI revealed by unsupervised learning. IEEE/ACM Trans Comput Biol Bioinform. 2021;19:1365–78. [DOI] [PubMed] [Google Scholar]
- 123. Lambertsen KL, Soares CB, Gaist D, Nielsen HH. Neurofilaments: the C‐reactive protein of neurology. Brain Sci. 2020;10:56. [DOI] [PMC free article] [PubMed] [Google Scholar]
- 124. Korley FK, Yue JK, Wilson DH, Hrusovsky K, Diaz‐Arrastia R, Ferguson AR, et al. Performance evaluation of a multiplex assay for simultaneous detection of four clinically relevant traumatic brain injury biomarkers. J Neurotrauma. 2018;36:182–7. [DOI] [PMC free article] [PubMed] [Google Scholar]
- 125. McDonald SJ, Shultz SR, Agoston DV. The known unknowns: an overview of the state of blood‐based protein biomarkers of mild traumatic brain injury. J Neurotrauma. 2021;38:2652–66. [DOI] [PubMed] [Google Scholar]
Associated Data
This section collects any data citations, data availability statements, or supplementary materials included in this article.
Supplementary Materials
Appendix S1.
Figure S1.
Figure S2.